. 2017 Nov 17;8(1):1588.
doi: 10.1038/s41467-017-01577-2.

Uplift of the central transantarctic mountains

Affiliations

Uplift of the central transantarctic mountains

Phil Wannamaker et al. Nat Commun. .

Erratum in

Abstract

The Transantarctic Mountains (TAM) are the world's longest rift shoulder but the source of their high elevation is enigmatic. To discriminate the importance of mechanical vs. thermal sources of support, a 550 km-long transect of magnetotelluric geophysical soundings spanning the central TAM was acquired. These data reveal a lithosphere of high electrical resistivity to at least 150 km depth, implying a cold stable state well into the upper mantle. Here we find that the central TAM most likely are elevated by a non-thermal, flexural cantilever mechanism which is perhaps the most clearly expressed example anywhere. West Antarctica in this region exhibits a low resistivity, moderately hydrated asthenosphere, and concentrated extension (rift necking) near the central TAM range front but with negligible thermal encroachment into the TAM. Broader scale heat flow of east-central West Antarctica appears moderate, on the order of 60-70 mW m-2, lower than that of the U.S. Great Basin.


Conflict of interest statement

The authors declare no competing financial interests.

Figures

Fig. 1
Fig. 1
MT site locations across the central TAM and surroundings. Locations and physical features are plotted using a MODIS satellite base map. Grid north is up and both latitude–longitude and Universal Polar Stereographic (UPS) coordinates are overlain on main panel. Orange diamond denotes CTAM multi-investigator camp location active during 2010–11 austral summer season (orange sites), whereas yellow diamond denotes Ross Ice Shelf field camp (RISC) for 2011–12 season (yellow sites). Specific sites discussed in text are labeled. The sole passive seismic station, within the field of view is MILR. Beardmore and Nimrod glaciers are BM and NR, whereas RIS and PPl are Ross Ice Shelf and Polar Plateau, respectively. Within the TAM, the MT transect lies along the lesser Law–Walcott–Lennox–King glaciers. In the inset, WA and West Antarctica, EA is East Antarctica, SP is South Pole, and RI is Ross Island
Fig. 2
Fig. 2
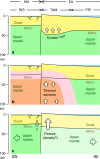
Hypothetical uplift mechanisms for TAM rift shoulder. These are a buoyant uplift via low-density crustal root; b uplift via lateral heating, thermal expansion, and possible melting; c uplift via other mechanisms such as lithospheric cantilevered flexure with or without regional density contrasts. Physiographic regions include West Antarctica (WA), East Antarctica (EA), Ross Ice Shelf (RIS), Transantarctic Mountains (TAM), and Polar Plateau (PPl). Diagram not to scale
Fig. 3
Fig. 3
Example MT responses CTAM survey area. Shown are off-diagonal apparent resistivities ρxy and ρyx (a, b) and impedance phases φxy and φyx (c, d) as a function of period T at polar plateau (PPl) site B22 (Fig. 1) corresponding to high- (left) and low- (right) activity times of the diurnal geomagnetic variation signal during the seven day recording interval of January 11 through January 18, 2012. The error floors assigned in the non-linear 3D inversion are reflected in the error bars, and are similar to the data symbol heights. The computed ρa and φ responses from the inversion model of Fig. 6 are plotted as solid lines
Fig. 4
Fig. 4
Pseudosections of primary MT observations. These are plotted as a function of period (T) and distance, both observed and computed from inversion, for stations along the central profile of Fig. 1. These include apparent resistivities ρxy and ρyx, and impedance phases φxy and φyx, from the off-diagonal impedance elements, and the real (in-phase) component of the complex tippers Kzx and Kzy. The x axis for data definition is grid N315°. To ease finite element mesh discretization requirements, the 3D inversion only considered data for T > 0.1 s. Included for comparison with the 3D analysis is the calculated response of a purely 2D inversion model described in “Methods” with Supplementary Fig. 14. Physiographic regions are as in Fig. 2. An additional plot of Fig. 4 using a spectral color scheme is presented as Supplementary Fig. 5
Fig. 5
Fig. 5
Central portion of hexahedral finite element mesh. This mesh is used to simulate and invert MT data across the central Transantarctic Mountains. Element elevations are indicated by color. Each element is a parameter in the regularized data inversion. The mesh coordinates are local, where (0, 0) corresponds to UPS (2006835.5E, 977476N)
Fig. 6
Fig. 6
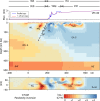
Three-dimensional resistivity inversion model for the central TAM. Physiographic regions are as in Fig. 2. Section view is slightly meandering to pass through stations of the main profile (Supplementary Fig. 11). Important model features interpreted include West Antarctic lithosphere (WL), active rift necking (RN), regional boundary fault (BF, schematic), TAM lithosphere (TL), Precambrian metasedimentary domain (MS), West Antarctic asthenosphere (WA A), and East Antarctic craton (EA C). Plan view in lower panel is shown at depth of 34 km over a width of 135 km, with MT stations as white dots. An additional plot of Fig. 6 using a spectral color scheme is presented as Supplementary Fig. 6

References

    1. Wernicke B, et al. Origin of high mountains in the continents: the Southern Sierra Nevada. Science. 1996;271:190–193. doi: 10.1126/science.271.5246.190. - DOI
    1. Turcotte, D. & Schubert, G. Geodynamics 2nd edn (Cambridge Univ. Press, Cambridge, 2002).
    1. Gilbert H, et al. Imaging lithospheric foundering in the structure of the Sierra Nevada. Geosphere. 2012;8:1310–1330. doi: 10.1130/GES00790.1. - DOI
    1. Wannamaker P, et al. Lithospheric dismemberment and magmatic processes of the Great Basin-Colorado Plateau transition, Utah, implied from magnetotellurics. Geochem. Geophys. Geosyst. 2006;9:Q05019.
    1. Levander A, et al. Continuing Colorado plateau uplift by delamination-style convective lithospheric downwelling. Nature. 2011;472:461–466. doi: 10.1038/nature10001. - DOI - PubMed

Publication types

LinkOut - more resources