. 2017 Nov 17;7(1):15758.
doi: 10.1038/s41598-017-15966-6.

Dynamics of high frequency brain activity

Affiliations

Dynamics of high frequency brain activity

Steven X Moffett et al. Sci Rep. .

Abstract

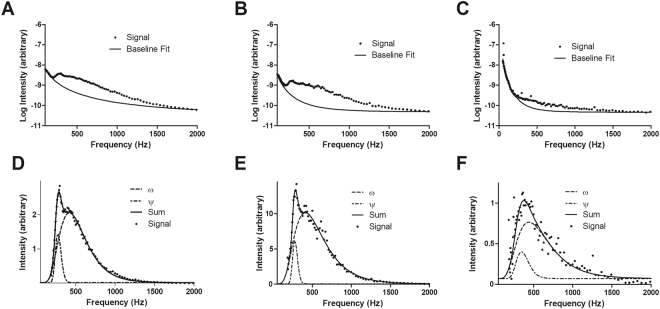
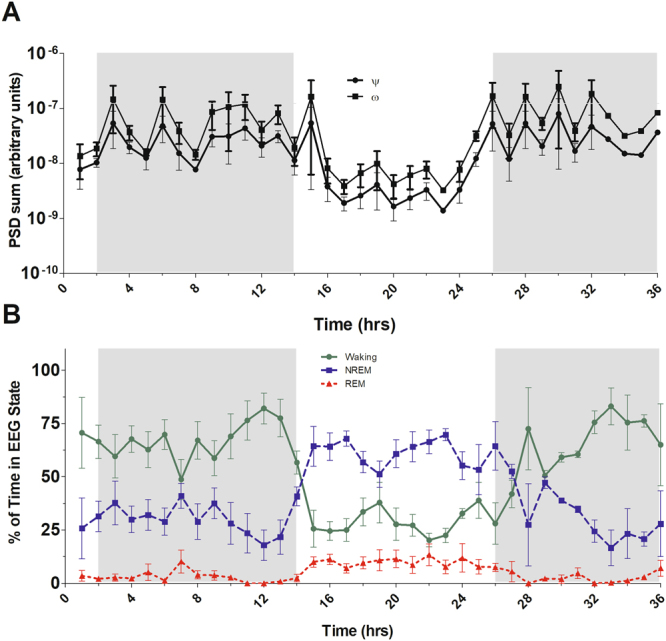
Evidence suggests that electroencephalographic (EEG) activity extends far beyond the traditional frequency range. Much of the prior study of >120 Hz EEG is in epileptic brains. In the current work, we measured EEG activity in the range of 200 to 2000 Hz, in the brains of healthy, spontaneously behaving rats. Both arrhythmic (1/f-type) and rhythmic (band) activities were identified and their properties shown to depend on EEG-defined stage of sleep/wakefulness. The inverse power law exponent of 1/f-type noise is shown to decrease from 3.08 in REM and 2.58 in NonREM to a value of 1.99 in the Waking state. Such a trend represents a transition from long- to short-term memory processes when examined in terms of the corresponding Hurst index. In addition, treating the 1/f-type activity as baseline noise reveals the presence of two, newly identified, high frequency EEG bands. The first band (ψ) is centered between 260-280 Hz; the second, and stronger, band is a broad peak in the 400-500 Hz range (termed ω). Both of these peaks display lognormal distributions. The functional significance of these frequency bands is supported by the variation in the strength of the peaks with EEG-defined sleep/wakefulness.


Conflict of interest statement

The authors declare that they have no competing interests.

Figures

Figure 1
Figure 1
Summation of high-frequency brain activity signal data in different EEG states and characterization of ψ and ω frequency bands. Panels A–C show the overall high-frequency brain activity signal data (dots) from 100–2000 Hz as well as the 1/f-type baseline (solid). Each spectrum is an averaged Fourier analysis of high-frequency signal (1–2000 Hz) during EEG-defined intervals of waking (A), NonREM sleep (B), and REM sleep (C). Panels D–F show the signal (dots), along with curve-fitted sum (solid), as well as the peaks corresponding to the ψ band (lower trace) and the ω band (upper trace) during periods of waking (D), NonREM sleep (E), and REM sleep (F). The data are averages of results from 3 rats.
Figure 2
Figure 2
Power spectrum density of ψ and ω and percentage of mean wakefulness, NonREM sleep, and REM sleep for each one-hour period over 36 hours. The power spectrum density sum was calculated for each hour over 36 hours. Panel (A) represents the ψ frequency band (285–315 Hz, squares) and the ω frequency band (385–585 Hz, filled circles). Panel (B) shows the percentage of mean wakefulness (solid with filled circles), NonREM sleep (dashes with squares), and REM sleep (dots with triangles) over 36 hours. The shaded area denotes the 12-hour dark phase of the light-dark cycle. The data are average results from three rats and the error bars indicate standard errors of the mean.

References

    1. Groppe DM, et al. Dominant frequencies of resting human brain activity as measured by the electrocorticogram. NeuroImage. 2013;79:223–233. doi: 10.1016/j.neuroimage.2013.04.044. - DOI - PMC - PubMed
    1. Buzsáki, G. Rhythms of the Brain. (Oxford University Press, 2006).
    1. Engel J, Bragin A, Staba R, Mody I. High-frequency oscillations: What is normal and what is not? Epilepsia. 2009;50:598–604. doi: 10.1111/j.1528-1167.2008.01917.x. - DOI - PubMed
    1. Jones MS, MacDonald KD, Choi B, Dudek FE, Barth DS. Intracellular correlates of fast (>200 Hz) electrical oscillations in rat somatosensory cortex. Journal of Neurophysiology. 2000;84:1505–1518. doi: 10.1152/jn.2000.84.3.1505. - DOI - PubMed
    1. Klostermann, F., Gobbele, R., Buchner, H. & Curio, G. Intrathalamic non-propagating generators of high-frequency (1000 Hz) somatosensory evoked potential (SEP) bursts recorded subcortically in man. Clinical Neurophysiology 113, 1001-1005, Pii S1388-2457(02)00119-0. 10.1016/S1388-2457(02)00119-0 (2002). - PubMed

LinkOut - more resources