. 2018 May;30(2):695-713.
doi: 10.1017/S0954579417001572. Epub 2017 Nov 20.

Dysregulation in children: Origins and implications from age 5 to age 28

Affiliations

Dysregulation in children: Origins and implications from age 5 to age 28

Maureen E McQuillan et al. Dev Psychopathol. 2018 May.

Abstract

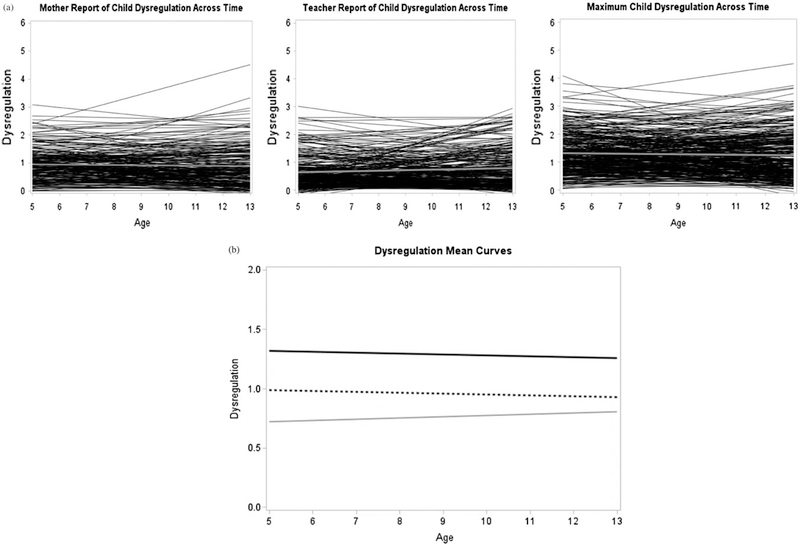
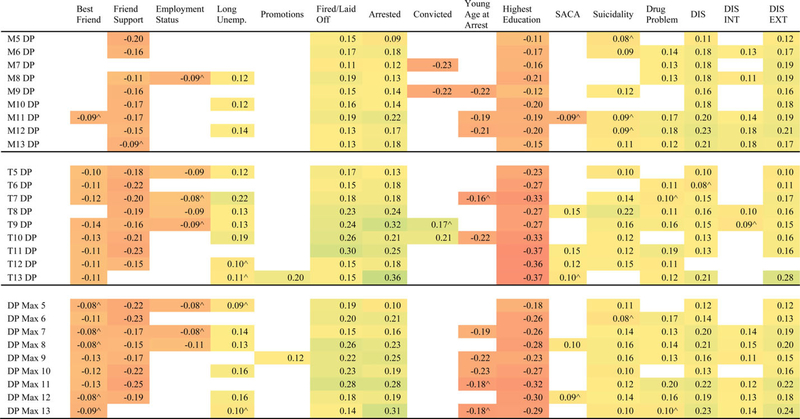
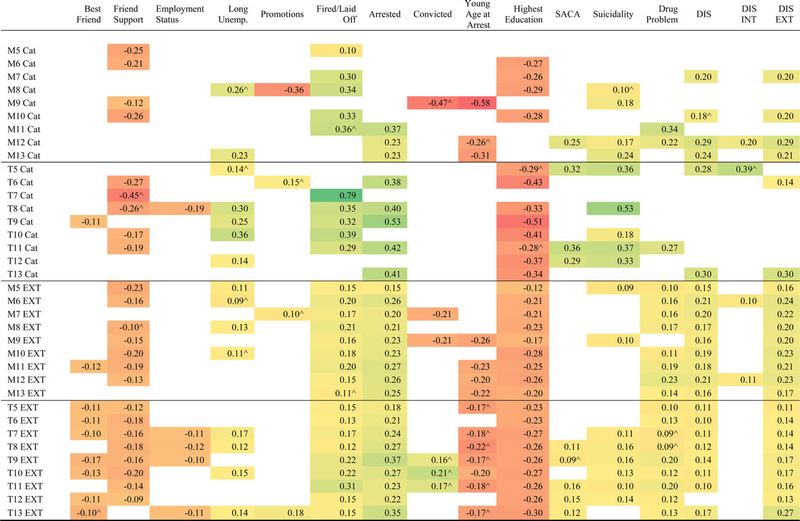
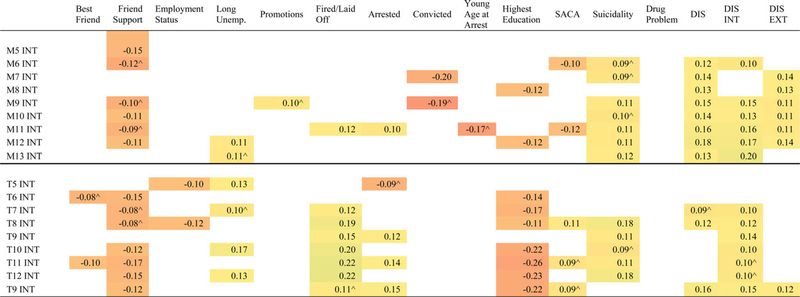
Research shows that childhood dysregulation is associated with later psychiatric disorders. It does not yet resolve discrepancies in the operationalization of dysregulation. It is also far from settled on the origins and implications of individual differences in dysregulation. This study tested several operational definitions of dysregulation using Achenbach attention, anxious/depressed, and aggression subscales. Individual growth curves of dysregulation were computed, and predictors of growth differences were considered. The study also compared the predictive utility of the dysregulation indexes to standard externalizing and internalizing indexes. Dysregulation was indexed annually for 24 years in a community sample (n = 585). Hierarchical linear models considered changes in dysregulation in relation to possible influences from parenting, family stress, child temperament, language, and peer relations. In a test of the meaning of dysregulation, it was related to functional and psychiatric outcomes in adulthood. Dysregulation predictions were further compared to those of the more standard internalizing and externalizing indexes. Growth curve analyses showed strong stability of dysregulation. Initial levels of dysregulation were predicted by temperamental resistance to control, and change in dysregulation was predicted by poor language ability and peer relations. Dysregulation and externalizing problems were associated with negative adult outcomes to a similar extent.


Figures

Figure 1.
Figure 1.
Linear regression lines of mother, teacher, and maximum dysregulation scores and child age. (a) The black lines represent individual trajectories; overlaid gray lines represent the average trajectory for the whole sample. Linear trajectories are displayed, as this form of growth was used in all subsequent models. (b) The solid black line represents the mean linear curve for maximum score, the dashed black line represents the mean linear curve for mother-reported dysregulation, and the solid gray line represents the mean linear curve for teacher-reported dysregulation.
Figure 2.
Figure 2.
(Color online) Heat map of correlations by age between dysregulation, externalizing, and internalizing scales and outcomes. All correlations are significant at p < .05, two-tailed. Correlations trending toward significance are represented by a small caret (^). Green (online only) represents stronger positive correlations, and red (online only) indicates stronger negative correlations. M DP, mother-reported dysregulation profile; T DP, teacher-reported dysregulation profile; DP Max, maximum score for the dysregulation profile; M and T Cat, mother- and teacher-reported categorical dysregulation indexes, respectively; M EXT, mother-reported externalizing; T EXT, teacher-reported externalizing; M INT, mother-reported internalizing; T INT, teacher-reported internalizing score; DIS, Diagnostic Interview Schedule, which was used to determine the number of psychiatric disorders for which participants met full or partial diagnostic criteria. See online-only supplementary Table S.7 for a summary table of average correlations across ages.
Figure 2.
Figure 2.
(Color online) Heat map of correlations by age between dysregulation, externalizing, and internalizing scales and outcomes. All correlations are significant at p < .05, two-tailed. Correlations trending toward significance are represented by a small caret (^). Green (online only) represents stronger positive correlations, and red (online only) indicates stronger negative correlations. M DP, mother-reported dysregulation profile; T DP, teacher-reported dysregulation profile; DP Max, maximum score for the dysregulation profile; M and T Cat, mother- and teacher-reported categorical dysregulation indexes, respectively; M EXT, mother-reported externalizing; T EXT, teacher-reported externalizing; M INT, mother-reported internalizing; T INT, teacher-reported internalizing score; DIS, Diagnostic Interview Schedule, which was used to determine the number of psychiatric disorders for which participants met full or partial diagnostic criteria. See online-only supplementary Table S.7 for a summary table of average correlations across ages.

References

    1. Achenbach TM (1991). Integrative guide for the 1991 CBCL (4–18), YSR, and TRF profiles. Burlington, VT: University of Vermont, Department of Psychiatry.
    1. Achenbach TM (1998). Young Adult Self-Report for the Child Behavior Checklist. Burlington, VT: University of Vermont, Department of Psychiatry.
    1. Achenbach TM, Howell CT, McConaughy SH, & Stanger C (1995). Six-year predictors of problems in a national sample: III. Transitions to young adult syndromes. Journal of the American Academy of Child & Adolescent Psychiatry, 34, 658–669. doi:10.1097/00004583-199505000-00018 - DOI - PubMed
    1. Achenbach TM, & Rescorla L (2001). ASEBA school-age forms & profiles. Burlington, VT: University of Vermont, Department of Psychiatry.
    1. Aiken LS, & West SG (1991). Multiple regression: Testing and interpreting interactions. Newbury Park, CA: Sage.

Publication types