. 2017 Nov 20;8(1):1615.
doi: 10.1038/s41467-017-01825-5.

Machine learning meets complex networks via coalescent embedding in the hyperbolic space

Affiliations

Machine learning meets complex networks via coalescent embedding in the hyperbolic space

Alessandro Muscoloni et al. Nat Commun. .

Abstract

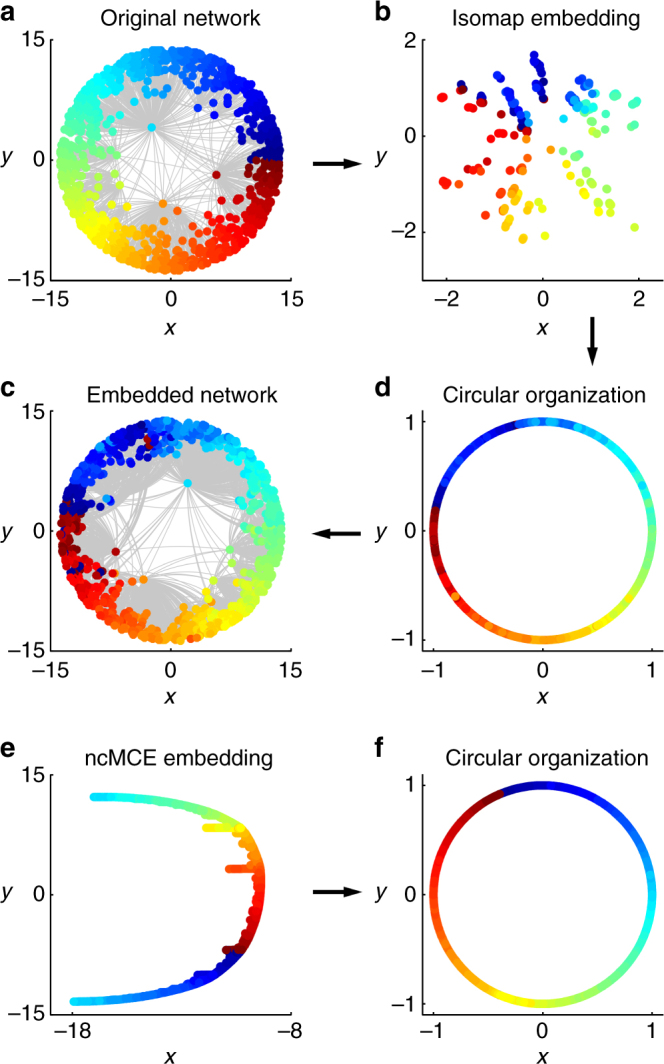
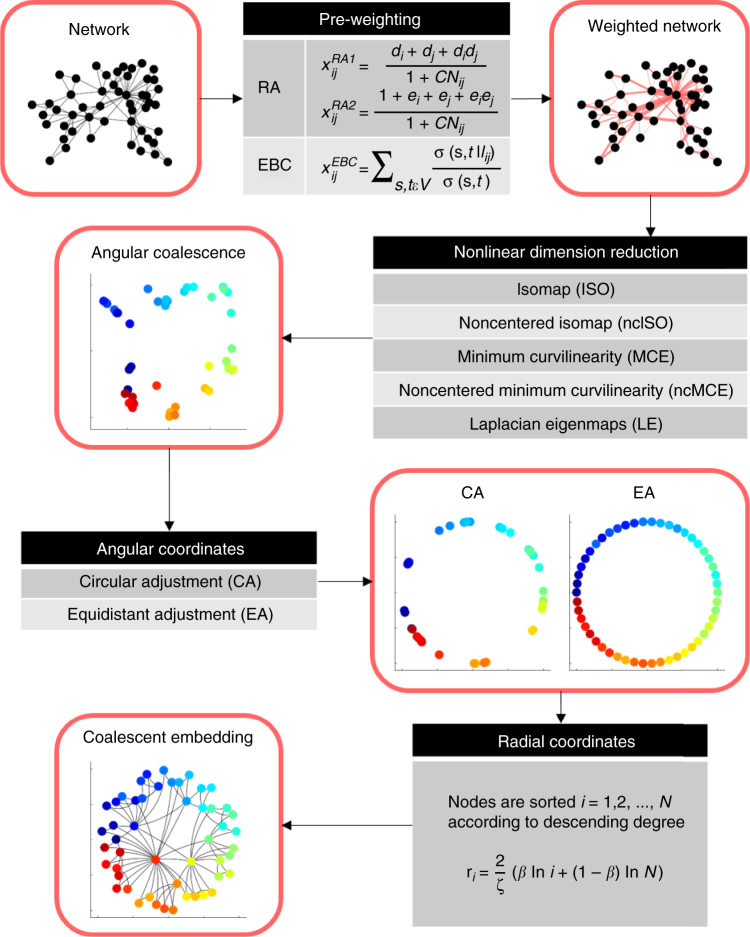
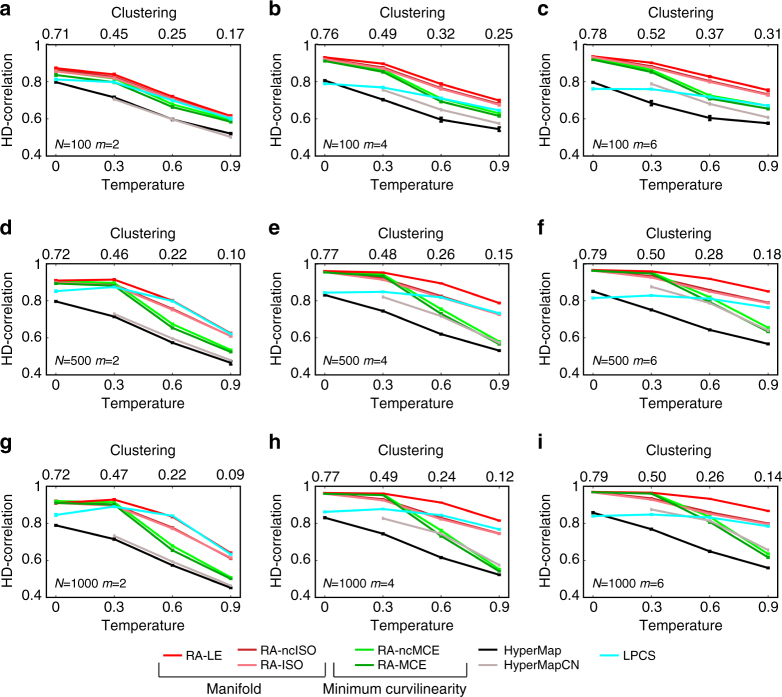
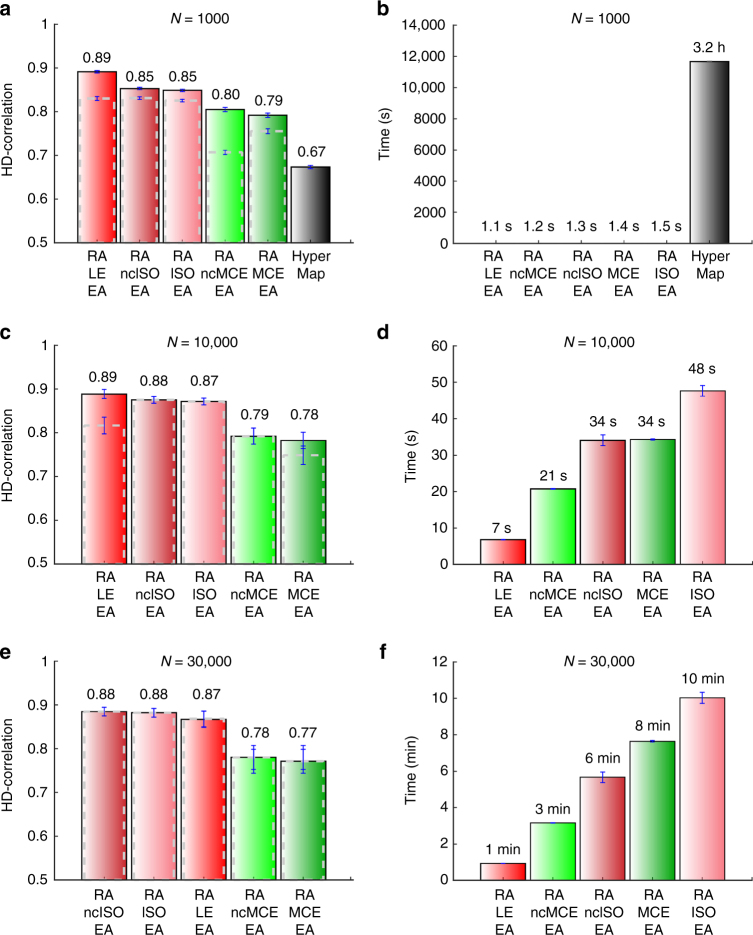
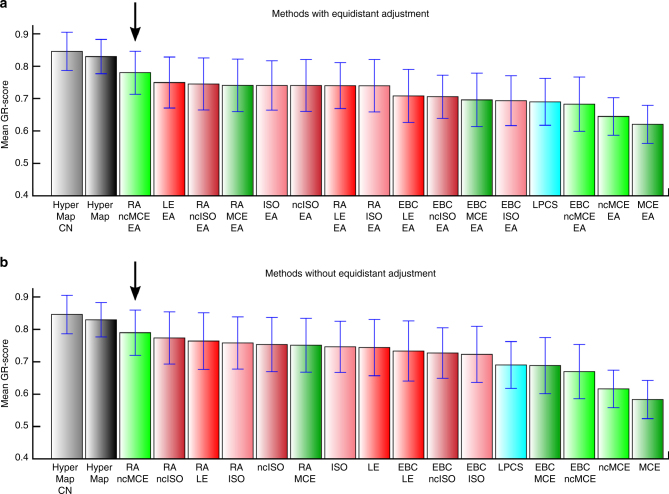
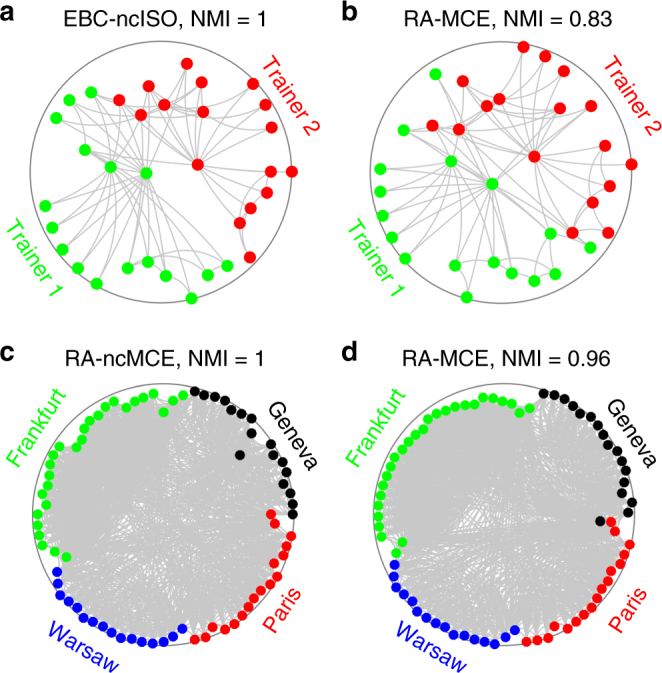
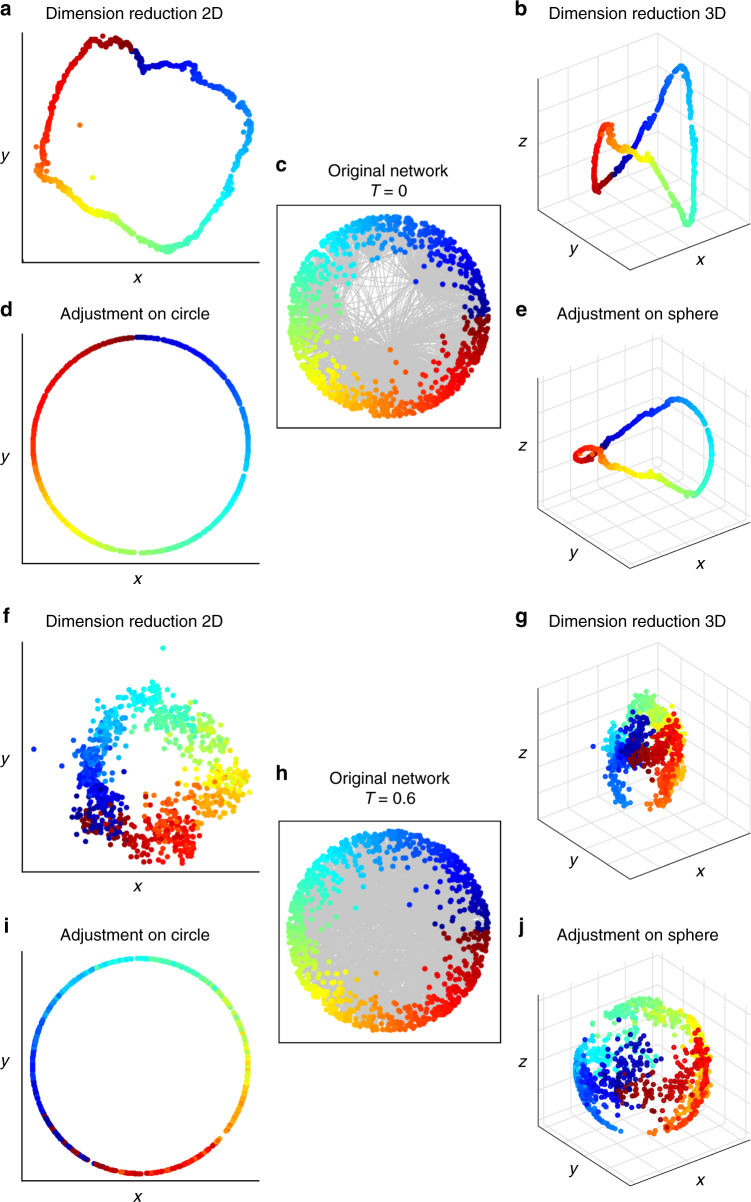
Physicists recently observed that realistic complex networks emerge as discrete samples from a continuous hyperbolic geometry enclosed in a circle: the radius represents the node centrality and the angular displacement between two nodes resembles their topological proximity. The hyperbolic circle aims to become a universal space of representation and analysis of many real networks. Yet, inferring the angular coordinates to map a real network back to its latent geometry remains a challenging inverse problem. Here, we show that intelligent machines for unsupervised recognition and visualization of similarities in big data can also infer the network angular coordinates of the hyperbolic model according to a geometrical organization that we term "angular coalescence." Based on this phenomenon, we propose a class of algorithms that offers fast and accurate "coalescent embedding" in the hyperbolic circle even for large networks. This computational solution to an inverse problem in physics of complex systems favors the application of network latent geometry techniques in disciplines dealing with big network data analysis including biology, medicine, and social science.


Conflict of interest statement

The authors declare no competing financial interests.

Figures

Fig. 1
Fig. 1
Coalescent embedding. a We show the original synthetic network generated by the PSO model in the hyperbolic space. b The Isomap algorithm (ISO), which is the progenitor of manifold techniques, starting from the unweighted adjacency matrix offers an embedding of the network nodes that is organized according to a circular pattern that follows the angular coordinates of the original PSO model. We made different trials using other synthetic networks, and this circular pattern is mainly preserved if the kernel is centered or if the kernel is not centered and the first dimension is neglected (see “Methods” section for details). This makes sense because the operation of kernel centering puts the origin of the reduced space at the center of the points in a multidimensional space and thus at the center of the manifold. Since the node points lie on the hyperbolic disk, the embedding places the origin approximatively at the center of the disk. d The nodes are projected over a circumference and adjusted equidistantly according to the step 3.2 of the algorithm described in “Methods” section. c The radial coordinates are given according to Eq. (4). e A different pattern is obtained for an algorithm named ncMCE. The circular pattern is linearized and the nodes are ordered along the second dimension of embedding according to their similarities (here the kernel is noncentered and the first dimension of embedding should be neglected, see “Methods” section). f If we accommodate the node points on the circumference following the same ordering as the second dimension of embedding, we can again recover an unbroken circular pattern that resembles the angular coordinates of the original PSO model
Fig. 2
Fig. 2
Flow chart of the coalescent embedding algorithm. The algorithmic steps (grayscale squares) and the intermediate input/output (rounded red squares) of the coalescent embedding algorithm are illustrated. Each algorithmic step reports all the possible variants. The example network has been generated by the PSO model with parameters N = 50, m = 2, T = 0.1, γ = 2.5. We applied the RA1 pre-weighting rule and the ISO dimension reduction technique. The colors of the embedded nodes are assigned according to their angular coordinates in the original PSO network. Description of the variables in the mathematical formulas: x ij value of (i, j) link in adjacency matrix x; d i degree of node i; e i external degree of node i (links neither to CN ij nor to j); CN ij common neighbors of nodes i and j; V set of nodes; s,t any combination of network nodes in V; σ(s, t) number of shortest paths (s,t); σs,tlij number of shortest paths (s, t) through link l ij; N number of nodes; ζ=-K, we set ζ = 1; K curvature of the hyperbolic space; β=1γ-1 popularity fading parameter; γ exponent of power-law degree distribution. Details on each step are provided in the respective “Methods” sections
Fig. 3
Fig. 3
HD-correlation on popularity-similarity-optimization synthetic networks. ai To validate the above-mentioned techniques, we generated 100 different synthetic networks for each combination of tuneable parameters of the PSO model (temperature T, size N, half of average degree m, power-law degree distribution exponent γ). Supplementary Fig. 24 offers an idea of the topological diversity of the synthetic networks generated fixing γ = 2.5 and tuning the other parameters, Supplementary Fig. 25 reports an analysis of the rich clubness of the networks, commented in Supplementary Discussion. In the results presented in the figures of this article, we used γ = 2.5, but we also ran the simulations for γ = 2.25 and 2.75, and the differences were negligible (results not shown). Here, the performance was evaluated as Pearson correlation between all the pairwise hyperbolic distances of the network nodes in the original PSO model and in the reconstructed hyperbolic space (HD-correlation). The plots report the average correlation and the standard error over the 100 synthetic networks that have been generated for each different parameter combination. The value one indicates a perfect correlation between the nodes’ hyperbolic distances in the original and reconstructed hyperbolic space. The plots show the results of different methods when both RA and EA are applied. The methods without EA are plotted in Supplementary Fig. 7. For each subplot, the value of HyperMap-CN for T = 0 is missing because the original code assumes T > 0
Fig. 4
Fig. 4
Angular coordinates comparison and C-score on popularity-similarity-optimization synthetic networks. ai For all the combinations of the PSO parameters N (size) and m (half of average degree), we chose among the synthetic networks embedded with RA-MCE-EA the ones with the best C-score, which had always temperature T = 0. For these networks, we plotted the aligned inferred angular coordinates against the original angular coordinates (θ). The alignment was done in the following manner: we applied 360 rotations of one degree both to the inferred coordinates as they are and to the inferred coordinates obtained arranging the nodes in the opposite clock direction. Then from these resulting 720 alternatives of the inferred angular coordinates, we chose the one that maximizes the correlation with the original angular coordinates, in order to guarantee the best alignment. The alignment does not change the C-score, which represents the percentage of node pairs in the same circular order in the original and inferred networks (see “Methods” section for details). Similar plots for the other coalescent embedding methods and temperature values can be found in Supplementary Figs. 8–17. jr The plots report the average C-score and the standard error over the 100 synthetic networks that have been generated for each different parameter combination. There are no separate plots for the methods with and without EA since this adjustment affects the distances but not the circular ordering, therefore it does not change the C-score. For each subplot, the value of HyperMap-CN for T = 0 is missing because the original code assumes T > 0
Fig. 5
Fig. 5
Comparison of HD-correlation and time on small and large-size popularity-similarity-optimization synthetic networks. a, c, e Average performance and standard error, measured as HD-correlation, for all PSO networks of sizes N = 1000, N = 10,000, and N = 30,000, respectively. Averages are taken over the parameters m (half of the mean node degree) and temperature T. b, d, f Average computation times for the PSO networks of sizes N = 1000, N = 10,000, and N = 30,000, respectively. Again, averages are taken over the parameters m (half of the mean node degree) and temperature T. Considering the average performance in all the simulations on 1000 nodes networks a, coalescent embedding approaches achieved a performance improvement of more than 30% in comparison to HyperMap, requiring only around one second versus more than three hours of computation time. Similar performance results are confirmed for the networks of sizes N = 10,000 and N = 30,000 with an execution time still in the order of minutes for the biggest networks. The comparison to HyperMap was not possible due to its long running time. The dashed gray bins represent the HD-correlation of the respective non-EA variants, suggesting that their performance tends to the EA variants for larger PSO networks
Fig. 6
Fig. 6
Greedy routing (GR) on real networks. The eight real networks whose statistics are reported in Table 1 have been mapped using the hyperbolic embedding techniques and the greedy routing in the geometrical space has been evaluated. The barplot report for each method the mean GR-score and standard error over the networks. The GR-score is a metric to evaluate the efficiency of the greedy routing, which assumes values between 0, when all the routings are unsuccessful, and 1, when all the packets reach the destination through the shortest path (see “Methods” section for details). Both the EA (a) and non-EA (b) variants are reported, in order to check whether the equidistant adjustment might affect the navigability. A black arrow points the coalescent embedding algorithm RA-ncMCE that offers the best performance regardless the use of node angular adjustment. The mean GR-score of RA-ncMCE is not statistically different from the one of the HyperMap-based algorithms (permutation test p value >0.2 in all the pairwise comparisons)
Fig. 7
Fig. 7
Communities in Karate and Opsahl_11 networks. a, b Karate network embedded with EBC-ncISO-EA and RA-MCE-EA. The network represents the friendship between the members of a university karate club in the United States. The two real communities are highlighted, they are formed by a split of the club into two parts, each following one trainer. The NMI obtained by the Louvain community detection algorithm is reported, where the embedding coordinates were used to weight the input matrix: observed links are weighted using the hyperbolic distances between the nodes and non-observed links using the hyperbolic shortest paths (see “Methods” section for details). NMI is the normalized mutual information and represents the shared information between two distributions, normalized between 0 and 1, where 1 indicates that the communities detected by the algorithm perfectly correspond to the ground truth communities (see “Methods” section for details). c, d Opsahl_11 network embedded with RA-ncMCE-EA and RA-MCE-EA. This is a type of intra-organizational network, where a link indicates that the connected employees have both awareness of each other’s knowledge and skills on the job. The four real communities are highlighted, they are related with the location of the employers. All the approaches here adopted are adjusted according to EA strategy, although this is not explicitly reported in the subtitles for brevity. Note that the angular coordinates of the embedding in b, d have been aligned for a better visualization, respectively, to the ones in a, c, as described for the scatter plots in Fig. 4
Fig. 8
Fig. 8
Comparison of 2D and 3D RA-ISO embedding for increasing temperature. The figure shows how the similarities of the original PSO network (N = 1000, m = 6, γ = 2.5) (c, h) are recovered either embedding in 2D (a, f) and arranging the angular coordinates over the circumference of a circle (d, i) or embedding in 3D (b, g) and adjusting the angular coordinates over a sphere (e, j). ae At low temperature (T = 0), the nodes appear distributed over a well-defined closed 3D curve. Intuitively, it seems that the 2D hyperbolic disk already offers a perfect discrimination of the similarities and with the addition of the third dimension there is not much gain of information. fj With the increase of the temperature (T = 0.6 reported, T = 0.3 and T = 0.9 shown in Supplementary Fig. 21), the nodes look more and more spread around the closed 3D curve that was well defined at low temperature. Even if one angular dimension of the sphere still recovers most of the similarities present in the original network, it is unknown if the higher spread along the second angular dimension consists in a more refined discrimination between similar nodes or in noise, therefore we have evaluated the improvement given by the 3D mapping for the greedy routing and the community detection applications

References

    1. Papadopoulos F, Kitsak M, Serrano MA, Boguñá M, Krioukov D. Popularity versus similarity in growing networks. Nature. 2012;489:537–540. doi: 10.1038/nature11459. - DOI - PubMed
    1. Boguñá M, Krioukov D, Claffy KC. Navigability of complex networks. Nat. Phys. 2008;5:74–80. doi: 10.1038/nphys1130. - DOI
    1. Higham DJ, Rašajski M, Pržulj N. Fitting a geometric graph to a protein-protein interaction network. Bioinformatics. 2008;24:1093–1099. doi: 10.1093/bioinformatics/btn079. - DOI - PubMed
    1. Kuchaiev O, Rašajski M, Higham DJ, Pržulj N. Geometric de-noising of protein-protein interaction networks. PLoS Comput. Biol. 2009;5:e1000454. doi: 10.1371/journal.pcbi.1000454. - DOI - PMC - PubMed
    1. Wu Z, Menichetti G, Rahmede C, Bianconi G. Emergent complex network geometry. Sci. Rep. 2015;5:10073. doi: 10.1038/srep10073. - DOI - PMC - PubMed

Publication types