. 2017 Oct:606:A76.
doi: 10.1051/0004-6361/201730912. Epub 2017 Oct 16.

The ESO Diffuse Interstellar Bands Large Exploration Survey: EDIBLES I. Project description, survey sample and quality assessment

Affiliations

The ESO Diffuse Interstellar Bands Large Exploration Survey: EDIBLES I. Project description, survey sample and quality assessment

Nick L J Cox et al. Astron Astrophys. 2017 Oct.

Abstract

The carriers of the diffuse interstellar bands (DIBs) are largely unidentified molecules ubiquitously present in the interstellar medium (ISM). After decades of study, two strong and possibly three weak near-infrared DIBs have recently been attributed to the [Formula: see text] fullerene based on observational and laboratory measurements. There is great promise for the identification of the over 400 other known DIBs, as this result could provide chemical hints towards other possible carriers. In an effort to systematically study the properties of the DIB carriers, we have initiated a new large-scale observational survey: the ESO Diffuse Interstellar Bands Large Exploration Survey (EDIBLES). The main objective is to build on and extend existing DIB surveys to make a major step forward in characterising the physical and chemical conditions for a statistically significant sample of interstellar lines-of-sight, with the goal to reverse-engineer key molecular properties of the DIB carriers. EDIBLES is a filler Large Programme using the Ultraviolet and Visual Echelle Spectrograph at the Very Large Telescope at Paranal, Chile. It is designed to provide an observationally unbiased view of the presence and behaviour of the DIBs towards early-spectral type stars whose lines-of-sight probe the diffuse-to-translucent ISM. Such a complete dataset will provide a deep census of the atomic and molecular content, physical conditions, chemical abundances and elemental depletion levels for each sightline. Achieving these goals requires a homogeneous set of high-quality data in terms of resolution (R ~ 70 000 - 100 000), sensitivity (S/N up to 1000 per resolution element), and spectral coverage (305-1042 nm), as well as a large sample size (100+ sightlines). In this first paper the goals, objectives and methodology of the EDIBLES programme are described and an initial assessment of the data is provided.

Keywords: ISM: clouds; ISM: dust; ISM: lines and bands; ISM: molecules; Stars: early-type; local interstellar matter.


Figures

Fig. 1
Fig. 1
Galactic distribution of EDIBLES targets. The symbol size reflects the value of RV , while the interior colour represents the line-of-sight reddening, E(BV). Symbols with green edges represent the observed targets, while blue edges correspond to the targets to be observed by the end of the programme.
Fig. 2
Fig. 2
Number of selected targets as function of reddening E(BV), extinction AV , the ratio of total-to-selective extinction RV (= AV/E(BV)), and the fraction of molecular hydrogen fH2 for the target sample. The number of observed targets with reported values for each quantity are given at the top of each panel. The dark blue and light blue distributions correspond to the samples of observed and observed + foreseen targets. The vertical red lines indicate the value of the 5, 10, 25, 50, 75, 90, and 95 percentiles of each sample. The labels are located such that they trace the cumulative target distribution.
Fig. 3
Fig. 3
Relation between visual extinction, AV , and neutral hydrogen column density N(H i), molecular hydrogen column density N(H2), and total hydrogen column density N(Htot), computed as N(H i)+2N(H2). Note that some EDIBLES lines-of-sight are not included since no direct H i or H2 measurements are available.
Fig. 4
Fig. 4
Comparison of the S/N of HD 23180 with changing number of flat frames. The S/N ratios plotted for each instrument setting are average values of S/N measured in five different continuum regions in the respective setting.
Fig. 5
Fig. 5
(a) Part of the extracted spectrum of HD 23180 taken using the Red Lower EEV CCD (Red-L). (b) Ditto but for Red Upper MIT CCD (Red-U). The latter is a thick chip so fringing is much reduced compared with the EEV detector. The vertical scale is the same in both cases.
Fig. 6
Fig. 6
Close-up view of a region including two overlapping orders in the 564-nm setting for HD 23180 for both reduction ‘A’ (bottom red trace) and reduction ‘B’ (top black trace). The small jump in the continuum at approximately 5855 Å seen in reduction B (top black trace) is due to imperfect merging of two echelle orders. The apparent difference in S/N is due to alternative choices of wavelength sampling.
Fig. 7
Fig. 7
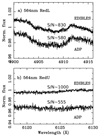
Comparison between the ADP and EDIBLES processing of HD184915 spectra (0.02 Å binsize). The S/N measurements, taken at 4912–4913 Å and 6129–6130 Å for the Red-L and Red-U spectra, are given in the top and bottom panel. Resampling to 0.04 Å binsize (i.e. corresponding to the spectral resolution) further increases the S/N by factor 2.
Fig. 8
Fig. 8
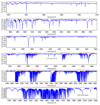
EDIBLES UVES spectra of HD 170740 (B2 V) for each setting from top to bottom: 346B, 437B, 564L, 564U, 860L, 860U. This overview figure is a demonstration of the data quality. The main gaps in wavelength coverage are between 5610–5670 Å and 8530–8680 Å which correspond to the physical separation of the Red-L and Red-U detectors in both the 564 and 860-nm settings. Note also the inter-order gaps, several are indicated with arrows, in the 860-nm Red-U spectrum above ~9600 Å as well as several conspicuous regions containing bands of closely-spaced telluric absorption lines (indicated with red horizontal bars) mostly in the Red-L and Red-U 860-nm spectra (bottom two panels). Two order-merging jumps are indicated in the fourth panel. A more detailed version of this figure is shown in the appendix (Fig. B.1) where specific interstellar species are labeled and a synthetic DIB spectrum is shown for comparison.
Fig. 9
Fig. 9
(Left) Example of telluric line correction in the weak line regime by means of the rope-length method applied to the spectrum of HD 170740. Telluric lines of O2 are corrected first, then H2O lines. (Right) Example of telluric line correction in the strong line regime by means of a two-step method and a composite instrumental profile adjustment (see text). Residuals remain at the location of the deepest lines, especially when the model does not predict their shape and exact Doppler shift very accurately. The positions of the 9577 and 9632 Å DIBs attributed to C60+ are indicated.
Fig. 10
Fig. 10
An illustration of the quality of the spectra for the 5780 and 5797 Å (left) and 6614 Å (right) DIBs. For each target all observed spectra were co-added in the heliocentric reference frame. The five targets shown have comparable E(B-V) values (Tables A.1 and A.2), and thus have similar 5797 Å DIB strengths. The well established, strongly variable 5780/5797 ratio can be seen in the spectra, with the intensity of 5780 absorption inversely related to the molecular gas fraction, fH2 (Tables A.1 and A.2). The five spectra are shown superimposed on each other at the top of the panels. Note that because of generally poor observing conditions there are numerous weak and narrow atmospheric water features present (particularly noticeable around 5788–5792 Å) that could influence the 5797 Å profile. In the future these features will be removed using the method described in Sect. 6.
Fig. 11
Fig. 11
Comparison of the 6614 Å DIB for HD 184915, HD 144470, and HD 145502 obtained with EDIBLES (black solid line; this work, R ~ 110 000) and the CES (blue solid line; Galazutdinov et al. 2002; R ~ 220 000). The sub-structure components 1, 2, and 3 are labelled in the bottom trace (see text).
Fig. 12
Fig. 12
Comparison of the 6614 Å DIB for HD 147888 (ρ Oph D) obtained with EDIBLES (this work, R ~ 110 000) and the AAT (Cordiner et al. 2013, R ~ 58 000). The top spectrum labeled “ADP” is the spectrum obtained with the standard ESO archive pipeline processing (i.e. using the default number of 5 flat-field frames). The red dotted line represents the telluric absorption spectrum, shifted to match the heliocentric rest frame of each target; highlighting the presence of a small telluric absorption feature at 6614/6614.5 Å.
Fig. 13
Fig. 13
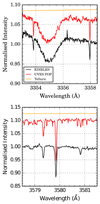
Comparison of EDIBLES (black) and UVES POP (red) spectra of HD 169454 for interstellar lines of NH(λλ3353.92, 3358.05 Å) (top) and CN(1-0) (λλ3579.45, 3579.96, and 3580.9 Å; Meyer et al. 1989) (bottom); the telluric spectrum is shown in orange. HD 169454 is a blue supergiant (B1 Ia) – the broad stellar line in the spectrum is He I λ3355 Å.
Fig. 14
Fig. 14
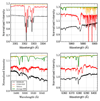
Comparison of EDIBLES (black) and UVES POP (red) spectra of HD 148937 (O6 f?p) for the interstellar Na lines (UV, top left; D, top right) and DIBs at λλ5480–5545 Å (lower left) and λλ6360–6379 Å (lower right). The telluric spectrum is shown in orange, and the average ISM DIB spectrum in green. The apparent feature at 6384 Å in the UVES POP data (bottom right panel) is related to the order merging, but the significant change in the He I 5876 line (top right panel) appears astrophysical in nature.

References

    1. Abt HA, Morgan WW. AJ. 1969;74:813.
    1. Bagnulo S, Jehin E, Ledoux C, et al. The Messenger. 2003;114:10.
    1. Bailey M, van Loon JT, Farhang A, et al. A&A. 2016;585:A12.
    1. Bailey M, van Loon JT, Sarre PJ, Beckman JE. MNRAS. 2015;454:4013.
    1. Ballester P, Modigliani A, Boitquin O, et al. The Messenger. 2000;101:31.

LinkOut - more resources