. 2017;9(28):4112-4134.
doi: 10.1039/C7AY00690J. Epub 2017 Jun 13.

Surface acoustic wave devices for chemical sensing and microfluidics: A review and perspective

Affiliations

Surface acoustic wave devices for chemical sensing and microfluidics: A review and perspective

David B Go et al. Anal Methods. 2017.

Abstract

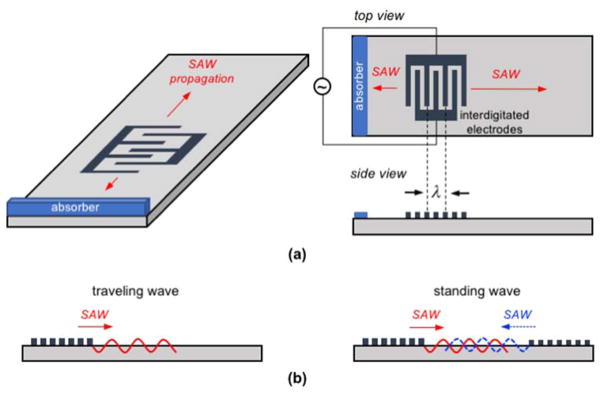
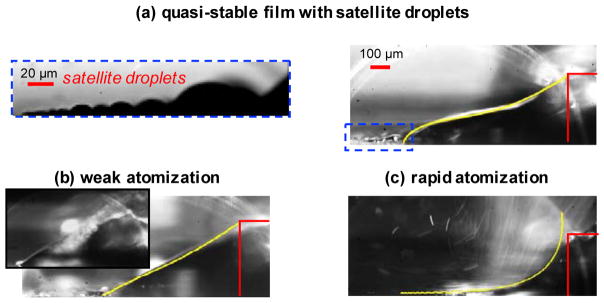
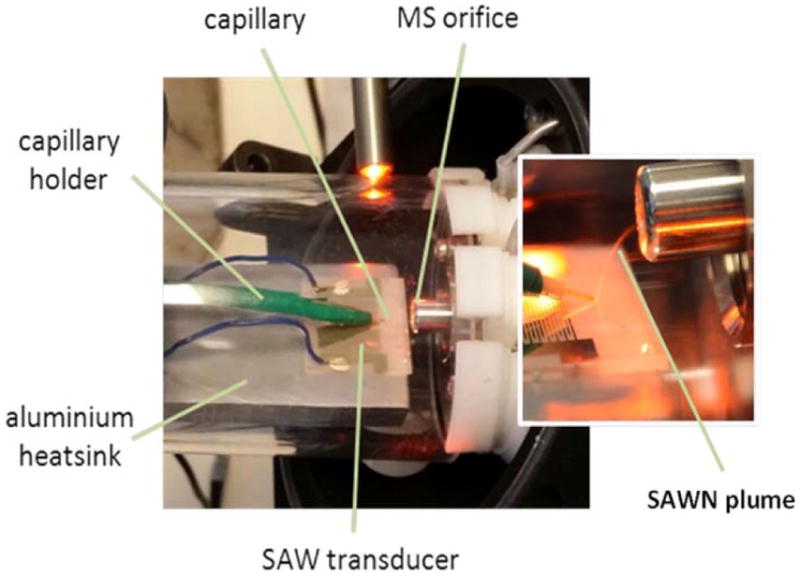
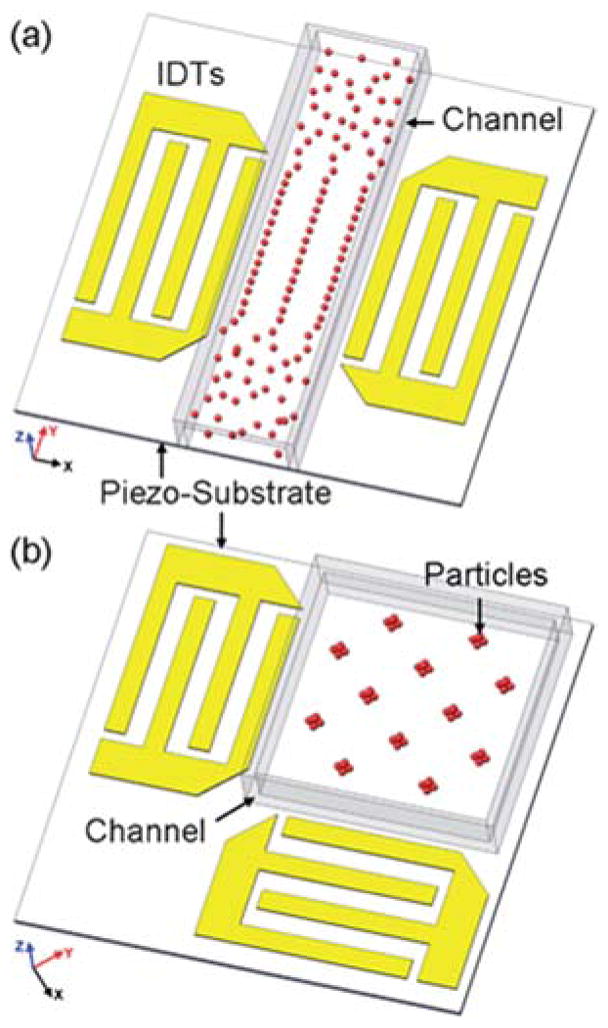
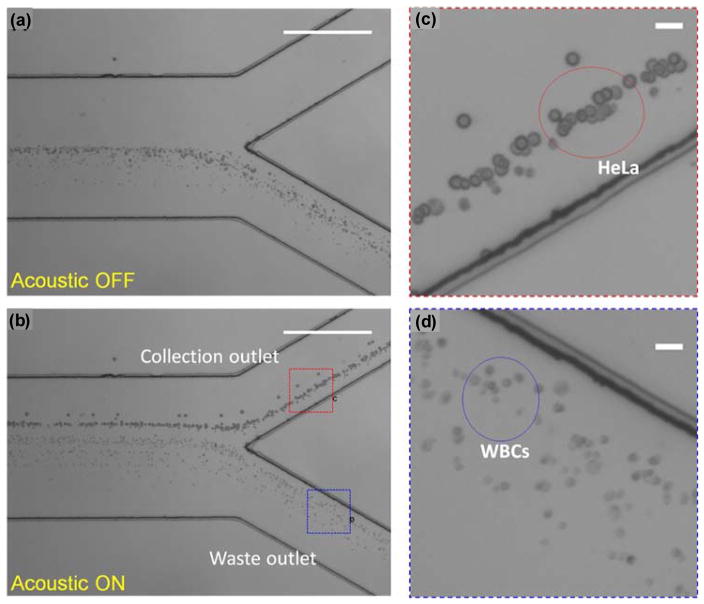
Surface acoustic waves (SAWs), are electro-mechanical waves that form on the surface of piezoelectric crystals. Because they are easy to construct and operate, SAW devices have proven to be versatile and powerful platforms for either direct chemical sensing or for upstream microfluidic processing and sample preparation. This review summarizes recent advances in the development of SAW devices for chemical sensing and analysis. The use of SAW techniques for chemical detection in both gaseous and liquid media is discussed, as well as recent fabrication advances that are pointing the way for the next generation of SAW sensors. Similarly, applications and progress in using SAW devices as microfluidic platforms are covered, ranging from atomization and mixing to new approaches to lysing and cell adhesion studies. Finally, potential new directions and perspectives on the field as it moves forward are offered, with a specific focus on potential strategies for making SAW technologies for bioanalytical applications.


Figures

Fig. 1
Fig. 1
(a) Schematic of a single, planar IDT configuration, where the SAW propagates away from the IDT in both directions. Typically, an absorbent material such as a gel is used to inhibit reflection of the backward traveling SAW. The top and side views show a typical IDT structure with the interdigitated electrode fingers spaced λ/2. (b) Side views to two common actuation strategies. On the left is a traveling wave configuration, where a single IDT induces a SAW propagating away from the electrodes. Generally, the SAW propagates at the speed of sound of the crystal, which is typically ~103 m/s, but has an out-of-plane displacement amplitude of only ~10 nm. However, the displacement speed and acceleration can be very high, ~1 m/s and 105 m/s2. On the right shows two sets of IDTs that generate counter-propagating SAWs. The SAWs interfere to form a standing wave.
Fig. 2
Fig. 2
Two common configurations using a pair of IDTs for sensing applications. On the top is the delay line configuration, where a SAW is produced at the input IDT and as it travels through the sensing layer, interactions with adsorbed targets induce a frequency shift that can be detected at the readout IDT. On the bottom is a similar configuration but with additional IDT electrodes beneath the sensing layer. This resonator IDT acts as a reflector to set up a resonant cavity and increase sensitivity.
Fig. 3
Fig. 3
(a) The sensor array and testbed including oscillator circuits; a) and b) are the front view and c) and) are the back view. (b) Dynamic response to different concentrations of (top) octane and (bottom) toluene, at room temperature. (c) Sensor responses at 200 ppm to octane and toluene at room temperature. Adapted from Ref. [52] with permission from Elsevier.
Fig. 4
Fig. 4
Variation in differential frequency shifts (ΔF) of SAW E-nose as a function of the concentration of different simulants of CWA on four different oxide sensing layers – ZnO, tellurium dioxide (TeO2), tin dioxide (SnO2), and titanium dioxide (TiO2)). Upper left - dimethyl methyl phosphonate (DMMP), upper right - dibutyl sulfide (DBS), lower right - diethyl chlorophosphate (DECP), lower left - chloroethyl phenyl sulfide (CEPS). Adapted from Ref. [72] with permission from Elsevier.
Fig. 5
Fig. 5
(a) Schematic of the SH-SAW device (top) and the as-fabricated SH-SAW sensor on a U.S. penny for reference (bottom). (b) Flow cell with the SH-SAW sensor in the sensor groove. (Inset: PDMS microfluidic flow channel). A chemical sensing layer, naphtho[2,3-a]dipyrido[3,2-h:2′,3′-f]phenazine-5,18-dione (QDPPZ), was synthesized and employed for the selective detection of lead nitrate (PbNO3) and cadmium nitrate (CdNO ) down to pM-level concentrations. Adapted from Ref. [84] with permission from Elsevier.
Fig. 6
Fig. 6
(a) Schematic of the flexible thin film ZnO/polyimide SAW devices and photographs of the IDT design and fabricated devices. (b) Schematics and photographs of induced acoustic streaming in a surface droplet along with measurements of the streamlining velocity as a function of the applied voltage and images showing the concentration of particles in the droplet. Adapted by permission from Macmillan Publishers Ltd: Ref. [103], 2013.
Fig. 7
Fig. 7
(a) Schematic of the developed flexible SAW delay line device on AlN/PI composite structure, (b) microscope image of interdigital transducer fingers, (c) photographs of flexible SAW delay line devices on PI substrate, and (d) frequency response of the flexible SAW delay line device. Used from Ref. [104] with permission of Springer.
Fig. 8
Fig. 8
(a) Induced streaming due to the acoustic pressure of the refracted SAW wave into a surface droplet. In this traveling wave configuration, the droplet can translate or at sufficient SAW amplitude, break-up and be ejected from the surface. (b) A ‘pinned’ droplet configuration, where solution is fed from a paper wick connected to an external solution reservoir. A thin film of fluid is extracted from the wick onto the surface of the SAW device. Similar to the surface droplet configuration, at sufficient SAW amplitude the extracted film is atomized. (c) The modes of liquid break-up depending on the relative size of the droplet on the surface of the substrate (Rd) and the acoustic wavelength in the fluid (λf). The streaming Reynolds number (Res) is a non-dimensional number characterizing the inertia of the streaming fluid to viscous effects. Table adapted with permission from Ref. [109]. Copyrighted by the American Physical Society.
Fig. 9
Fig. 9
Film regimes under increasing SAW power from top to bottom for deionized (DI) water pumped through a paper wick on the surface of the SAW substrate. (a) Quasistable film regime (no atomization). The inset shows a zoomed view of the satellite surface droplets that form from the contact line of the extract thin film. (b) Weak atomization regime. Initial film rupture occurs and droplet emission takes place near the paper wick. The inset shows a discrete atomization event. (c) Rapid atomization regime, in which the film has thinned and aerosol emission occurs near the contact line. Numerical solutions corresponding to theory are overlaid in yellow and match the topology closely. The wicking paper is outlined in red on the right. The film regime figures are adapted with permission from Ref. . Copyrighted by the American Physical Society. The inset figure is adapted with permission from Ref. . Copyrighted by the American Physical Society.
Fig. 10
Fig. 10
Photograph showing coupling of SAWN ionization device to LC capillary at the inlet of a mass spectrometer. Reproduced from Ref. [149] with permission from Wiley.
Fig. 11
Fig. 11
Schematic of the SSAW-based patterning devices. (a) 1D patterning using two parallel IDTs. (b) 2D patterning using two orthogonal IDTs (the angle between the IDTs can be changed to achieve different patterns). Reproduced from Ref. [151] with permission from The Royal Society of Chemistry.
Fig. 12
Fig. 12
Micrographs of the separation process with acoustic field ON and OFF. (a) The mixture of HeLa cells and WBCs through a microfluidic channel with the acoustic field OFF. All of the cells were directed to the lower waste outlet by the hydrodynamic flow. No separation is observed. (b) When the acoustic field is ON, larger HeLa cells were pushed to the collection outlet, whereas the smaller WBCs still remained in the waste outlet. The separation between HeLa cells and WBCs can be observed. The stacked images are from 50 consecutive frames. (Scale bars, 515 μm.) (c and d) Zoomed-in images of the collection outlet and the waste outlet, respectively. (Scale bars, 30 μm.). Adapted from Ref. [158], courtesy National Academy of Sciences.
Fig. 13
Fig. 13
(a) Schemes for symmetry breaking of SAW propagation in order to generate azimuthal liquid recirculation. The left pictures shows one of the IDTs partly covered with α-gel damping material and the right picture shows the use of only one IDT with the wafer cut in a diagonal fashion. (b) Images at 60 frames/s showing the visualization of azimuthal bulk recirculation generated by asymmetric SAW propagation through dye streamlines induced by the flow. Adapted from Ref. [167] with permission of Springer.
Fig. 14
Fig. 14
Image of the proposed portable FIA system which includes a micropump, the SAW chip powered by a miniature driver circuit that includes a signal generator and amplifier, the PDMS reaction chamber bonded to the chip and a portable photodetector, showing the possibility for complete integration and portability for field use. The total weight of the entire system is approximately 130 g. Reprinted with permission from Ref. [177]. Copyright 2014 American Chemical Society.
Fig. 15
Fig. 15
Time series images showing the transport and mixing of two colored solutions, yellow and blue, through the serial dilution and combinatorial thread network, drawn from the reservoirs at the bottom of the images (one inlet thread port was immersed in each reservoir) towards the outlet at location α when the SAW device placed at this location is activated. Due to the serial dilution and mixing, a stable symmetric concentration gradient across the network can be seen. Adapted from Ref. [182] with permission from The Royal Society of Chemistry.
Fig. 16
Fig. 16
Surface acoustic wave (SAW) platform used to lyse cells. (a) Device architecture showing the interdigitated transducer (IDT) used to generate the SAW on the LiNbO3 piezoelectric wafer. The SAW is coupled into a phononic superstrate. A 20 μL droplet containing the cell suspension is deposited in the position shown. (b) The phononic lattice absorbs SAWs in a frequency-dependent manner. At ~ 10 MHz, propagation is hindered in region of the lattice, whereas it is unhindered in the adjacent region. This acts to create a rotational movement within the droplet and results in shear flows that contribute to the disruption of the cell membrane. (c) The sequence of images shows a droplet of cells undergoing SAW-induced mechanical lysis. The droplet containing cells has a cloudy appearance, which is observed to become largely clear upon successful lysis of cells. Note that the colored rings observed in part of the image sequence are an optical effect of the stereomicroscope used to observe lysis. Scale bar 1 mm. Reprinted with permission from Ref. [188]. Copyright 2015 American Chemical Society.
Fig. 17
Fig. 17
(a) Photograph (top) and schematic cross-section (bottom) of the setup for cell adhesion measurements. The system consists of a transparent piezoelectric LiNbO3 substrate with interdigital transducers (IDTs, green-brown color in the figure). On top of the substrate and the IDTs, a polydimethylsiloxane (PDMS)-chamber (blue) is placed which is covered by the implant specimen, in this case a titanium sample (grey). In the top photograph, the PDMS-chamber (upside-down) is removed from the LiNbO3 substrate, whereas the cross-section in the bottom part of the figure shows the system in its closed and assembled configuration. The electrical radio-frequency (rf) connector is labeled in orange. It is connected to the IDTs via silver conductive paste and two separated Cu-parts on the chip-carrier. (b) Percentage of detached SAOS-2 cells on different samples as marked by different symbols after 60 minutes of initial adhesion time versus time of flow exposure. Titanium exhibits the smallest de-adhesion rate as compared to the different DLC surfaces. Within this set of substrates, the de-adhesion tendency increases with higher silver-doping. Reproduced from Ref. [191] with permission from The Royal Society of Chemistry.

References

    1. White R, Voltmer F. Applied physics letters. 1965;7:314–316.
    1. Morgan D. Surface acoustic wave filters: With applications to electronic communications and signal processing. Academic Press; 2010.
    1. Morgan DP. International journal of high speed electronics and systems. 2000;10:553–602.
    1. Rocha-Gaso M-I, March-Iborra C, Montoya-Baides Á, Arnau-Vives A. Sensors. 2009;9:5740–5769. - PMC - PubMed
    1. Länge K, Rapp BE, Rapp M. Analytical and bioanalytical chemistry. 2008;391:1509–1519. - PubMed