

Vanillic acid attenuates testosterone-induced benign prostatic hyperplasia in rats and inhibits proliferation of prostatic epithelial cells
- PMID: 29152074
- PMCID: PMC5675626
- DOI: 10.18632/oncotarget.19909
Vanillic acid attenuates testosterone-induced benign prostatic hyperplasia in rats and inhibits proliferation of prostatic epithelial cells
Erratum in
-
Correction: Vanillic acid attenuates testosterone-induced benign prostatic hyperplasia in rats and inhibits proliferation of prostatic epithelial cells.Oncotarget. 2019 Jul 16;10(44):4611. doi: 10.18632/oncotarget.27105. eCollection 2019 Jul 16. Oncotarget. 2019. PMID: 31360309 Free PMC article.
Abstract
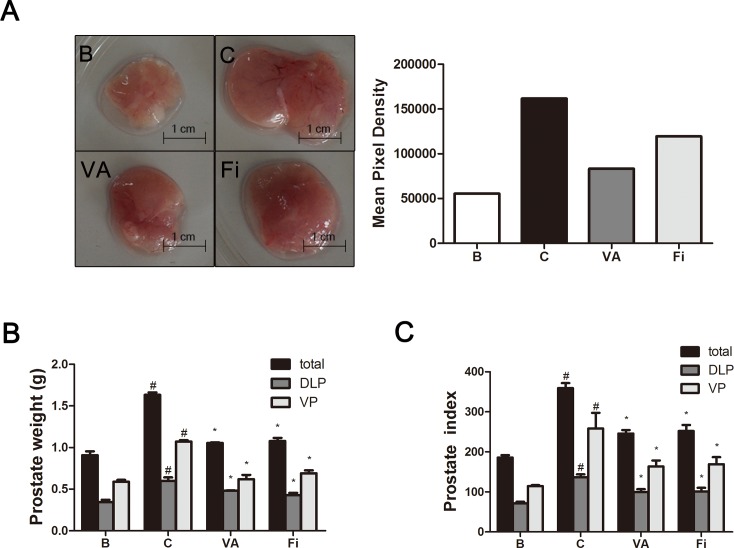
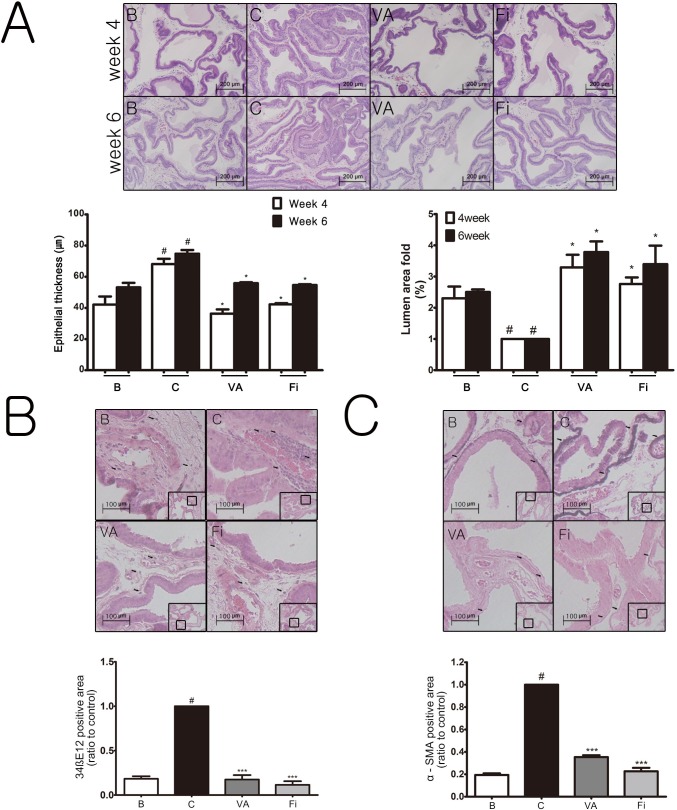
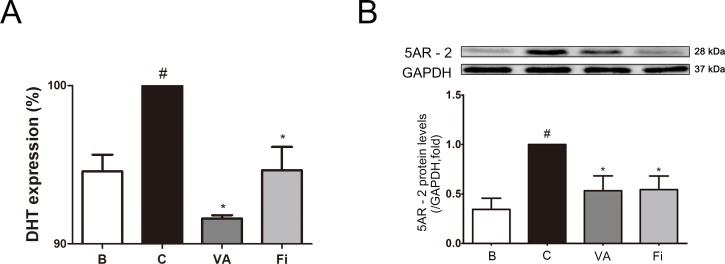
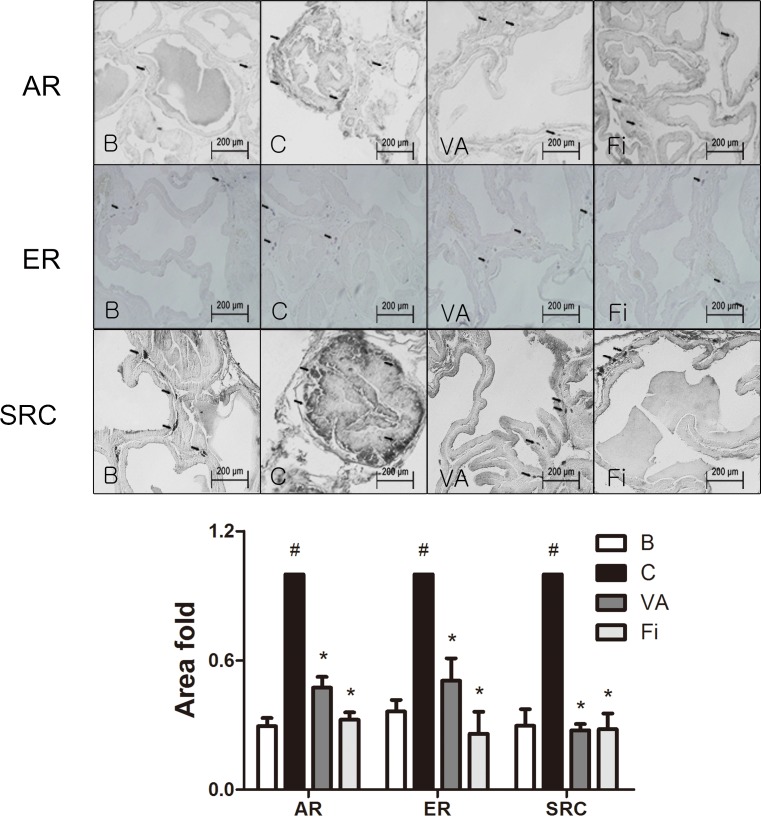
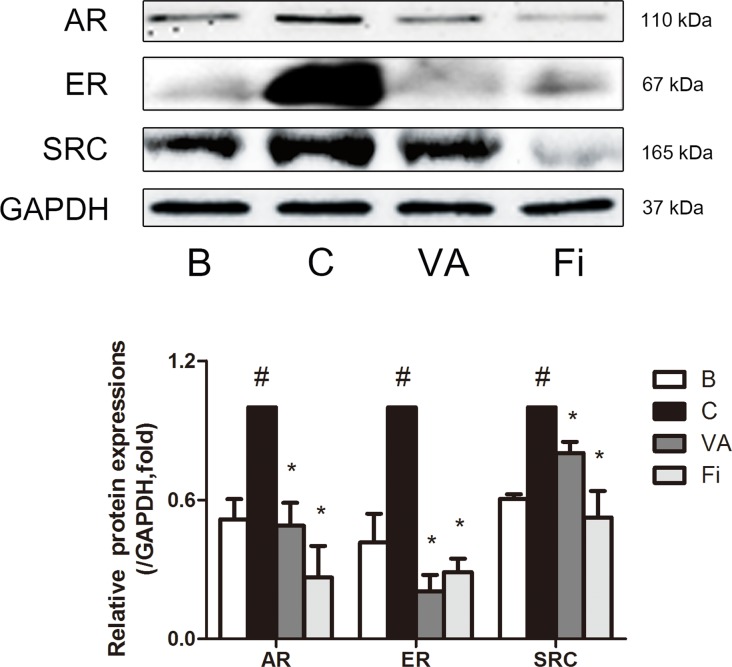
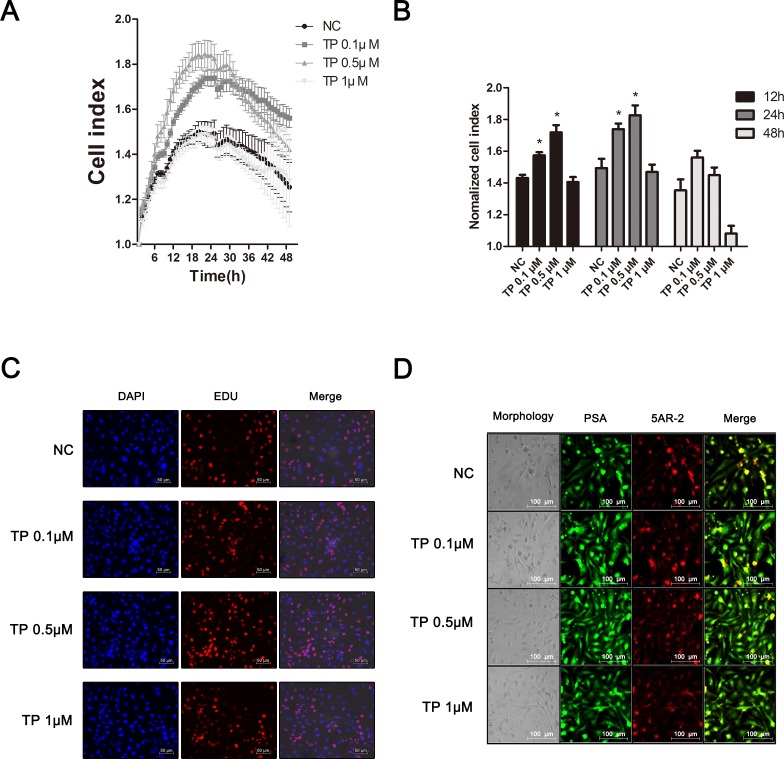
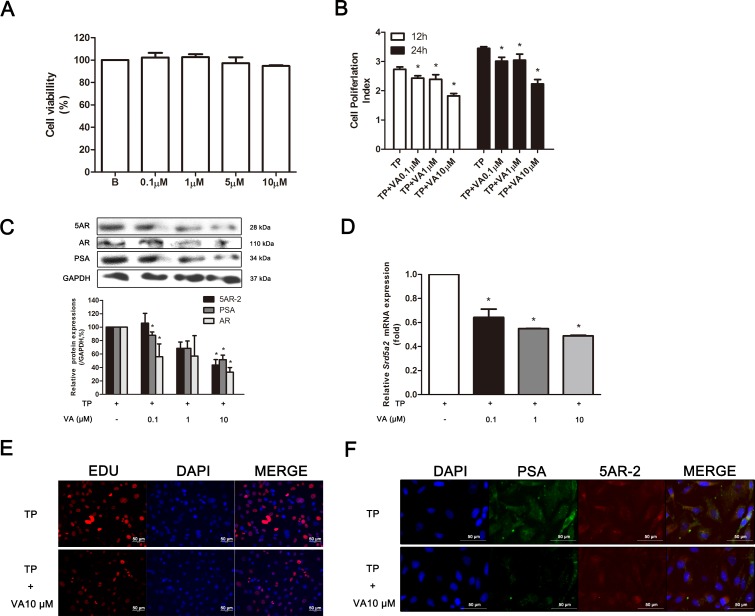
Benign prostatic hyperplasia (BPH) is a common disease in the male population, especially in elderly men. Vanillic acid (VA), a dihydroxybenzoic derivative used as a flavoring agent, is reported to have an anti-inflammatory effect. However, there are no reports of its effects on BPH to date. BPH was induced with a pre-4-week treatment of daily subcutaneous injections of testosterone propionate (TP), and the normal control group received injections of ethanol with corn oil instead. Six weeks of further injections were done with (a) ethanol with corn oil, (b) TP only, (c) TP + finasteride, and (d) TP + VA. Finasteride was used as a positive control group. VA had protective effects on the TP-induced BPH. In the VA treatment group, the prostate weight was reduced, and the histological changes including the epithelial thickness and lumen area were restored like in the normal control group. Furthermore, in the VA treatment group, two proliferation related factors, high molecular weight cytokeratin 34βE12 and α smooth muscle actin, were significantly down-regulated compared to the TP-induced BPH group. The expressions of dihydrotestosterone and 5α-reductase, the most crucial factors in BPH development, were suppressed by VA treatment. Expressions of the androgen receptor, estrogen receptor α and steroid receptor coactivator 1 were also significantly inhibited by VA compared to the TP-induced BPH group. In addition, we established an in vitro model for BPH by treating a normal human prostatic epithelial cell line RWPE-1 with TP. VA successfully inhibited proliferation and BPH-related factors in a concentration-dependent manner in this newly established model. These results suggest a new and potential pharmaceutical therapy of VA in the treatment of BPH.
Keywords: 5α-reductase; android receptor; benign prostatic hyperplasia (BPH); estrogen receptor α; vanillic acid.
Conflict of interest statement
CONFLICTS OF INTEREST The authors declare no competing financial interest.
Figures
Similar articles
-
Chrysophanic acid reduces testosterone-induced benign prostatic hyperplasia in rats by suppressing 5α-reductase and extracellular signal-regulated kinase.Oncotarget. 2017 Feb 7;8(6):9500-9512. doi: 10.18632/oncotarget.13430. Oncotarget. 2017. PMID: 27880726 Free PMC article.
-
Psoralea corylifolia L. extract ameliorates benign prostatic hyperplasia by regulating prostate cell proliferation and apoptosis.J Ethnopharmacol. 2021 Jun 12;273:113844. doi: 10.1016/j.jep.2021.113844. Epub 2021 Jan 21. J Ethnopharmacol. 2021. PMID: 33485982
-
Protective effects of combination of Stauntonia hexaphylla and Cornus officinalis on testosterone-induced benign prostatic hyperplasia through inhibition of 5α- reductase type 2 and induced cell apoptosis.PLoS One. 2020 Aug 13;15(8):e0236879. doi: 10.1371/journal.pone.0236879. eCollection 2020. PLoS One. 2020. PMID: 32790676 Free PMC article.
-
Dihydrotestosterone and the concept of 5alpha-reductase inhibition in human benign prostatic hyperplasia.Eur Urol. 2000 Apr;37(4):367-80. doi: 10.1159/000020181. Eur Urol. 2000. PMID: 10765065 Review.
-
Dihydrotestosterone and the prostate: the scientific rationale for 5alpha-reductase inhibitors in the treatment of benign prostatic hyperplasia.J Urol. 2004 Oct;172(4 Pt 1):1399-403. doi: 10.1097/01.ju.0000139539.94828.29. J Urol. 2004. PMID: 15371854 Review.
Cited by
-
Anti-Inflammatory and Antioxidant Effects of Kelong-Capsule on Testosterone-Induced Benign Prostatic Hyperplasia in Rats.Evid Based Complement Alternat Med. 2018 Jun 26;2018:5290514. doi: 10.1155/2018/5290514. eCollection 2018. Evid Based Complement Alternat Med. 2018. PMID: 30046340 Free PMC article.
-
In Vivo Effects of Polymerized Anthocyanin from Grape Skin on Benign Prostatic Hyperplasia.Nutrients. 2019 Oct 14;11(10):2444. doi: 10.3390/nu11102444. Nutrients. 2019. PMID: 31615010 Free PMC article.
-
Effects of red ginseng oil(KGC11o) on testosterone-propionate-induced benign prostatic hyperplasia.J Ginseng Res. 2022 May;46(3):473-480. doi: 10.1016/j.jgr.2021.11.005. Epub 2021 Nov 13. J Ginseng Res. 2022. PMID: 35600774 Free PMC article.
-
Effect of Pinoresinol and Vanillic Acid Isolated from Catalpa bignonioides on Mouse Myoblast Proliferation via the Akt/mTOR Signaling Pathway.Molecules. 2022 Aug 24;27(17):5397. doi: 10.3390/molecules27175397. Molecules. 2022. PMID: 36080161 Free PMC article.
-
Ixeris polycephala Extract Alleviates Progression of Benign Prostatic Hyperplasia via Modification of Proliferation, Apoptosis, and Inflammation.Pharmaceuticals (Basel). 2024 Aug 5;17(8):1032. doi: 10.3390/ph17081032. Pharmaceuticals (Basel). 2024. PMID: 39204137 Free PMC article.
References
-
- McVary KT. BPH: epidemiology and comorbidities. Am J Manag Care. 2006;12:S122–128. - PubMed
-
- Platz EA, Smit E, Curhan GC, Nyberg LM, Giovannucci E. Prevalence of and racial/ethnic variation in lower urinary tract symptoms and noncancer prostate surgery in U.S. men. Urology. 2002;59:877–883. - PubMed
-
- Meigs JB, Mohr B, Barry MJ, Collins MM, McKinlay JB. Risk factors for clinical benign prostatic hyperplasia in a community-based population of healthy aging men. J Clin Epidemiol. 2001;54:935–944. - PubMed
-
- Berry SJ, Coffey DS, Walsh PC, Ewing LL. The development of human benign prostatic hyperplasia with age. J Urol. 1984;132:474–479. - PubMed
LinkOut - more resources
Full Text Sources
Other Literature Sources
