

Xenotransplantation of pediatric low grade gliomas confirms the enrichment of BRAF V600E mutation and preservation of CDKN2A deletion in a novel orthotopic xenograft mouse model of progressive pleomorphic xanthoastrocytoma
- PMID: 29152094
- PMCID: PMC5675646
- DOI: 10.18632/oncotarget.20713
Xenotransplantation of pediatric low grade gliomas confirms the enrichment of BRAF V600E mutation and preservation of CDKN2A deletion in a novel orthotopic xenograft mouse model of progressive pleomorphic xanthoastrocytoma
Abstract
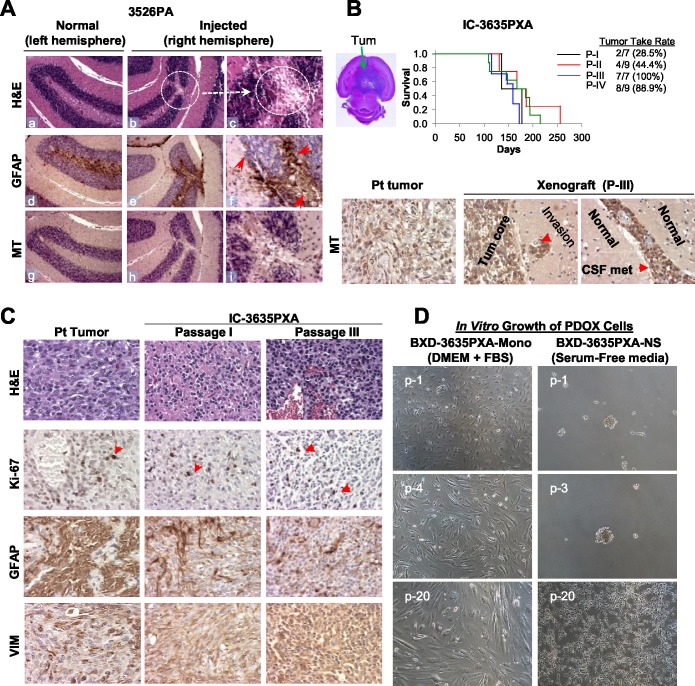
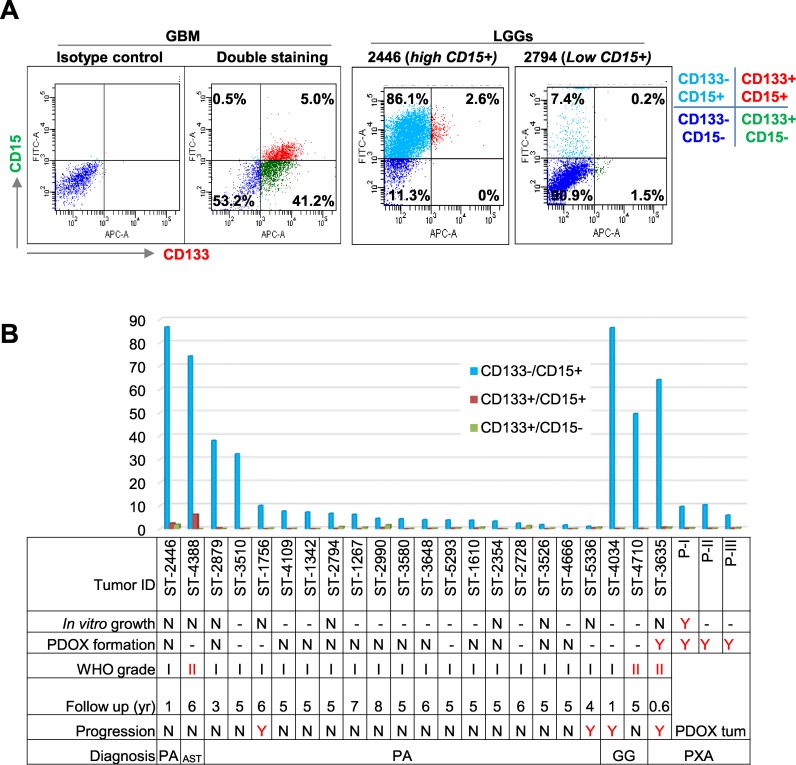
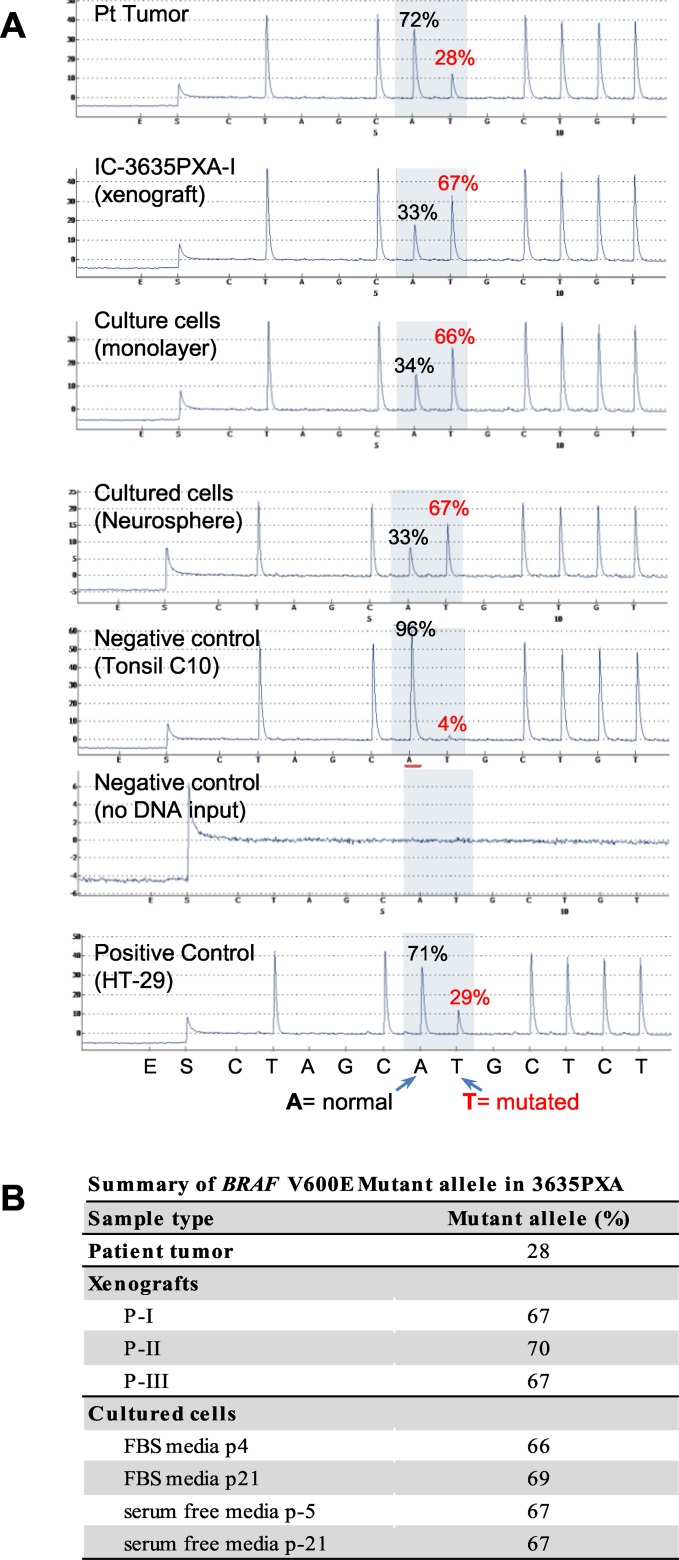
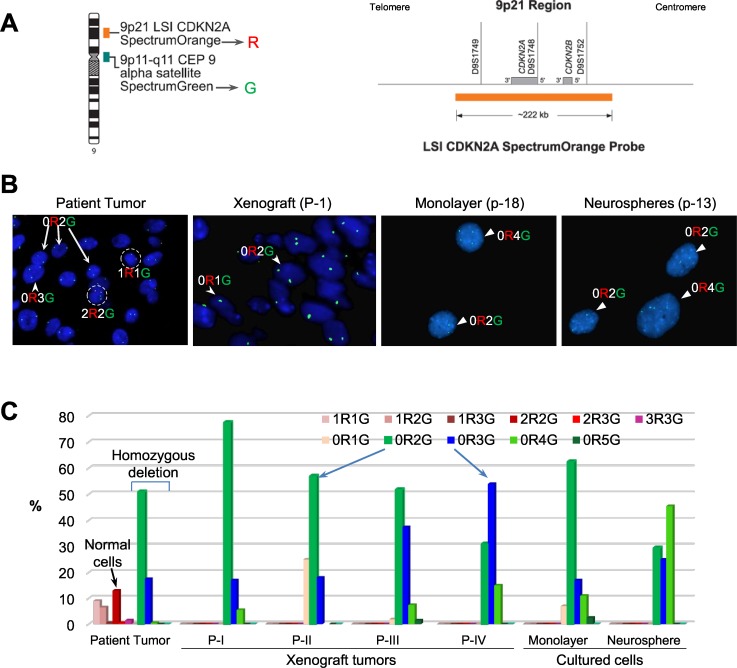
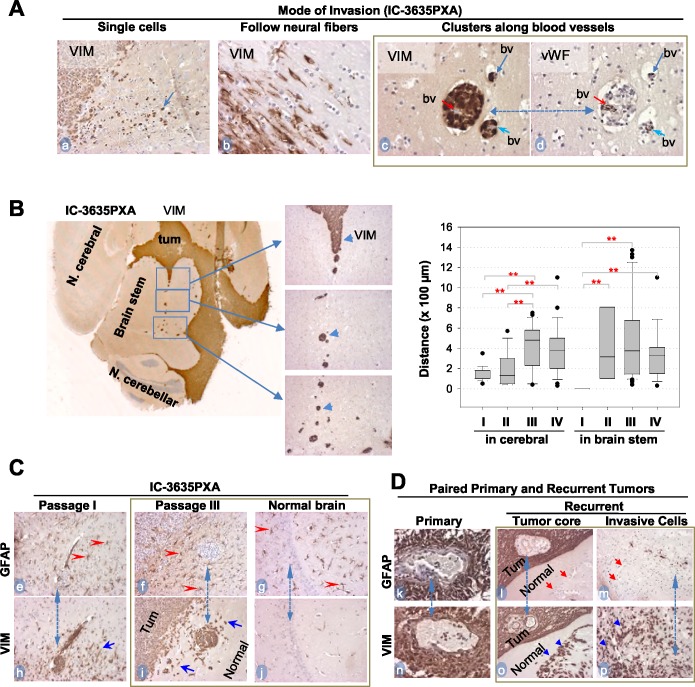
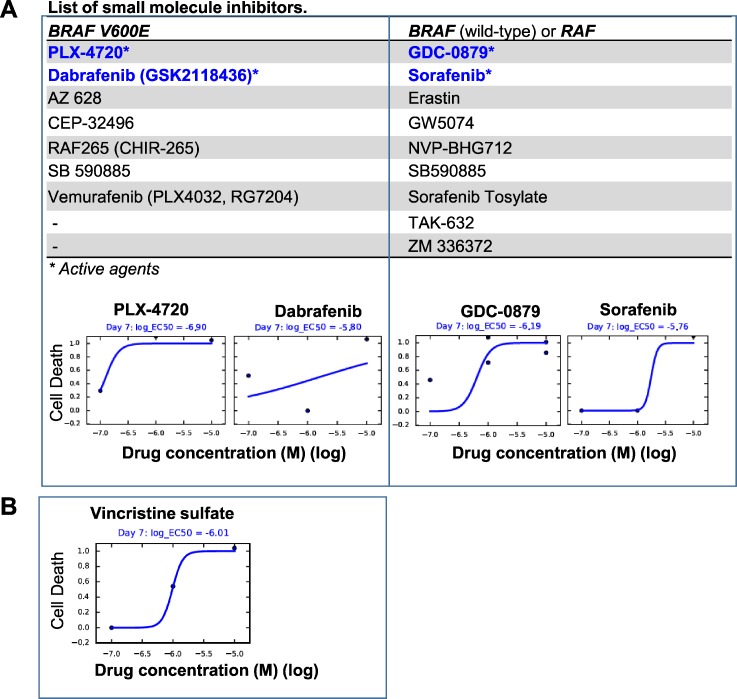
To identify cellular and molecular changes that driver pediatric low grade glioma (PLGG) progression, we analyzed putative cancer stem cells (CSCs) and evaluated key biological changes in a novel and progressive patient-derived orthotopic xenograft (PDOX) mouse model. Flow cytometric analysis of 22 PLGGs detected CD133+ (<1.5%) and CD15+ (20.7 ± 28.9%) cells, and direct intra-cranial implantation of 25 PLGGs led to the development of 1 PDOX model from a grade II pleomorphic xanthoastrocytoma (PXA). While CSC levels did not correlate with patient tumor progression, neurosphere formation and in vivo tumorigenicity, the PDOX model, IC-3635PXA, reproduced key histological features of the original tumor. Similar to the patient tumor that progressed and recurred, IC-3635PXA also progressed during serial in vivo subtransplantations (4 passages), exhibiting increased tumor take rate, elevated proliferation, loss of mature glial marker (GFAP), accumulation of GFAP-/Vimentin+ cells, enhanced local invasion, distant perivascular migration, and prominent reactive gliosis in normal mouse brains. Molecularly, xenograft cells with homozygous deletion of CDKN2A shifted from disomy chromosome 9 to trisomy chromosome 9; and BRAF V600E mutation allele frequency increased (from 28% in patient tumor to 67% in passage III xenografts). In vitro drug screening identified 2/7 BRAF V600E inhibitors and 2/9 BRAF inhibitors that suppressed cell proliferation. In summary, we showed that PLGG tumorigenicity was low despite the presence of putative CSCs, and our data supported GFAP-/Vimentin+ cells, CDKN2A homozygous deletion in trisomy chromosome 9 cells, and BRAF V600E mutation as candidate drivers of tumor progression in the PXA xenografts.
Keywords: BRAF V600E; CDKN2A; cancer stem cell; low grade glioma; orthotopic xenograft.
Conflict of interest statement
CONFLICTS OF INTEREST There is no conflict of interests for any author.
Figures
Similar articles
-
Recurrent copy number alterations in low-grade and anaplastic pleomorphic xanthoastrocytoma with and without BRAF V600E mutation.Brain Pathol. 2018 Mar;28(2):172-182. doi: 10.1111/bpa.12495. Epub 2017 Apr 2. Brain Pathol. 2018. PMID: 28181325 Free PMC article.
-
Pediatric low-grade gliomas can be molecularly stratified for risk.Acta Neuropathol. 2018 Oct;136(4):641-655. doi: 10.1007/s00401-018-1874-3. Epub 2018 Jun 14. Acta Neuropathol. 2018. PMID: 29948154
-
BRAF V600E in a preclinical model of pleomorphic Xanthoastrocytoma: Analysis of the tumor microenvironment and immune cell infiltration dynamics in vivo.Mol Ther Oncol. 2024 Apr 25;32(2):200808. doi: 10.1016/j.omton.2024.200808. eCollection 2024 Jun 20. Mol Ther Oncol. 2024. PMID: 38784952 Free PMC article.
-
Paediatric Gliomas: BRAF and Histone H3 as Biomarkers, Therapy and Perspective of Liquid Biopsies.Cancers (Basel). 2021 Feb 4;13(4):607. doi: 10.3390/cancers13040607. Cancers (Basel). 2021. PMID: 33557011 Free PMC article. Review.
-
BRAF V600E-mutated diffuse glioma in an adult patient: a case report and review.Brain Tumor Pathol. 2016 Jan;33(1):40-9. doi: 10.1007/s10014-015-0234-4. Epub 2015 Oct 7. Brain Tumor Pathol. 2016. PMID: 26445861 Review.
Cited by
-
CDKN2A/B Loss Is Associated with Anaplastic Transformation in a Case of NTRK2 Fusion-positive Pilocytic Astrocytoma.Neuropathol Appl Neurobiol. 2019 Feb;45(2):174-178. doi: 10.1111/nan.12503. Epub 2018 Jun 21. Neuropathol Appl Neurobiol. 2019. PMID: 29804288 Free PMC article.
-
Direct Implantation of Patient Brain Tumor Cells into Matching Locations in Mouse Brains for Patient-Derived Orthotopic Xenograft Model Development.Cancers (Basel). 2024 Apr 28;16(9):1716. doi: 10.3390/cancers16091716. Cancers (Basel). 2024. PMID: 38730671 Free PMC article.
-
Conditional reprogramming culture conditions facilitate growth of lower-grade glioma models.Neuro Oncol. 2021 May 5;23(5):770-782. doi: 10.1093/neuonc/noaa263. Neuro Oncol. 2021. PMID: 33258947 Free PMC article.
-
Sleeping Beauty transposon mutagenesis in mouse intestinal organoids identifies genes involved in tumor progression and metastasis.Cancer Gene Ther. 2024 Apr;31(4):527-536. doi: 10.1038/s41417-023-00723-x. Epub 2024 Jan 4. Cancer Gene Ther. 2024. PMID: 38177308
-
The Neuroimmune Regulation and Potential Therapeutic Strategies of Optic Pathway Glioma.Brain Sci. 2023 Oct 7;13(10):1424. doi: 10.3390/brainsci13101424. Brain Sci. 2023. PMID: 37891793 Free PMC article. Review.
References
-
- Malkki H. Neuro-oncology: Long-term outcomes in childhood low-grade glioma. Nat Rev Neurol. 2016;12:188.
-
- Ater JL, Xia C, Mazewski CM, Booth TN, Freyer DR, Packer RJ, Sposto R, Vezina G, Pollack IF. Nonrandomized comparison of neurofibromatosis type 1 and non-neurofibromatosis type 1 children who received carboplatin and vincristine for progressive low-grade glioma: A report from the Children's Oncology Group. Cancer. 2016;122:1928–36. - PMC - PubMed
-
- Hoffman RM. Orthotopic metastatic (MetaMouse) models for discovery and development of novel chemotherapy. Methods Mol Med. 2005;111:297–322. - PubMed
-
- Hoffman RM. Orthotopic metastatic mouse models for anticancer drug discovery and evaluation: a bridge to the clinic. Invest New Drugs. 1999;17:343–59. - PubMed
Grants and funding
LinkOut - more resources
Full Text Sources
Other Literature Sources
Research Materials
Miscellaneous
