. 2017 Sep 18;8(50):87607-87622.
doi: 10.18632/oncotarget.20999. eCollection 2017 Oct 20.

Necdin modulates leukemia-initiating cell quiescence and chemotherapy response

Affiliations

Necdin modulates leukemia-initiating cell quiescence and chemotherapy response

Chonghua Yao et al. Oncotarget. .

Abstract

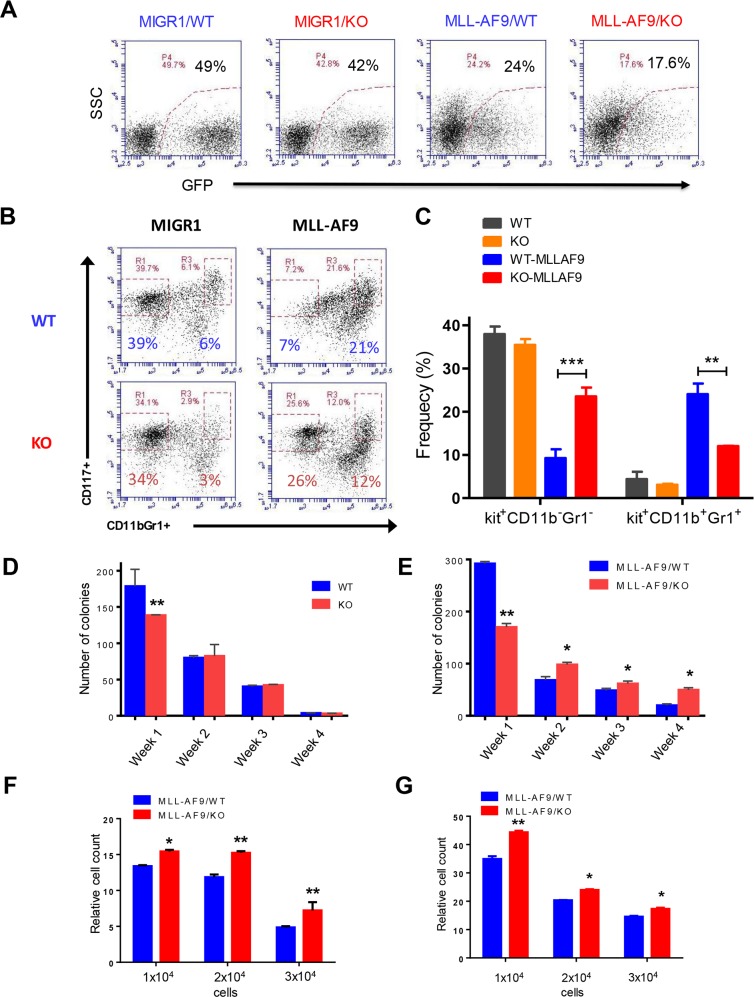
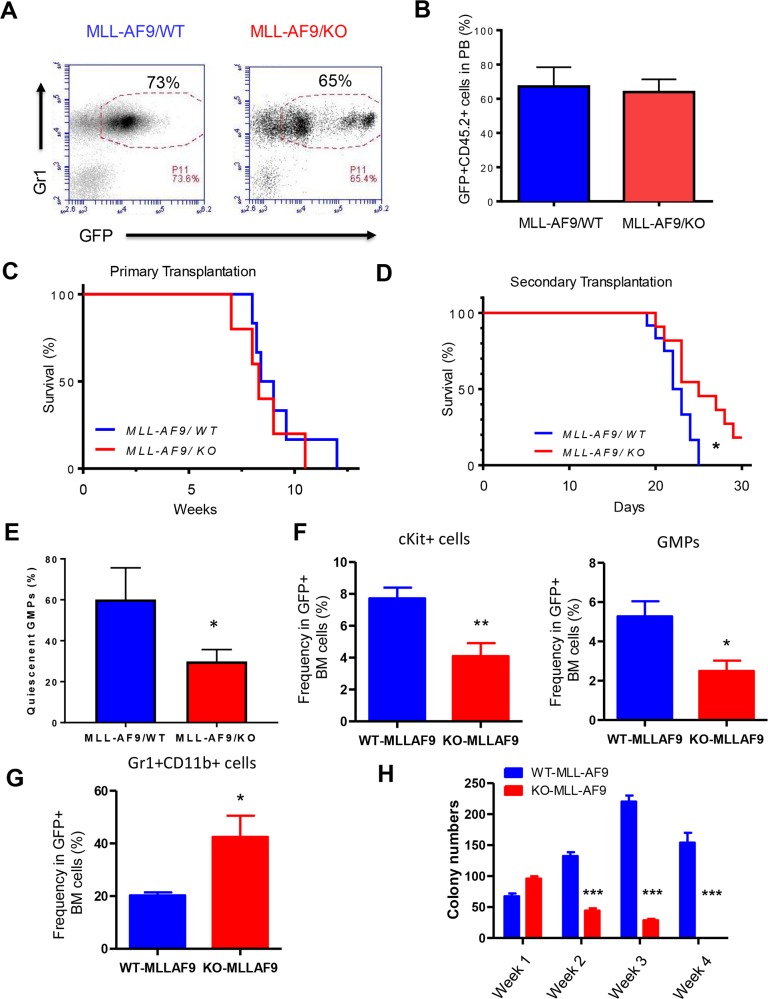
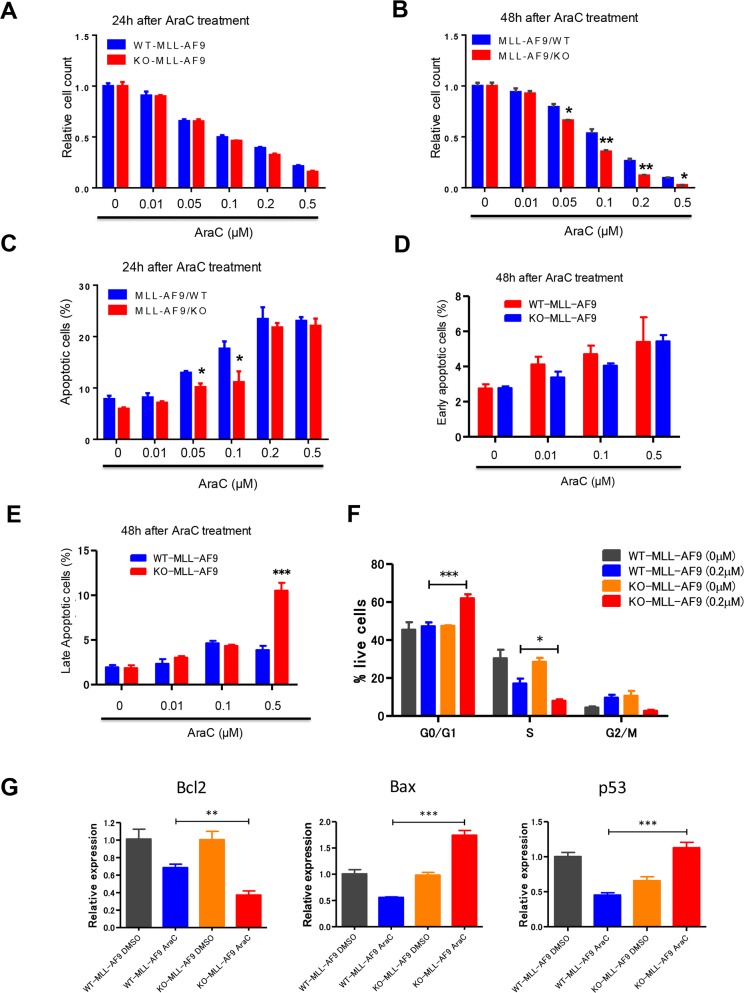
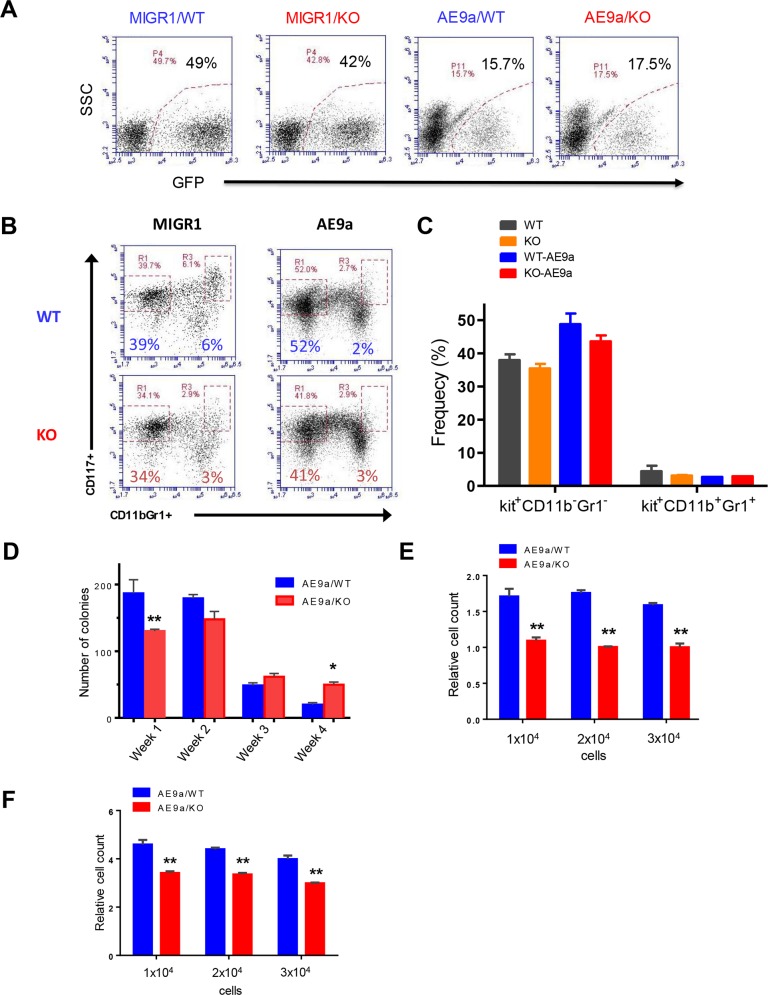
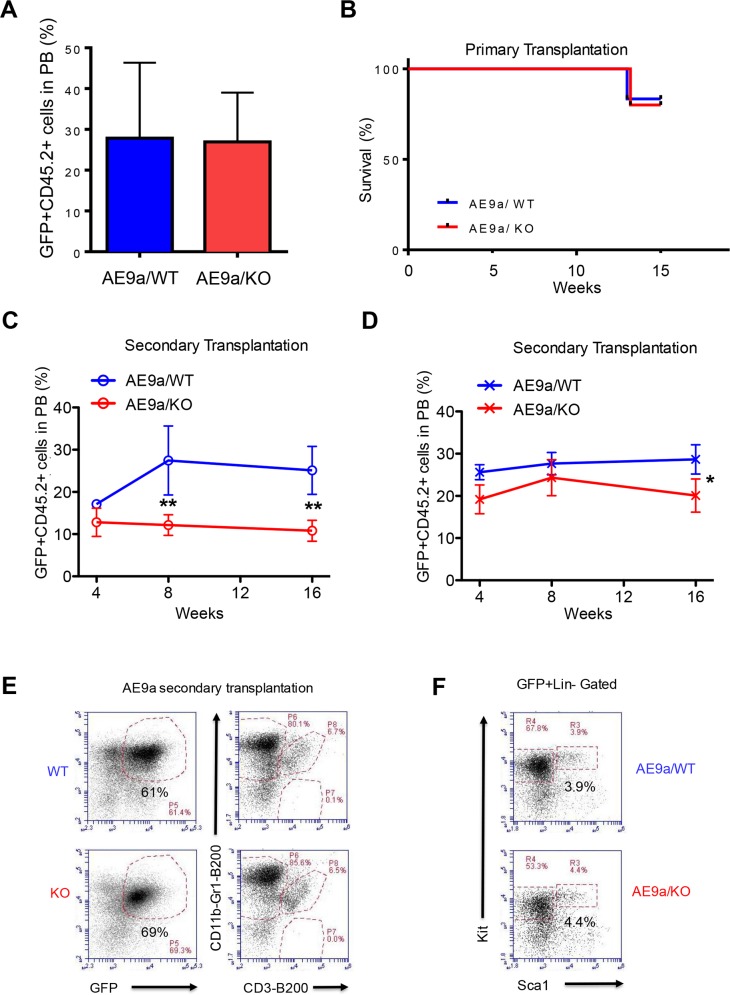
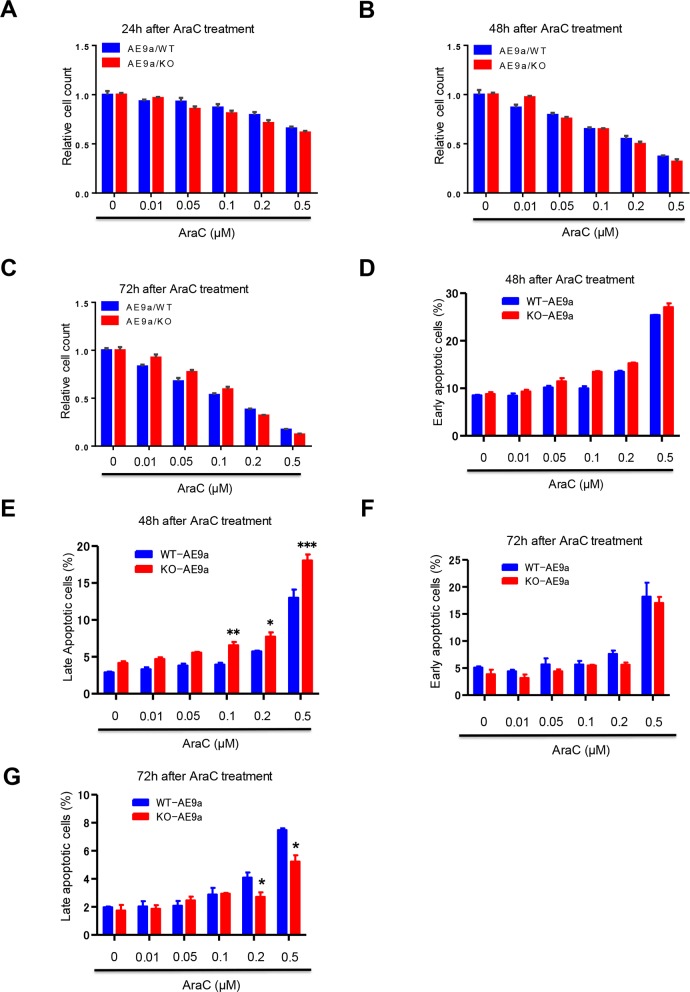
Acute myeloid leukemia (AML) is a devastating illness which carries a very poor prognosis, with most patients living less than 18 months. Leukemia relapse may occur because current therapies eliminate proliferating leukemia cells but fail to eradicate quiescent leukemia-initiating cells (LICs) that can reinitiate the disease after a period of latency. While we demonstrated that p53 target gene Necdin maintains hematopoietic stem cell (HSC) quiescence, its roles in LIC quiescence and response to chemotherapy are unclear. In this study, we utilized two well-established murine models of human AML induced by MLL-AF9 or AML1-ETO9a to determine the role of Necdin in leukemogenesis. We found that loss of Necdin decreased the number of functional LICs and enhanced myeloid differentiation in vivo, leading to delayed development of leukemia induced by MLL-AF9. Importantly, Necdin null LICs expressing MLL-AF9 were less quiescent than wild-type LICs. Further, loss of Necdin enhanced the response of MLL-AF9+ leukemia cells to chemotherapy treatment, manifested by decreased viability and enhanced apoptosis. We observed decreased expression of Bcl2 and increased expression of p53 and its target gene Bax in Necdin null leukemia cells following chemotherapy treatment, indicating that p53-dependent apoptotic pathways may be activated in the absence of Necdin. In addition, we found that loss of Necdin decreased the engraftment of AML1-ETO9a+ hematopoietic stem and progenitor cells in transplantation assays. However, Necdin-deficiency did not affect the response of AML1-ETO9a+ hematopoietic cells to chemotherapy treatment. Thus, Necdin regulates leukemia-initiating cell quiescence and chemotherapy response in a context-dependent manner. Our findings suggest that pharmacological inhibition of Necdin may hold potential as a novel therapy for leukemia patients with MLL translocations.

Keywords: MLL-AF9; Necdin; chemotherapy; leukemia-initiating cells; quiescence.


Conflict of interest statement

CONFLICTS OF INTEREST The authors declared that no conflicts of interest exists.

Figures

Figure 1
Figure 1. Necdin deficiency enhances the proliferation of hematopoietic progenitor cells expressing MLL-AF9
(A) Fetal liver cells isolated from wild-type (WT) or Necdin knock-out (KO) mice were transduced with retroviruses expressing GFP (MIGR1) or MLL-AF9. Representative flow cytometry plots show the frequency of transduced cells (GFP+) 72 hours following transduction. (B) Transduced wild type and Necdin null fetal liver cells (GFP+) were cultured in serum free medium in the presence of cytokines for seven days. The frequency of hematopoietic stem and progenitor cells was determined by flow cytometry analysis. Representative flow cytometry plots show the frequency of Kit+CD11bGr1 and Kit+CD11b+Gr1+ cells at 7 days in liquid culture. (C) The frequency of Kit+CD11bGr1 and Kit+CD11b+Gr1+ cells in the liquid culture (**p<0.01, ***p<0.001, n=2). (D) Serial replating studies. CFUs were quantified by methylcellulose culture using WT and Necdin null fetal liver cells. The methylcellulose cultures were serially replated, weekly, for 4 weeks. Mean values (± SD) were shown (**p<0.01, n=3). (E) Necdin null fetal liver cells expressing MLL-AF9 show enhanced replating potential compared to WT cells (*p<0.05, **p<0.01, n=3). (F) and (G) Liquid culture of WT and Necdin null fetal liver cells expressing MLL-AF9. 48 (F) and 72 (G) hours later, cell proliferation was determined by cell counting. Cell growth was presented relative to the number of input cells in each group, set as 1 (*p<0.05, **p<0.01, n=3).
Figure 2
Figure 2. Necdin deficiency delays the progression of leukemia-induced by MLL-AF9
(A) Primary transplantation of fetal liver cells expressing MLL-AF9. Representative flow cytometry plots show the frequency of GFP+Gr1+ cells in the peripheral blood of recipient mice 4 weeks following transplantation. (B) The frequency of donor-derived cells (CD45.2+GFP+) in the peripheral blood (PB) of recipient mice was determined by flow cytometry analysis (p=0.2, n=5). (C) Survival curve of animals transplanted with wild type or Necdin null fetal liver cells expressing MLL-AF9 (p=0.2, n=5). (D) Bone marrow cells isolated from primary recipient mice were transplanted into lethally irradiated recipient mice. Survival curve of recipient mice transplanted with WT or Necdin null leukemia cells expressing MLL-AF9 (*p<0.05, n=7). (E) The quiescence of GMPs in the BM of leukemia mice were determined by Ki67 and DAPI staining. Quiescent cells are defined as Ki67 cells (*p<0.05, n=3). (F) The frequency of Kit+ cells and GMPs in the BM of leukemia mice was determined by flow cytometry analysis (*p<0.05, **p<0.01, n=5). (G) The frequency of myeloid cells (Gr1+CD11b+) in the BM of leukemia mice was determined by flow cytometry analysis (*p<0.05, n=5). (H) Necdin null GMPs expressing MLL-AF9 show decreased replating potential compared to wild type leukemia cells (***p<0.001, n=3).
Figure 3
Figure 3. Necdin null leukemia cells expressing MLL-AF9 are sensitive to chemotherapy treatment
(A) and (B) WT and Necdin null leukemia cells expressing MLL-AF9 were treated with DMSO or different concentrations of chemotherapy drug cytarabine (AraC). 24 (A) and 48 (B) hours after AraC treatment, the viability of treated leukemia cells was measured by cell counting (*p<0.05, **p<0.01, n=3). (C) WT and Necdin null leukemia cells expressing MLL-AF9 were treated with DMSO or different concentrations of AraC. 24 hours after AraC treatment, the frequency of total apoptotic cells (Annexin V+) was determined by flow cytometry analysis (*p<0.05, n=3). (D) and (E) WT and Necdin null leukemia cells expressing MLL-AF9 were treated with DMSO or different concentrations of AraC. 48 hours after AraC treatment, the frequency of early apoptotic cells (Annexin V+PI) and late apoptotic cells (Annexin V+PI+) was determined by flow cytometry analysis (***p<0.001, n=3). (F) Wild type and Necdin null leukemia cells were treated with DMSO or AraC (0.2 μM). 24 hours later, cell cycle status of leukemia cells was determined by flow cytometry analysis (*p<0.05, ***p<0.001, n=3). (G) Wild type and Necdin null leukemia cells were treated with DMSO or AraC. 6 hours later, the expression of Bcl2, Bax, and p53 in leukemia cells was determined by quantitative real-time PCR analysis (**p<0.01, ***p<0.001, n=3).
Figure 4
Figure 4. Necdin deficiency decreases the proliferation of hematopoietic progenitor cells expressing AML1-ETO9a
(A) Fetal liver cells isolated from wild-type (WT) or Necdin knock-out (KO) mice were transduced with retroviruses expressing GFP (MIGR1) or AML1-ETO9a. Representative flow cytometry plots show the frequency of transduced cells (GFP+) 72 hours following transduction. (B) Transduced wild type and Necdin null fetal liver cells (GFP+) were cultured in serum free medium in the presence of cytokines for seven days. The frequency of hematopoietic stem and progenitor cells was determined by flow cytometry analysis. Representative flow cytometry plots show the frequency of Kit+CD11bGr1 and Kit+CD11b+Gr1+ cells at 7 days in liquid culture. (C) The frequency of Kit+CD11bGr1 and Kit+CD11b+Gr1+ cells in the liquid culture (p<0.2, n=2). (D) Necdin null fetal liver cells expressing AML1-ETO9a show enhanced replating potential compared to WT cells (*p<0.05, **p<0.01, n=3). (E) Liquid culture of WT and Necdin null fetal liver cells expressing AML1-ETO9a. Cell proliferation at 48 hours was determined by cell counting. Cell growth was presented relative to the number of input cells in each group, set as 1 (**p<0.01, n=3). (F) Liquid culture of WT and Necdin null fetal liver cells expressing AML1-ETO9a. Cell proliferation at 72 hours was determined by cell counting. Cell growth was presented relative to the number of input cells in each group, set as 1 (**p<0.01, n=3).
Figure 5
Figure 5. Necdin deficiency decreases the repopulating potential of hematopoietic stem and progenitor cells expressing AML1-ETO9a
(A) Primary transplantation of fetal liver cells expressing AML1-ETO9a. The frequency of donor-derived cells (CD45.2+GFP+) in the peripheral blood (PB) of recipient mice at 8 weeks following transplantation was determined by flow cytometry analysis (p=0.2, n=5-6). (B) Survival curve of animals transplanted with WT or Necdin null fetal liver cells expressing AML1-ETO9a (P=0.2, n=5-6). (C) and (D) Secondary transplantation assays using 3 × 10⁵ (C) or 3 ×10⁶ (D) bone marrow cells from mice repopulated with WT or Necdin null fetal liver cell expressing AML1-ETO9a. The frequency of donor-derived cells (CD45.2+GFP+) in peripheral blood was measured by flow cytometry analysis every four weeks for 16 weeks. (*p<0.05, **p<0.01, n=5). (E) The frequency of donor-derived (CD45.2+GFP+) myeloid cells (CD11b+Gr1+), B cells (B220+), and T cells (CD3+) in the bone marrow of secondary recipient mice at 16 weeks following transplantation was determined by flow cytometry analysis. (F) The frequency of donor-derived (CD45.2+GFP+) LinSca1Kit+ and LinSca1+Kit+ cells in the bone marrow of secondary recipient mice at 16 weeks following transplantation was determined by flow cytometry analysis.
Figure 6
Figure 6. The impact of AraC treatment on hematopoietic cells expressing AML1-ETO9a
(A), (B), and (C) WT and Necdin null hematopoietic cells expressing AML1-ETO9a were treated with DMSO or different concentrations of chemotherapy drug cytarabine (AraC). 24 (A), 48 (B), and 72 (C) hours after AraC treatment, the viability of treated hematopoietic cells was measured by cell counting (n=3). (D) and (E) WT and Necdin null hematopoietic cells expressing AML1-ETO9a were treated with DMSO or different concentrations of AraC. 48 hours after AraC treatment, the frequency of early apoptotic cells (Annexin V+PI) and late apoptotic cells (Annexin V+PI+) was determined by flow cytometry analysis (*p<0.05, **p<0.01, ***p<0.001, n=3). (F) and (G) WT and Necdin null hematopoietic cells expressing AML1-ETO9a were treated with DMSO or different concentrations of AraC. 72 hours after AraC treatment, the frequency of early apoptotic cells (Annexin V+PI) and late apoptotic cells (Annexin V+PI+) was determined by flow cytometry analysis (*p<0.05, n=3).

Similar articles

Cited by

References

    1. Roboz GJ. Current treatment of acute myeloid leukemia. Curr Opin Oncol. 2012;24:711–19. - PubMed
    1. Kreso A, Dick JE. Evolution of the cancer stem cell model. Cell Stem Cell. 2014;14:275–91. - PubMed
    1. Hope KJ, Jin L, Dick JE. Acute myeloid leukemia originates from a hierarchy of leukemic stem cell classes that differ in self-renewal capacity. Nat Immunol. 2004;5:738–43. - PubMed
    1. Tenen DG. Disruption of differentiation in human cancer: AML shows the way. Nat Rev Cancer. 2003;3:89–101. - PubMed
    1. Shlush LI, Zandi S, Mitchell A, Chen WC, Brandwein JM, Gupta V, Kennedy JA, Schimmer AD, Schuh AC, Yee KW, McLeod JL, Doedens M, Medeiros JJ, et al. HALT Pan-Leukemia Gene Panel Consortium Identification of pre-leukaemic haematopoietic stem cells in acute leukaemia. Nature. 2014;506:328–33. - PMC - PubMed