. 2017 Aug 14;8(50):88122-88138.
doi: 10.18632/oncotarget.21490. eCollection 2017 Oct 20.

Breast tissue, oral and urinary microbiomes in breast cancer

Affiliations

Breast tissue, oral and urinary microbiomes in breast cancer

Hannah Wang et al. Oncotarget. .

Abstract

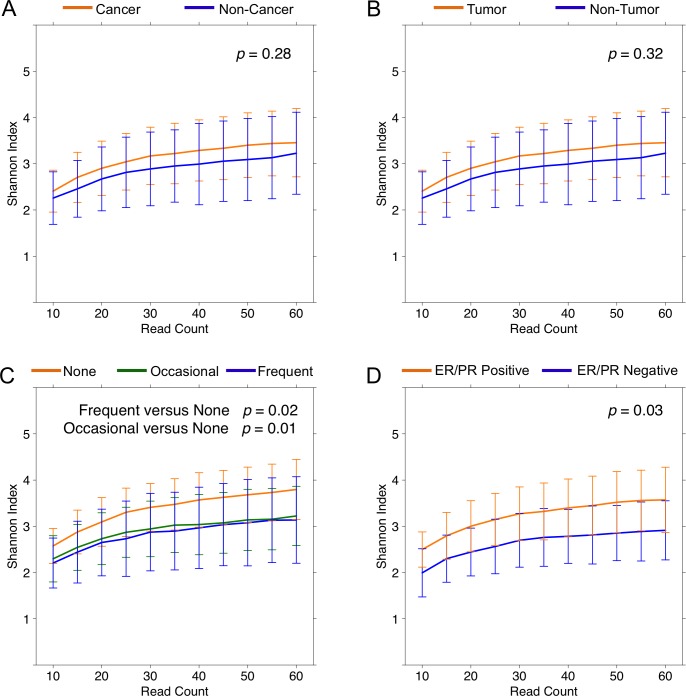
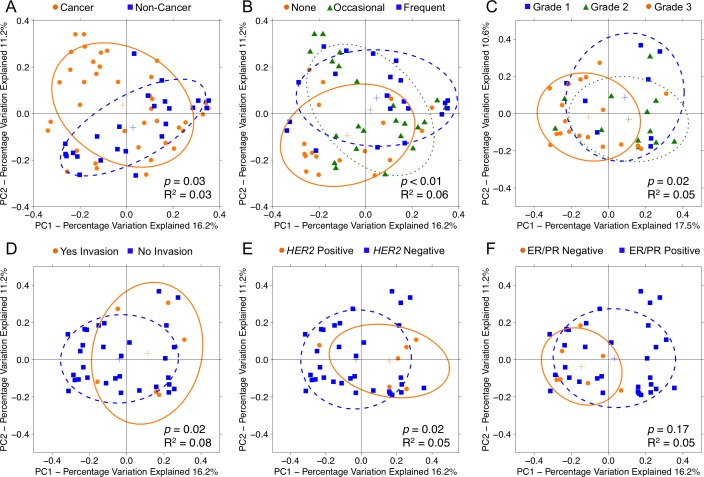
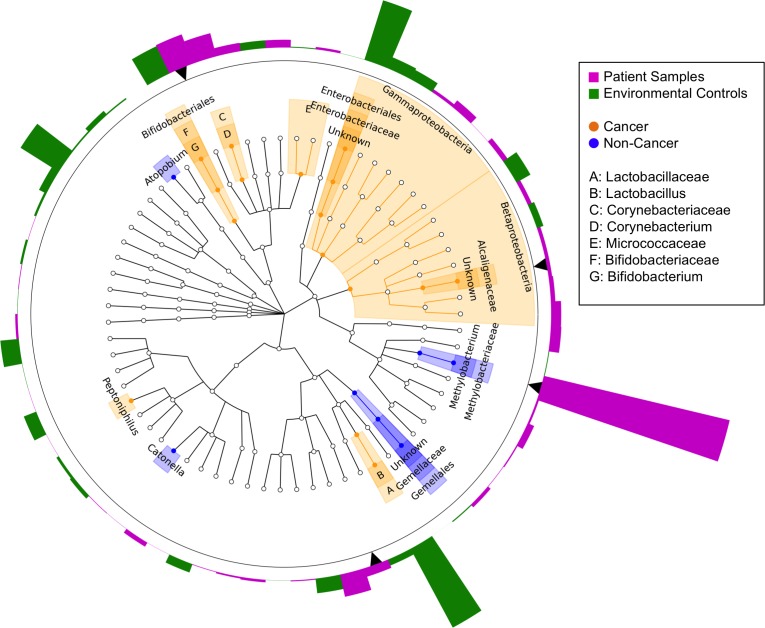
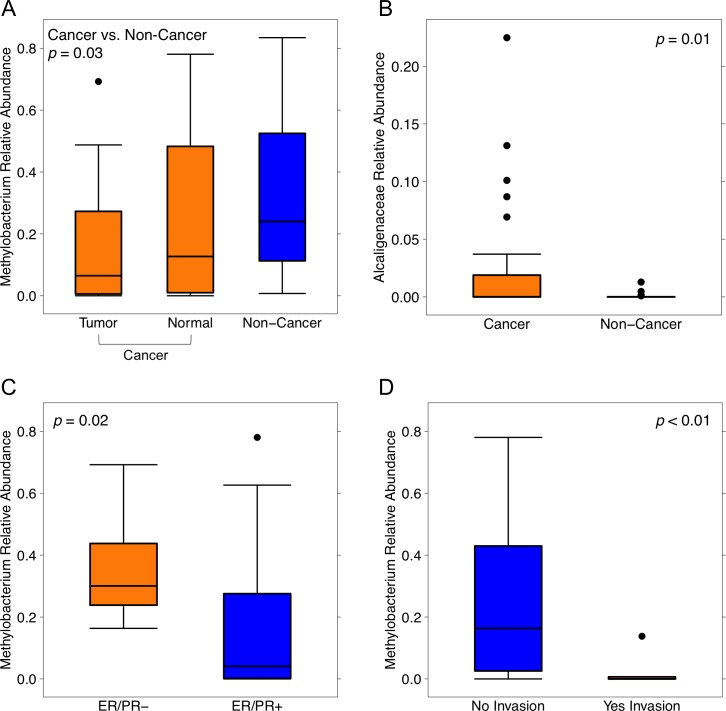
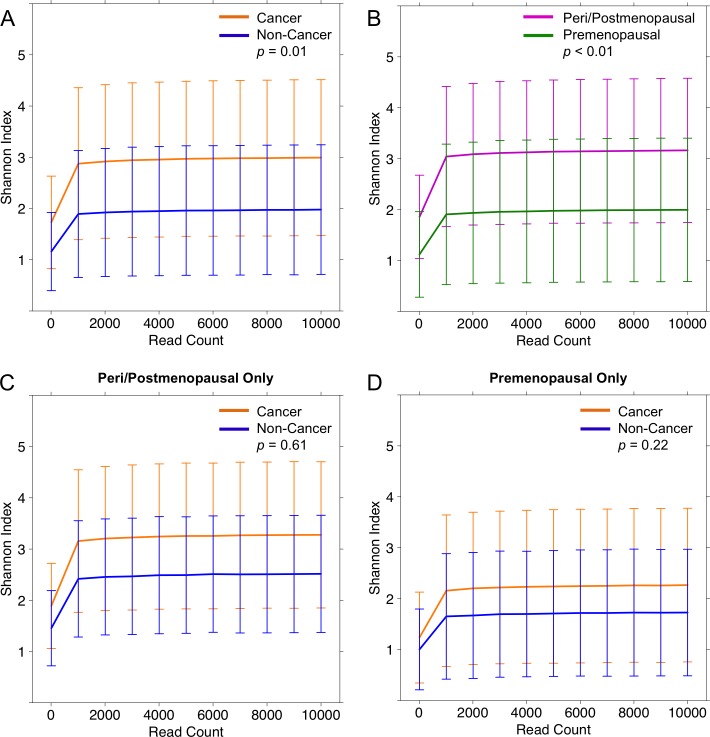
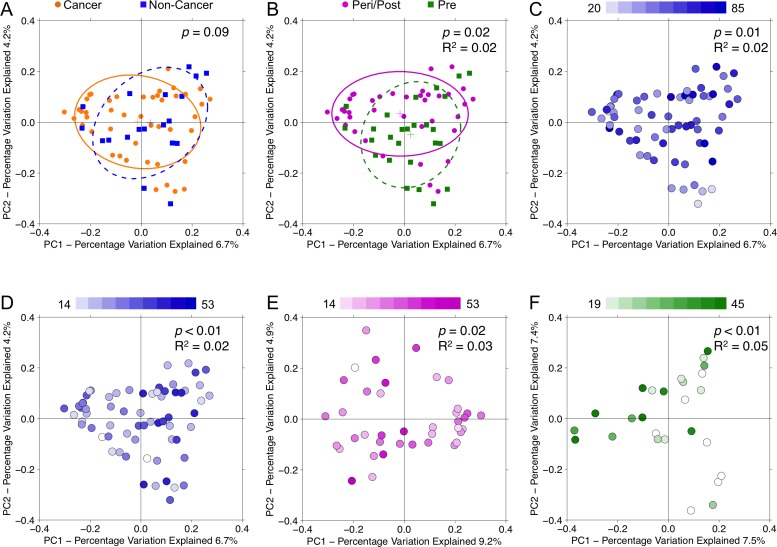
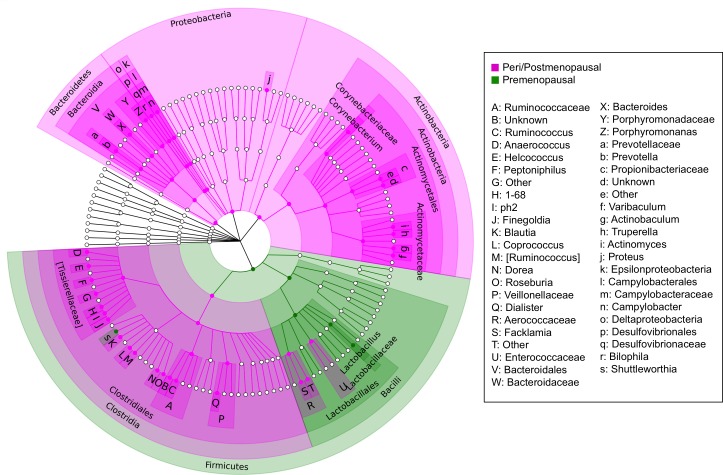
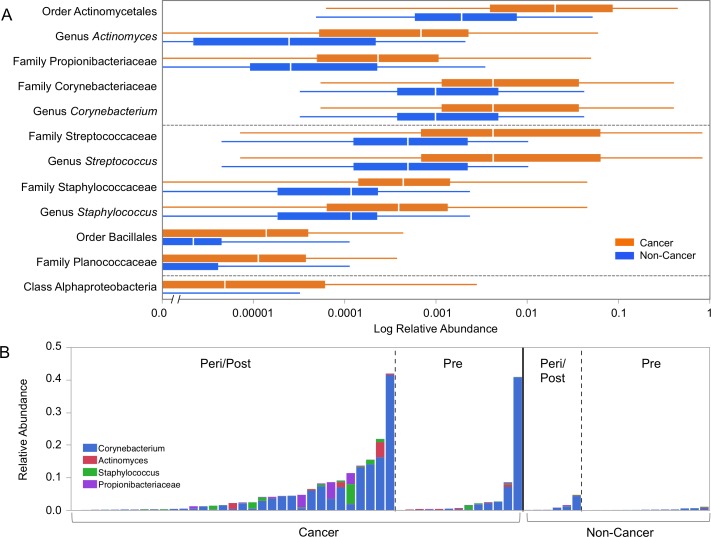
It has long been proposed that the gut microbiome contributes to breast carcinogenesis by modifying systemic estrogen levels. This is often cited as a possible mechanism linking breast cancer and high-fat, low-fiber diets as well as antibiotic exposure, associations previously identified in population-based studies. More recently, a distinct microbiome has been identified within breast milk and tissue, but few studies have characterized differences in the breast tissue microbiota of patients with and without cancer, and none have investigated distant body-site microbiomes outside of the gut. We hypothesize that cancerous breast tissue is associated with a microbiomic profile distinct from that of benign breast tissue, and that microbiomes of more distant sites, the oral cavity and urinary tract, will reflect dysbiosis as well. Fifty-seven women with invasive breast cancer undergoing mastectomy and 21 healthy women undergoing cosmetic breast surgery were enrolled. The bacterial 16S rRNA gene was amplified from urine, oral rinse and surgically collected breast tissue, sequenced, and processed through a QIIME-based bioinformatics pipeline. Cancer patient breast tissue microbiomes clustered significantly differently from non-cancer patients (p=0.03), largely driven by decreased relative abundance of Methylobacterium in cancer patients (median 0.10 vs. 0.24, p=0.03). There were no significant differences in oral rinse samples. Differences in urinary microbiomes were largely explained by menopausal status, with peri/postmenopausal women showing decreased levels of Lactobacillus. Independent of menopausal status, however, cancer patients had increased levels of gram-positive organisms including Corynebacterium (p<0.01), Staphylococcus (p=0.02), Actinomyces (p<0.01), and Propionibacteriaceae (p<0.01). Our observations suggest that the local breast microbiota differ in patients with and without breast cancer. Cancer patient urinary microbiomes were characterized by increased levels of gram-positive organisms in this study, but need to be further studied in larger cohorts.

Keywords: breast cancer; metagenomics; microbiome; oral; urine.


Conflict of interest statement

CONFLICTS OF INTEREST The authors declare that they have no relevant conflicts of interest.

Figures

Figure 1
Figure 1. Alpha diversity rarefaction curves for breast tissue samples
Rarefaction curves of Shannon diversity index up to 60 reads in (A) cancer (orange) and non-cancer (blue) samples, (B) tumor (orange) and non-tumor (blue) samples from cancer patients, (C) self-reported frequent (blue), occasional (green), and none (orange) alcohol users, and (D) hormone receptor positive (orange) and hormone receptor negative (blue) samples. Error bars represent standard deviation.
Figure 2
Figure 2. Principal coordinates analysis plots on unweighted UniFrac distances of breast tissue samples
Overall oral microbiomic diversity of patient samples as represented by the first two principal coordinates on principal coordinates analysis of unweighted UniFrac distances. Each point represents a single sample, with plus sign and ellipses representing the fitted mean and 68% confidence interval of each group respectively. (A) Cancer samples (orange) clustered distinctly relative to non-cancer samples (blue), and (B) patient samples clustered by degree of alcohol use: none (orange), occasional (green), frequent (blue). Among cancer patients, samples clustered by (C) histologic grade: grade 1 (blue), grade 2 (green), grade 3 (orange), (D) presence of lymphovascular invasion: yes (orange), no (blue), (E) HER2 amplification status: positive (orange), negative (blue), and (F) hormone receptor status: ER/PR negative (orange), ER/PR positive (blue). For hormone receptor status, only weighted UniFrac distance comparisons were significant (p = 0.05, R2 = 0.05), but the unweighted plot is presented here for consistency.
Figure 3
Figure 3. Cladogram of differentially abundant taxa in cancer and non-cancer patient breast tissue
Cladogram depicting phylogenetic relationship of taxa identified as significantly different (p < 0.05) by Wilcoxon rank-sum testing in cancer as compared to non-cancer patient samples. Each concentric ring of nodes represents a taxonomic rank, starting with phylum and ending with genus. Nodes highlighted in orange are increased in cancer relative to non-cancer samples, and nodes highlighted in blue are increased in non-cancer relative to cancer samples. Each bar in the circular bar plot surrounding the cladogram represents the difference in mean relative abundance of each genus in patient samples as compared to environmental controls, with a greater height indicating a larger difference. The color of the bars indicates the direction of the difference: higher in environmental samples (green), higher in patient samples (magenta). Black arrows indicate genera identified as significantly increased in patient samples as compared to environmental controls. Only Methylobacterium and an unknown genus of the family Alcaligenaceae were significantly differentially abundant in cancer and non-cancer samples, in addition to being significantly increased in patient samples above environmental controls.
Figure 4
Figure 4. Relative abundances of Methylobacterium and Alcaligenaceae by sample type and clinical-pathologic features
Box plots representing (A) relative abundances of genus Methylobacterium by sample type: cancer (orange) and non-cancer (blue), (B) relative abundances of unknown genus of family Alcaligenaceae by sample type: cancer (orange), and non-cancer (blue), relative abundances of genus Methylobacterium by (C) hormone receptor status: ER/PR negative (orange), ER/PR positive (blue), and (D) lymphovascular invasion: no (blue), yes (orange). Dark horizontal lines represent the median, with the box representing the first (Q1) and third (Q3) quartiles, the outer fences representing 1.5 x interquartile range, and the black circles representing outliers.
Figure 5
Figure 5. Alpha diversity rarefaction curves for urine samples
Rarefaction curves of Shannon diversity index up to 1000 reads in (A) cancer (orange) and non-cancer (blue) samples and (B) peri/postmenopausal (magenta) and premenopausal (green) samples from cancer patients. When stratified by menopausal status, Shannon index was no longer significantly different in cancer and non-cancer samples, in either (C) peri/postmenopausal patient samples: cancer (orange), non-cancer (blue), or (D) premenopausal patient samples: cancer (orange), non-cancer (blue). Error bars represent standard deviation.
Figure 6
Figure 6. Principal coordinates analysis plots on unweighted UniFrac distances of urine samples
Overall oral microbiomic diversity of patient samples as represented by the first two principal coordinates on principal coordinates analysis of unweighted UniFrac distances. Each point represents a single sample, with plus sign and ellipses representing the fitted mean and 68% confidence interval of each group respectively. While (A) cancer (orange) and non-cancer (blue) samples did not cluster distinctly, (B) peri/postmenopausal (magenta) and premenopausal (green) samples did cluster significantly differently. Additionally, urine samples separated by (C) age (younger to older: white to blue) and (D) BMI (younger to older: white to blue). Even when stratifying by menopausal status, urine samples continued to separate significantly by BMI in both (E) peri/postmenopausal and (F) premenopausal patients.
Figure 7
Figure 7. Cladogram of differentially abundant taxa in peri/postmenopausal and premenopausal patient urine
Cladogram depicting phylogenetic relationship of taxa identified as significantly different (p < 0.05) by Wilcoxon rank-sum testing in peri/postmenopausal and premenopausal patient urine samples. Each concentric ring of nodes represents a taxonomic rank, starting with phylum and ending with genus. Nodes highlighted in magenta are increased in peri/postmenopausal relative to premenopausal samples, and nodes highlighted in green are increased in premenopausal relative to peri/postmenopausal samples. The urine samples of peri/postmenopausal women is characterized by a loss of Lactobacillus, and a concomitant increase in taxa from most other phyla, particularly anaerobes.
Figure 8
Figure 8. Relative abundances of differentially abundant taxa in cancer and non-cancer patient urine
(A) Box plots representing log relative abundances of taxa identified as significantly different (p < 0.05) by Wilcoxon rank-sum testing in cancer (orange) and non-cancer (blue) patient urine samples. Note that the x-axis is plotted on a logarithmic scale, with an axis break to allow for plotting of zero-values. (B) Stacked bar graph representing relative abundances of Corynebacterium (blue), Actinomyces (red), Staphylococcus (green), and Propionibacteriaceae (purple) in individual samples grouped by menopausal and cancer status. Streptococcus and Planococcaceae were not represented due to being significantly correlated with BMI [Supplementary Figure 3].

Similar articles

Cited by

References

    1. World Health Organization World Health Statistics 2012 WHO. 2012. p. 171.
    1. Lacey JV, Kreimer AR, Buys SS, Marcus PM, Chang SC, Leitzmann MF, Hoover RN, Prorok PC, Berg CD, Hartge P. Breast cancer epidemiology according to recognized breast cancer risk factors in the Prostate, Lung, Colorectal and Ovarian (PLCO) Cancer Screening Trial Cohort. BMC Cancer. 2009;9:84. https://doi.org/10.1186/1471-2407-9-84 - DOI - PMC - PubMed
    1. Madigan MP, Ziegler RG, Benichou J, Byrne C, Hoover RN. Proportion of breast cancer cases in the United States explained by well-established risk factors. J Natl Cancer Inst. 1995;87:1681–5. https://doi.org/10.1093/jnci/87.22.1681 - DOI - PubMed
    1. Peterson J, Garges S, Giovanni M, McInnes P, Wang L, Schloss JA, Bonazzi V, McEwen JE, Wetterstrand KA, Deal C, Baker CC, Di Francesco V, Howcroft TK, et al. The NIH Human Microbiome Project. Genome Res. 2009;19:2317–23. https://doi.org/10.1101/gr.096651.109 - DOI - PMC - PubMed
    1. Bultman SJ. Emerging roles of the microbiome in cancer. Carcinogenesis. 2014;35:249–55. https://doi.org/10.1093/carcin/bgt392 - DOI - PMC - PubMed