

Identifying the metabolomic fingerprint of high and low flavonoid consumers
- PMID: 29152238
- PMCID: PMC5672306
- DOI: 10.1017/jns.2017.27
Identifying the metabolomic fingerprint of high and low flavonoid consumers
Abstract
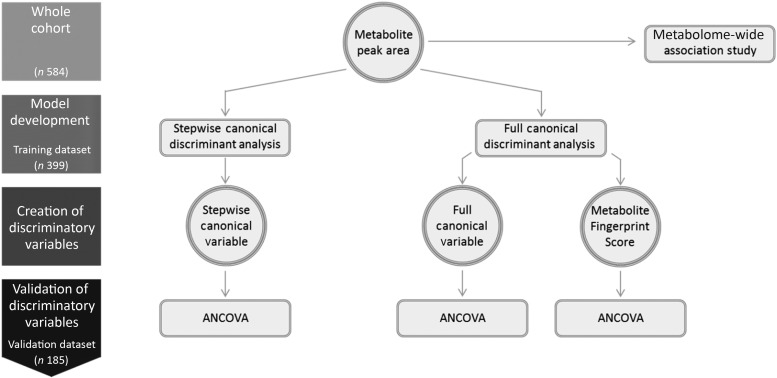
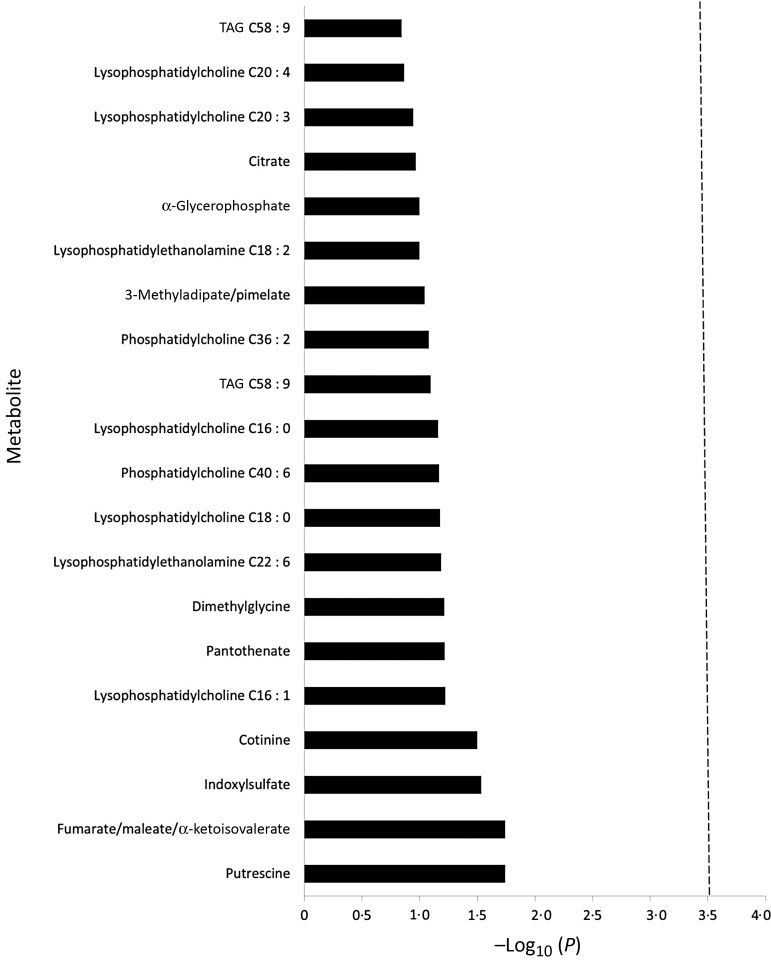
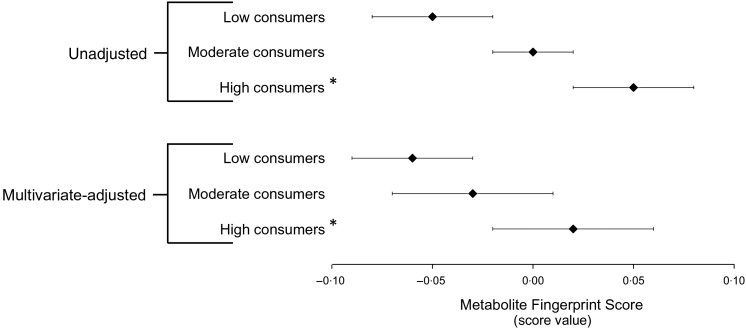
High flavonoid consumption can improve vascular health. Exploring flavonoid-metabolome relationships in population-based settings is challenging, as: (i) there are numerous confounders of the flavonoid-metabolome relationship; and (ii) the set of dependent metabolite variables are inter-related, highly variable and multidimensional. The Metabolite Fingerprint Score has been developed as a means of approaching such data. This study aims to compare its performance with that of more traditional methods, in identifying the metabolomic fingerprint of high and low flavonoid consumers. This study did not aim to identify biomarkers of intake, but rather to explore how systemic metabolism differs in high and low flavonoid consumers. Using liquid chromatography-tandem MS, 174 circulating plasma metabolites were profiled in 584 men and women who had complete flavonoid intake assessment. Participants were randomised to one of two datasets: (a) training dataset, to determine the models for the discrimination variables (n 399); and (b) validation dataset, to test the capacity of the variables to differentiate higher from lower total flavonoid consumers (n 185). The stepwise and full canonical variables did not discriminate in the validation dataset. The Metabolite Fingerprint Score successfully identified a unique pattern of metabolites that discriminated high from low flavonoid consumers in the validation dataset in a multivariate-adjusted setting, and provides insight into the relationship of flavonoids with systemic lipid metabolism. Given increasing use of metabolomics data in dietary association studies, and the difficulty in validating findings using untargeted metabolomics, this paper is of timely importance to the field of nutrition. However, further validation studies are required.
Keywords: Diet; Epidemiology; Flavonoids; HPFS, Health Professionals Follow-Up Study; Metabolomics; NHS, Nurses’ Health Study; Population; QC, quality control.
Figures

Similar articles
-
Urinary 1H Nuclear Magnetic Resonance Metabolomic Fingerprinting Reveals Biomarkers of Pulse Consumption Related to Energy-Metabolism Modulation in a Subcohort from the PREDIMED study.J Proteome Res. 2017 Apr 7;16(4):1483-1491. doi: 10.1021/acs.jproteome.6b00860. Epub 2017 Mar 16. J Proteome Res. 2017. PMID: 28067528
-
An untargeted metabolomics-driven approach based on LC-TOF/MS and LC-MS/MS for the screening of xenobiotics and metabolites of Zhi-Zi-Da-Huang decoction in rat plasma.J Pharm Biomed Anal. 2015 Nov 10;115:315-22. doi: 10.1016/j.jpba.2015.07.026. Epub 2015 Jul 26. J Pharm Biomed Anal. 2015. PMID: 26275719
-
Blood Metabolomic Profiling Confirms and Identifies Biomarkers of Food Intake.Metabolites. 2020 Nov 17;10(11):468. doi: 10.3390/metabo10110468. Metabolites. 2020. PMID: 33212857 Free PMC article.
-
Dietary flavonoid intake, total antioxidant capacity and lipid oxidative damage: A cross-sectional study of Iranian women.Nutrition. 2016 May;32(5):566-72. doi: 10.1016/j.nut.2015.11.011. Epub 2015 Dec 14. Nutrition. 2016. PMID: 26830011
-
Advances in metabolite identification.Bioanalysis. 2011 Aug;3(15):1769-82. doi: 10.4155/bio.11.155. Bioanalysis. 2011. PMID: 21827274 Review.
Cited by
-
Role of Dietary Flavonoid Compounds in Driving Patterns of Microbial Community Assembly.mBio. 2019 Sep 24;10(5):e01205-19. doi: 10.1128/mBio.01205-19. mBio. 2019. PMID: 31551328 Free PMC article.
-
Plasma Metabolomic Signatures of Healthy Dietary Patterns in the Chronic Renal Insufficiency Cohort (CRIC) Study.J Nutr. 2021 Oct 1;151(10):2894-2907. doi: 10.1093/jn/nxab203. J Nutr. 2021. PMID: 34195833 Free PMC article.
-
Elevated levels of urine isocitrate, hydroxymethylglutarate, and formiminoglutamate are associated with arterial stiffness in Korean adults.Sci Rep. 2021 May 13;11(1):10180. doi: 10.1038/s41598-021-89639-w. Sci Rep. 2021. PMID: 33986342 Free PMC article.
-
A lipid-related metabolomic pattern of diet quality.Am J Clin Nutr. 2020 Dec 10;112(6):1613-1630. doi: 10.1093/ajcn/nqaa242. Am J Clin Nutr. 2020. PMID: 32936887 Free PMC article.
-
Important Considerations for Sample Collection in Metabolomics Studies with a Special Focus on Applications to Liver Functions.Metabolites. 2020 Mar 12;10(3):104. doi: 10.3390/metabo10030104. Metabolites. 2020. PMID: 32178364 Free PMC article. Review.
References
-
- Jenkins H, Hardy N, Beckmann M, et al. (2004) A proposed framework for the description of plant metabolomics experiments and their results. Nat Biotechnol 22, 1601–1606. - PubMed
-
- Fiehn O (2002) Metabolomics – the link between genotypes and phenotypes. Plant Mol Biol 48, 155–171. - PubMed
-
- Kuhara T (2007) Noninvasive human metabolome analysis for differential diagnosis of inborn errors of metabolism. J Chromatogr B Analyt Technol Biomed Life Sci 855, 42–50. - PubMed
-
- Kind T, Tolstikov V, Fiehn O, et al. (2007) A comprehensive urinary metabolomic approach for identifying kidney cancer. Anal Biochem 363, 185–195. - PubMed
Grants and funding
LinkOut - more resources
Full Text Sources
Other Literature Sources
