. 2017 Dec 7;68(5):872-884.e6.
doi: 10.1016/j.molcel.2017.10.025. Epub 2017 Nov 16.

Polycomb Repressive Complex 2 Methylates Elongin A to Regulate Transcription

Affiliations

Polycomb Repressive Complex 2 Methylates Elongin A to Regulate Transcription

M Behfar Ardehali et al. Mol Cell. .

Abstract

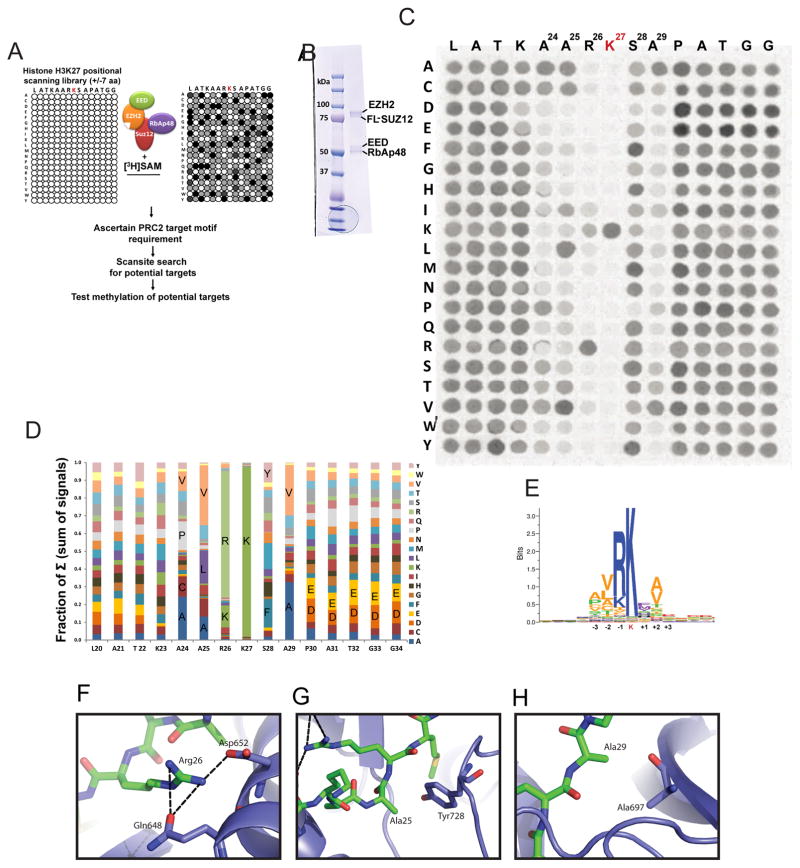
Polycomb repressive complex 2 (PRC2-EZH2) methylates histone H3 at lysine 27 (H3K27) and is required to maintain gene repression during development. Misregulation of PRC2 is linked to a range of neoplastic malignancies, which is believed to involve methylation of H3K27. However, the full spectrum of non-histone substrates of PRC2 that might also contribute to PRC2 function is not known. We characterized the target recognition specificity of the PRC2 active site and used the resultant data to screen for uncharacterized potential targets. The RNA polymerase II (Pol II) transcription elongation factor, Elongin A (EloA), is methylated by PRC2 in vivo. Mutation of the methylated EloA residue decreased repression of a subset of PRC2 target genes as measured by both steady-state and nascent RNA levels and perturbed embryonic stem cell differentiation. We propose that PRC2 modulates transcription of a subset of low expression target genes in part via methylation of EloA.

Keywords: EZH2; Elongin A; Elongin complex; Gene repression; Polycomb repressive complex 2 (PRC2); RNA polymerase II; SPOT assay; protein methylation; transcription.


Figures

Figure 1
Figure 1. Characterization of PRC2 Target Sequence Specificity by Positional-Scanning SPOT peptide Array
(A) Outline of the PRC2 MTase positional-scanning SPOT assay. (B) Coomassie stained gel of immunoaffinity purified core PRC2-EZH2 complex. (C) Result of PRC2 SPOT peptide assay with H3K27 peptides as the primary target of PRC2. Position of H3K27 and adjacent residues are shown above the membrane. The amino acid that each residue is substituted to is presented on the left side of the membrane. Dots represent methylation levels of PRC2 at each position. The experiment was carried out in duplicate using independent preparations of purified PRC2-EZH2 on different membranes with similar results (Figure S3A). Reaction conditions: 10nM PRC2, 0.25μM of 3H-SAM, 30min incubation. (D) Graph showing contribution of each amino acid to the sum (Σ) of total methylation signal at each position. (E) Sequence Logo (SeqLogo) representation of PRC2 target sequence preference motif. (F) Structure of PRC2 bound to target histone (PDB: 5HYN) showing formation of hydrogen bonds between Arg26 with Gln648 and Asp652. (G) Depicts proximity of Tyr728 of EZH2 to Ala25 explaining preference for hydrophobic and mainly non-bulky amino acids at this position. (H) Depiction of H3 Ala29 proximity to Ala697 of EZH2, showing suitability of hydrophobic or neutral amino acids at this position.
Figure 2
Figure 2. Identification and Characterization of Non-histone Methylation Substrates of PRC2
(A) PRC2 MTase assay on peptides representing 339 potential nuclear targets of PRC2. Native histone H3K27 (H3, blue circle), H3K27A (K>A, red circle) and optimal target sequence (Opt, green circle) are highlighted. List of targets and their respective methylation intensity provided in Table S1. (B) Methylation efficiency of native, K27A and Optimal peptides by PRC2 presented as bar graph (arbitrary unit, n=3, error bar denotes s.e.m). (C) Methylation of a subset of potential PRC2 targets as full length proteins. Coomassie stained gel (left panel) and fluorography of dried gel (right panel). Arrows and asterisks denote automethylation of EZH2 and methylation of targets, respectively. (D) Examining methylation of predicted target lysine residues by site-directed mutagenesis (left: coomassie stained gel, right: fluorography of dried gel. (E) THOC1 and PSMC6 are methylated upon methylation and binding of PRC2 to H3K27me3. (F) Position and sequence of tested Scansite predicted targets.
Figure 3
Figure 3. Elongin A K754 is Methylated by PRC2 in vivo
(A) Testing methylation of full length Elongin A, TBP and Rpb1 by PRC2. Left: coomassie stain, Right: Methylation signal. (B) Identification of EloAK754 as the target of PRC2 methylation in vitro. Top panels: methylation signal for native, K754A (two different concentrations) and K754R EloA point mutants, bottom: coomassie stain. (C) EloA is methylated in a functional Elongin complex found in vivo. Top panel depicts time-course graph of EloA methylation (n=3,s.e.m.). Bottom panels: Fluorography and coomassie stain of a representative in vitro MTase reaction. (D) Elongin A is methylated at K754 in vivo. Left: Detection of EloAK754me signal by immunoblotting after immunoprecipitation of EloA in WT and Ezh2−/− mES CJ7 cells. Right: Western Blot analysis of EZH2, EloA, histone H3 and H3K27me3 levels in mES cell lysates. (E) Immunoprecipitation of transiently-transfected FLAG-tagged WT and EloAK754R constructs in 3T3 cells showing specificity of ELoAK754me1 antibody signal (Pooled EloA K754me2, 3 antibodies). (F) Left: Inhibition of EZH2 MTase activity by GSK343 (6μM) decreases the levels of detectable Elongin A K754me1. Right: Western blot showing decrease in H3K27me3 levels upon GSK343 treatment. (G) Target methylation site of EloA is conserved in metazoan organisms, but absent in unicellular yeast species lacking PRC2 (Kalign MSA analysis, ClustalW output format).
Figure 4
Figure 4. Methylation of EloA by PRC2 tunes expression of Target Genes
(A) Scatter plot of differentially expressed genes in EloA K754R and EloA K754M vs. WT mES cells. Points represent mean RPKM (reads per kilobase per million) value of two biological replicates, upregulated and downregulated genes in orange and blue, respectively. (B) Heat map representation of the union of differentially-expressed genes in two biological replicates of EloA K754R and K754M edited mES cells (fold change larger than 2). (C) Venn diagrams showing the degree of overlap between upregulated and downregulated classes of differentially expressed genes (log2 of fold change) in Elongin A point mutants. (D) ChIP enrichment analysis (ChEA) showing the top four factors enriched by ChIP-seq at genes that are upregulated in EloA K754R cells. (E) Venn diagrams showing the degree of overlap between differentially expressed genes in Eed −/− and EloAK754-edited mES cells, p-value derived from hypergeometric test.
Figure 5
Figure 5. Example of PRC2 bound genes upregulated in Eed−/− and EloAK754R
Genome browser profiles of 7 representative, expressed genes upregulated in K754R edited and Eed −/− mES cells that show PRC2 enrichment (red EZH2 ChIP-seq track). Olig2 depicts a silent gene that is only upregulated in Eed−/− mES cells. RNA-seq values represent average RPKM (bin size=50bp, n=2). Bru-seq tracks (green) represent nascent transcription signal from a 10min 5-bromouridine pulse experiment. Only the intronic RPKM signals were used for differential gene expression comparison for Bru-seq.
Figure 6
Figure 6. EloA K754 mutations perturb differentiation of ES cells
(A) Point mutant EloA K754 cells form smaller and fewer EBs. Brightfield microscopy of EBs 5 days after LIF withdrawal. ES cells from different backgrounds were genetically-matched to corresponding WT mESC cells (CJ7 or CCE cells). Scale bars, 500 μm. (B) Mean projected area (horizontal line) of EBs relative to corresponding WT EBs (WT=1, n=24–53, error: s.d, P values (****p<0.0001, ***p<0.0002, unpaired two-tailed t test.) (C) Heat map representation of RNA-seq results of the union of differentially-expressed genes in day 5 EBs from the average of two biological replicates (fold change larger than 2), showing different gene expression clustering patterns between EloA K754R and K754M edited mES cells and EloA null and EloA +/− cells. D) Representative IGV signal tracks at 4 upregulated genes (Zim3, Pnrc2, Rxra and Plac1) in day 5 EloA K754R edited and Eed −/− EBs. Paternally-imprinted genes, as well as genes implicated in placenta development are significantly over-represented in Eed −/− and EloA K754-edited cells (Figure. S6E). E) Speculative model depicting downregulation of low expression target genes through methylation of EloA by PRC2. EloA methylation may recruit a hypothetical, repressive, EloAK754me-reader (red oval), reducing expression of targeted genes. Alternatively, allosteric changes induced by methylation of EloA may evict a positive transcription factor (green oval), leading to downregulation and fine tuning of transcription at the targeted gene. Therefore, absence of PRC2 (Eed −/−) or inability to methylate EloA K754 (EloA K754R), result in upregulation of targeted genes (mid and bottom panels, respectively).

References

    1. Abmayr SM, Carrozza MJ, Workman JL. Preparation of nuclear and cytoplasmic extracts from mammalian cells. Curr Protoc Pharmacol 2006 - PubMed
    1. Aso T, Lane WS, Conaway JW, Conaway RC. Elongin (SIII): a multisubunit regulator of elongation by RNA polymerase II. Science. 1995;269:1439–1443. - PubMed
    1. Aso T, Haque D, Barstead RJ, Conaway RC, Conaway JW. The inducible elongin A elongation activation domain: structure, function and interaction with the elongin BC complex. EMBO J. 1996;15:5557. - PMC - PubMed
    1. Beltran M, Yates CM, Skalska L, Dawson M, Reis FP, Viiri K, Fisher CL, Sibley CR, Foster BM, Bartke T, et al. The interaction of PRC2 with RNA or chromatin is mutually antagonistic. Genome Res. 2016;26:896–907. - PMC - PubMed
    1. Beringer M, Pisano P, Di Carlo V, Blanco E, Chammas P, Vizán P, Gutiérrez A, Aranda S, Payer B, Wierer M, et al. EPOP Functionally Links Elongin and Polycomb in Pluripotent Stem Cells. Mol Cell. 2016;64:645–658. - PubMed