. 2017 Dec 11;32(6):792-806.e7.
doi: 10.1016/j.ccell.2017.10.008. Epub 2017 Nov 16.

Aberrant Activation of a Gastrointestinal Transcriptional Circuit in Prostate Cancer Mediates Castration Resistance

Affiliations

Aberrant Activation of a Gastrointestinal Transcriptional Circuit in Prostate Cancer Mediates Castration Resistance

Shipra Shukla et al. Cancer Cell. .

Abstract

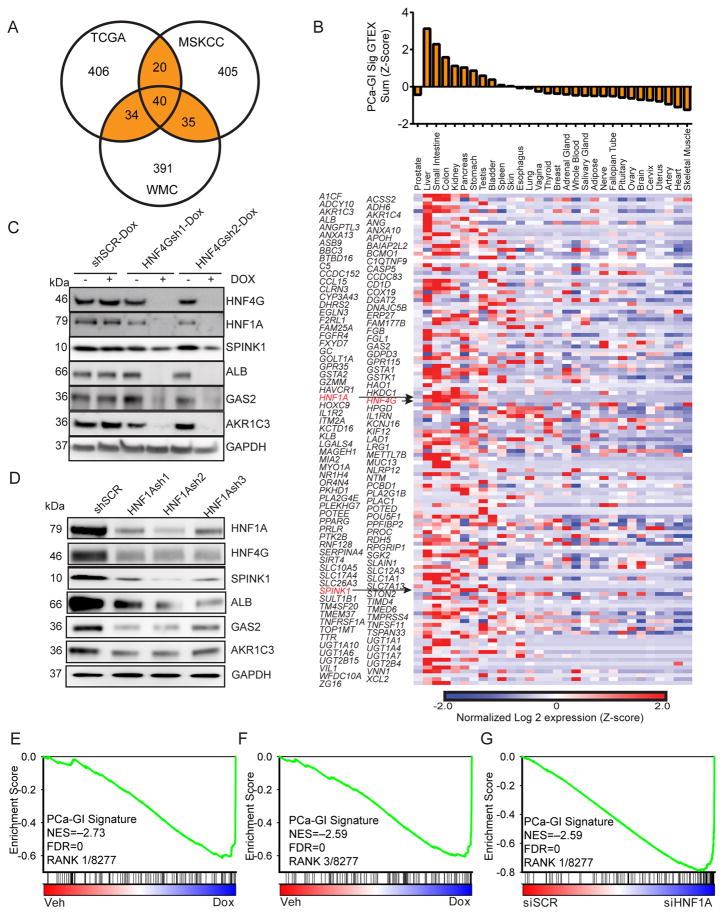
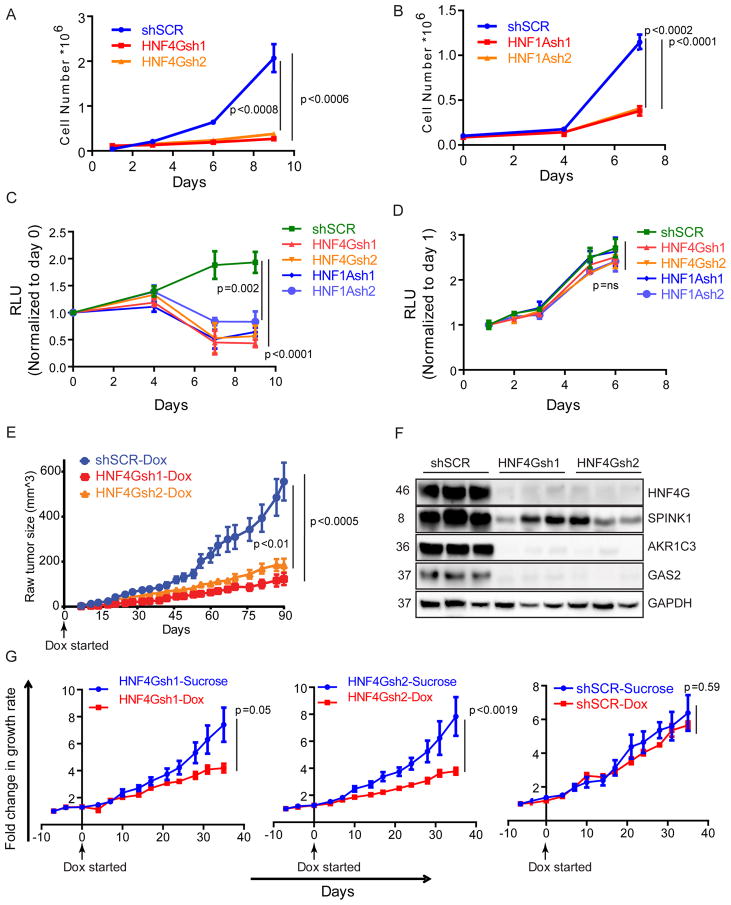
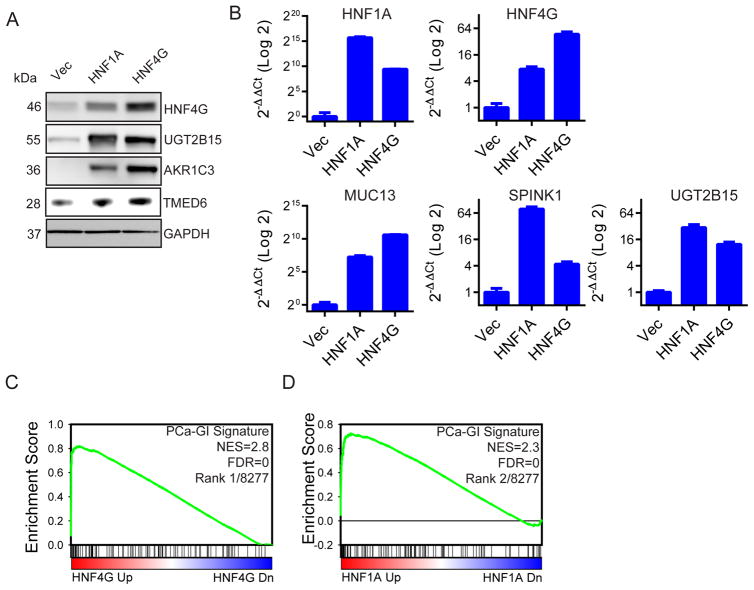
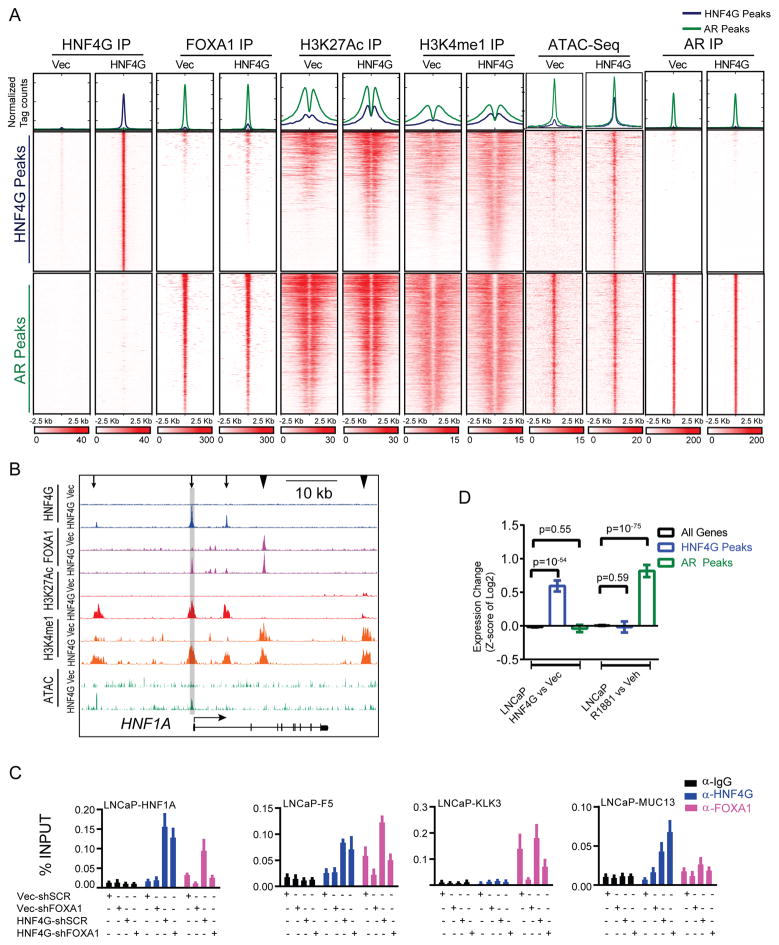
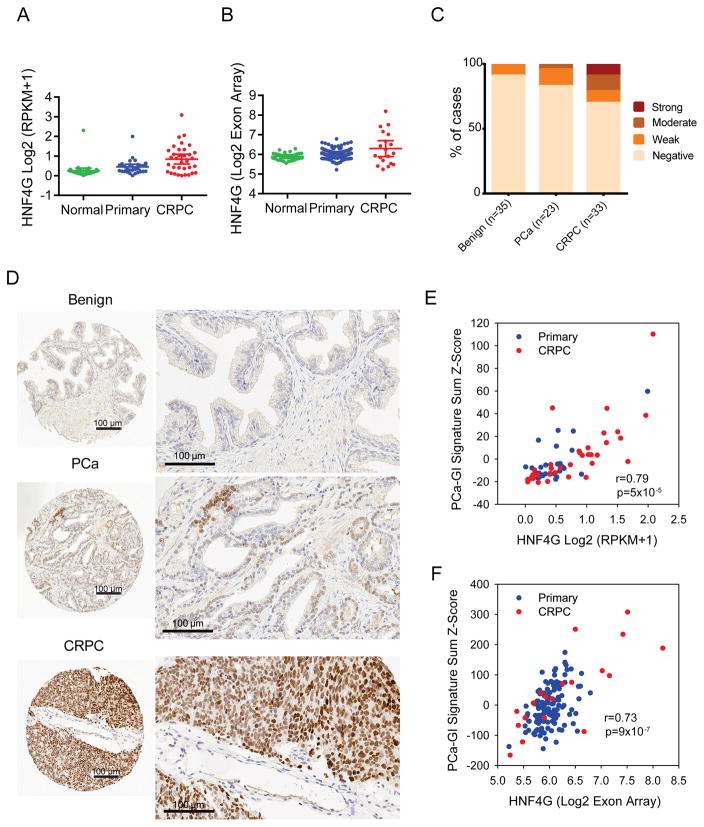
Prostate cancer exhibits a lineage-specific dependence on androgen signaling. Castration resistance involves reactivation of androgen signaling or activation of alternative lineage programs to bypass androgen requirement. We describe an aberrant gastrointestinal-lineage transcriptome expressed in ∼5% of primary prostate cancer that is characterized by abbreviated response to androgen-deprivation therapy and in ∼30% of castration-resistant prostate cancer. This program is governed by a transcriptional circuit consisting of HNF4G and HNF1A. Cistrome and chromatin analyses revealed that HNF4G is a pioneer factor that generates and maintains enhancer landscape at gastrointestinal-lineage genes, independent of androgen-receptor signaling. In HNF4G/HNF1A-double-negative prostate cancer, exogenous expression of HNF4G at physiologic levels recapitulates the gastrointestinal transcriptome, chromatin landscape, and leads to relative castration resistance.

Keywords: ChIP-seq; HNF1A; HNF4G; SPINK1; androgen-deprivation therapy; castration resistance; enzalutamide; pioneer factor; prostate cancer.


Figures

Figure 1
Figure 1. HNF4G and HNF1A regulate a GI gene signature in SPINK1-positive prostate cancer
(A) Venn diagram generated using top 500 genes whose expressions most correlated with SPINK1 expression in three different gene expression datasets. Highlighted is the PCa-GI signature of 129 genes that are common in two of three datasets. The 40 genes that are in all three sets are called Core PCa-GI signature. (B) Heat map of RNA-seq gene expression of the 129 individual SPINK1 correlated genes in normal tissues from GTEX, expressed as Z-score of log2 of read-per-kilobase mapped (RPKM). Top panel shows the sum expression of the 129 genes (Z-score). (C) Immunoblot against indicated PCa-GI signature proteins of indicated derivatives of 22Rv1 cells treated with vehicle or doxycycline for 72 hours. (D) Immunoblot against indicated PCa-GI signature proteins of 22Rv1 cells 72 hours after transduction with lentiviral shRNAs against HNF1A (HNF1Ash1, HNF1Ash2, HNF1Ash3) and a scrambled control (shSCR). (E, F) GSEA plot of PCa-GI gene signature in 22Rv1-HNF4Gsh1-Dox cells (E) or 22Rv1-HNF4Gsh2-Dox cells (F) treated with doxycycline compared to vehicle. NES: Normalized enrichment score. FDR: False discovery rate. (G) GSEA plot of PCa-GI gene signature in 22Rv1 cells transfected with HNF1A siRNA compared to scrambled siRNA. See also Figure S1 and Tables S1-S4.
Figure 2
Figure 2. SPINK1 positive prostate cancer require HNF4G/HNF1A axis for growth
(A, B) Cell growth curve of 22Rv1 following shRNA-mediated HNF4G (A) or HNF1A (B) knockdown and control. Mean ± SD. Two-tailed unpaired t-test, n=3. (C, D) Cell growth curve of human patient derived CRPC cell lines MSK-PCa10 (C) and MSK-PCa1 (D) following shRNA-mediated HNF4G and HNF1A knockdown and control. Mean ± SD. Two-tailed unpaired t-test, n=3. (E) Tumor formation and growth rate of indicated 22Rv1 cells when mice were fed with doxycycline drinking water beginning the same day as grafting. 2.0 × 10⁶ cells were subcutaneously injected into 6–8 weeks old CB17-SCID mice; n=10 for all groups. Mean ± SEM. Two-tailed unpaired t-test. (F) Immunoblots of three representative 22Rv1 explants obtained at the end of the experiment shown in (E). (G) Response of indicated 22Rv1 xenograft tumors in SCID mice upon starting doxycycline water diet when tumors reached approximately 100 mm3; for shSCR-sucrose and shSCR-DOX n=6; For HNF4Gsh1-sucrose and HNF4Gsh1-DOX n=8; for HNF4Gsh2-sucrose and HNF4Gsh2-DOX n=6 and 8 respectively. Fold change in tumor volume over day 0 (start of doxycycline water) is plotted. Mean ± SEM. Two-tailed unpaired t-test. See also Figure S2.
Figure 3
Figure 3. HNF4G binding maintains enhancer chromatin at binding sites
(A) Histograms (top) show the average normalized tag counts of HNF4G, FOXA1, H3K27Ac, H3K4me1 and AR ChIP-seq as well as ATAC-Seq in vehicle and doxycycline treated 22Rv1-HNF4Gsh2-Dox cells at HNF4G (blue) and AR (green) binding sites. Heatmap shows the tag densities of HNF4G, FOXA1, H3K27Ac, H3K4me1, AR and ATAC-signal at the top 1,000 HNF4G (middle) or AR (bottom, as internal control) binding sites upon vehicle or doxycycline treatment in 22Rv1-HNF4Gsh2-Dox cells. (B) ChIP-seq and ATAC-Seq profiles of HNF4G, FOXA1, H3K27Ac, and H3K4me1 at the HNF1A locus with or without HNF4G knockdown. Arrows indicate enhancers with HNF4G peaks and arrowheads indicate control enhancers without HNF4G peaks. Locus used for ChIP-qPCR is highlighted. (C) ChIP-re-ChIP showing co-binding of HNF4G and FOXA1 at select HNF4G/FOXA1 co-binding loci (HNF1A and RNASE4) as well as HNF4G non-occupied locus (KLK3) and a HNF4G and FOXA1 non-occupied locus (GPR20) as controls. First ChIP was performed in 22Rv1 cells with HNF4G and FOXA1antibodies and no antibody as a control. Sequential HNF4G and FOXA1 ChIP were then performed with eluates from 1st ChIP of FOXA1. Input is 0.1% for 1st ChIP, FOXA1 1st ChIP is 10% for subsequent 2nd ChIPs. (D) ChIP-qPCR of HNF4G and FOXA1 at selected HNF4G and FOXA1 co-binding loci (HNF1A and F5), HNF4G alone locus (MUC13) and FOXA1 alone locus (KLK3) in 22Rv1 cells. For each bar graph: left axis is fold enrichment over input for IgG, HNF4G ChIP and right axis is fold enrichment over input for FOXA1 ChIP Mean ± SD, n=3. (E) Bar graph of gene expression change by HNF4G knockdown (dox treatment of 22Rv1-HNF4Gsh2-Dox) or AR activation (DHT treatment of 22Rv1) of all genes (black), genes mapped to top 1,000 HNF4G peaks (blue) and top 1,000 AR peaks (green). Mean ± 95% confidence. Two-tailed unpaired t-test. See also Figure S3.
Figure 4
Figure 4. Exogenous HNF4G or HNF1A expression recapitulates the PCa-GI signature
(A) Immunoblots of indicated proteins in LNCaP cells transduced for stable expression of HNF4G, HNF1A or empty vector control against the indicated proteins. (B) qRT-PCR showing the expression of selected PCa-GI signature genes after exogenous expression of HNF4G and HNF1A in LNCaP cells. Data is presented as mean ± SD. (C, D) GSEA plot of PCa-GI signature in LNCaP cells exogenously expressing HNF4G (C) or HNF1A (D) compared to empty vector control. NES: normalized enrichment score. FDR: false discovery rate. See also Figure S4 and Table S5.
Figure 5
Figure 5. Exogenous HNF4G expression recapitulates chromatin landscape of endogenous HNF4G expression in 22Rv1
(A) Histograms (top) show the average normalized tag counts of HNF4G, FOXA1, H3K27Ac, H3K4me1, AR ChIP-seq and ATAC-signal in LNCaP cells with exogenous expression of HNF4G or vector control at top 1,000 HNF4G and AR binding sites. Heatmap shows the tag densities of HNF4G, FOXA1, H3K27Ac, H3K4me1, AR and ATAC-signal at the top 1,000 HNF4G (middle) or AR (bottom) binding sites. (B) Representative ChIP-seq and ATAC-Seq profiles of HNF4G, FOXA1, H3K27Ac, and H3K4me1 at HNF1A locus in LNCaP cells with or without exogenous HNF4G expression. Arrows indicate enhancers with HNF4G peaks and arrowheads indicate control enhancers without HNF4G peaks. Locus used for ChIP-qPCR is highlighted. (C) ChIP-qPCR of HNF4G and FOXA1 at select HNF4G and FOXA1 co-binding loci (HNF1A and F5) as well as HNF4G alone (MUC13) and FOXA1 alone (KLK3) loci in LNCaP cells. Mean ± SD, n=3. (D) Bar graph of gene expression change by HNF4G expression or AR activation (R1881 treatment) of all genes (black), genes mapped to top 1,000 HNF4G peaks (blue) and top 1,000 AR peaks (green) in LNCaP cells. Mean ± 95% confidence. Two-tailed unpaired t-test See also Figure S5.
Figure 6
Figure 6. HNF4G expression imparts resistance to androgen ablation and enzalutamide treatment in vitro and in vivo
(A) Number of colonies formed by LNCaP/AR cells with exogenous expression of HNF4G or vector control in media with full serum or stripped-serum. n=3, Mean ± SD. Two-tailed unpaired t-test. (B) Growth curve of LNCaP/AR cells exogenously expressing HNF4G or vector control cultured in media with stripped-serum. Arrows shows the time points at which cells were harvested for RNA. n=2, Mean ± SD.yhu (C) The sum Z-score of individual PCa-GI genes (mean ± SD) in LNCaP/AR cells expressing vector control at 9 days of growth in CSS media and HNF4G at day 9 and day 32 of growth in CSS media (top) and heatmap shows the expression of individual SPINK1 signature genes (bottom). n=2. (D) Treatment response of LNCaP/AR cells xenografts exogenously expressing HNF4G or vector control in SCID mice when treated with enzalutamide (10 mg/kg) or vehicle (1% carboxymethyl cellulose) once a day. For Vec-vehicle and Vec-enzalutamide n=4 and 13 respectively; for HNF4G-Veh and HNF4G-enzalutamide, n=4 and 18 respectively. Treatment was started when tumors reached a volume of approximately 400 mm3. Fold change in growth rate over day 0 (start of treatment) is shown. Mean ± SEM. Two-tailed unpaired t-test. (E) Box plot showing HNF4G mRNA levels of explanted xenografts at the end of the experiment. Box plots show median, quartiles, min and max, with each sample dot plotted. Statistical analysis was performed using two-tailed unpaired t-test. See also Figure S6 and Table S6
Figure 7
Figure 7. HNF4G overexpression is prevalent in CRPC
(A, B) HNF4G expression in normal prostate, primary prostate cancer, and CRPC from the WCMC (A) and the MSKCC (B) datasets. Mean ± 95% CI. (C) Quantification of HNF4G nuclear staining by immunohistochemistry (IHC) analysis on tissue microarrays (TMAs) of benign, primary prostate cancer (PCa) and castration-resistant prostate cancer (CRPC) from the WCMC cohort. (D) Representative images of HNF4G nuclear staining in benign, primary prostate cancer and CRPC tissue to show negative, weak and strong HNF4G staining respectively. Each scale bar is 100 μm. (E, F) Scatter plot showing correlation between HNF4G expression and PCa-GI signature sum (Z-score) in primary and CRPC cases from WCMC dataset (E) and MSKCC dataset (F). See also Figure S7.

Comment in

References

    1. Antonarakis ES, Lu C, Wang H, Luber B, Nakazawa M, Roeser JC, Chen Y, Mohammad TA, Chen Y, Fedor HL, et al. AR-V7 and resistance to enzalutamide and abiraterone in prostate cancer. The New England journal of medicine. 2014;371:1028–1038. - PMC - PubMed
    1. Arora VK, Schenkein E, Murali R, Subudhi SK, Wongvipat J, Balbas MD, Shah N, Cai L, Efstathiou E, Logothetis C, et al. Glucocorticoid receptor confers resistance to antiandrogens by bypassing androgen receptor blockade. Cell. 2013;155:1309–1322. - PMC - PubMed
    1. Balbas MD, Evans MJ, Hosfield DJ, Wongvipat J, Arora VK, Watson PA, Chen Y, Greene GL, Shen Y, Sawyers CL. Overcoming mutation-based resistance to antiandrogens with rational drug design. eLife. 2013;2:e00499. - PMC - PubMed
    1. Baraille F, Ayari S, Carriere V, Osinski C, Garbin K, Blondeau B, Guillemain G, Serradas P, Rousset M, Lacasa M, et al. Glucose Tolerance Is Improved in Mice Invalidated for the Nuclear Receptor HNF-4gamma: A Critical Role for Enteroendocrine Cell Lineage. Diabetes. 2015;64:2744–2756. - PubMed
    1. Bass AJ, Watanabe H, Mermel CH, Yu S, Perner S, Verhaak RG, Kim SY, Wardwell L, Tamayo P, Gat-Viks I, et al. SOX2 is an amplified lineage-survival oncogene in lung and esophageal squamous cell carcinomas. Nature genetics. 2009;41:1238–1242. - PMC - PubMed

MeSH terms

Substances