Clinical Trial
. 2017 Dec;4(12):e595-e606.
doi: 10.1016/S2352-3026(17)30208-9. Epub 2017 Nov 15.

Image-based ex-vivo drug screening for patients with aggressive haematological malignancies: interim results from a single-arm, open-label, pilot study

Affiliations
Clinical Trial

Image-based ex-vivo drug screening for patients with aggressive haematological malignancies: interim results from a single-arm, open-label, pilot study

Berend Snijder et al. Lancet Haematol. 2017 Dec.

Abstract

Background: Patients with refractory or relapsed haematological malignancies have few treatment options and short survival times. Identification of effective therapies with genomic-based precision medicine is hampered by intratumour heterogeneity and incomplete understanding of the contribution of various mutations within specific cancer phenotypes. Ex-vivo drug-response profiling in patient biopsies might aid effective treatment identification; however, proof of its clinical utility is limited.

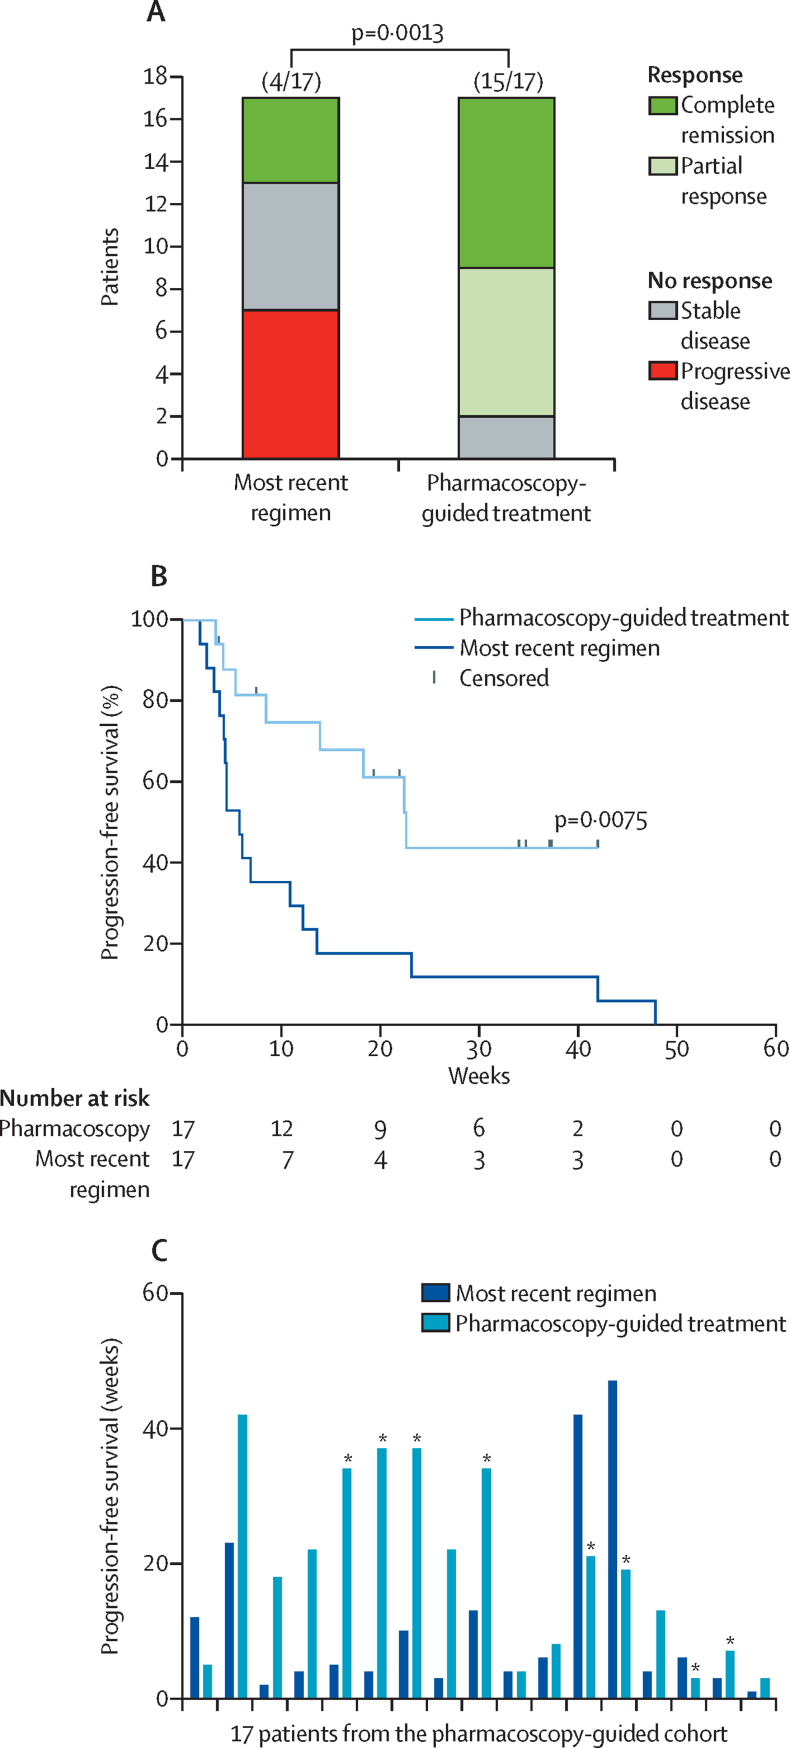
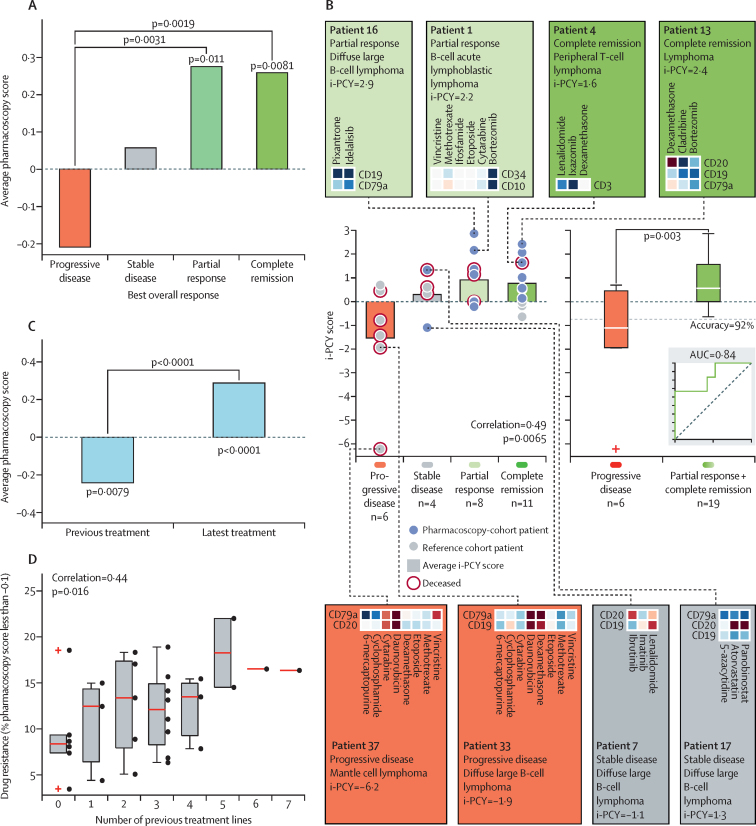
Methods: We investigated the feasibility and clinical impact of multiparametric, single-cell, drug-response profiling in patient biopsies by immunofluorescence, automated microscopy, and image analysis, an approach we call pharmacoscopy. First, the ability of pharmacoscopy to separate responders from non-responders was evaluated retrospectively for a cohort of 20 newly diagnosed and previously untreated patients with acute myeloid leukaemia. Next, 48 patients with aggressive haematological malignancies were prospectively evaluated for pharmacoscopy-guided treatment, of whom 17 could receive the treatment. The primary endpoint was progression-free survival in pharmacoscopy-treated patients, as compared with their own progression-free survival for the most recent regimen on which they had progressive disease. This trial is ongoing and registered with ClinicalTrials.gov, number NCT03096821.

Findings: Pharmacoscopy retrospectively predicted the clinical response of 20 acute myeloid leukaemia patients to initial therapy with 88·1% accuracy. In this interim analysis, 15 (88%) of 17 patients receiving pharmacoscopy-guided treatment had an overall response compared with four (24%) of 17 patients with their most recent regimen (odds ratio 24·38 [95% CI 3·99-125·4], p=0·0013). 12 (71%) of 17 patients had a progression-free survival ratio of 1·3 or higher, and median progression-free survival increased by four times, from 5·7 (95% CI 4·1-12·1) weeks to 22·6 (7·4-34·0) weeks (hazard ratio 3·14 [95% CI 1·37-7·22], p=0·0075).

Interpretation: Routine clinical integration of pharmacoscopy for treatment selection is technically feasible, and led to improved treatment of patients with aggressive refractory haematological malignancies in an initial patient cohort, warranting further investigation.

Funding: Austrian Academy of Sciences; European Research Council; Austrian Science Fund; Austrian Federal Ministry of Science, Research and Economy; National Foundation for Research, Technology and Development; Anniversary Fund of the Austrian National Bank; MPN Research Foundation; European Molecular Biology Organization; and Swiss National Science Foundation.


Figures

Figure 1
Figure 1
Pharmacoscopy and response to first-line acute myeloid leukaemia therapy (A) Schematic overview of the retrospective analysis using biobanked bone marrow samples of 20 patients with acute myeloid leukaemia taken before first-line treatment. (B) Comparison of two cell-death readouts: count of cells without activated caspase-3 and count of non-fragmented nuclei. Dots represent values from individual wells, for drug-screen results aggregated from three different patient samples. (C) Heatmap of the DMSO-relative fraction of CD34+ CD117+ blasts (C), and total cell number relative to DMSO (E), averaged for the non-responders and complete remission patient groups. Comparison of the DMSO-relative fraction of CD34+ KIT+ blasts (D) and total cell number (F) for the non-responders and complete remission groups, plotted as function of increasing concentrations of daunorubicin. Data are mean (SE) of patients. p values are for one-sided t test testing for reductions in complete remission group compared to non-responders. (G) Surface plot indicating the ideal separating hyperplane between the complete remission and non-responders groups. The drug space of 25 columns and five rows represents the same drug space as shown in (C) and (E). (H) Integrated RBF response scores per patient. Boxplots show distributions, dots are values for individual patients; crosses indicate datapoints that do not fall between the whiskers. (I) Cross-validation accuracies for integrated response scores for different cellular drug response readouts. (J) Average ROC curves over all cross-validation runs for different cell death readouts. AUROC values are indicated. (C–F) Assays done in technical quadruplicates for each of the 20 patient bone marrow samples. (I–J) Averaged classification results over 2025 cross-validation runs. AUROC=average area under ROC curve. DMSO=dimethyl sulfoxide. ROC=receiver operating characteristics.
Figure 2
Figure 2
Study outline and representative responses to pharmacoscopy-guided treatments (A) Outline of the workflow of this study, including patient numbers (n) and reasons for patient dropping out of the study. (B) Comparison of percentage of marker-positive cells identified by flow cytometry-based diagnostic pathology in the clinic and by automated microscopy and single-cell image analysis in patients for which both datasets were available. (C–F) RBFs for all screened drugs for selected case studies of patients, with corresponding patient numbers, diagnoses, and used blast marker indicated. Bar graphs show drugs ranked by average RBF, indicating significant (dark grey) and non-significant (light grey) RBFs; values of RBF>1·2 are capped at 1·2. Horizontal line at value 1 indicates DMSO-control levels. Table showing top-hit drug names, ranks, RBF, and p values (two-tailed t test against controls); yellow highlights indicate selected drugs provided during pharmacoscopy-guided treatment. (G–J) PET-CT or PET-MRT scans corresponding to the patients described in (A–D), at the time of last relapse (before) and after pharmacoscopy-guided treatments (after). White outlined boxes indicate tumour foci. NS=not significant. RBF=relative blast fractions.
Figure 3
Figure 3
Overall response and progression-free survival with pharmacoscopy-guided treatment (A) Comparison of overall response with the most recent regimen and of pharmacoscopy-guided treatments for 17 patients with aggressive haematological malignancies. p value was calculated by McNemar's test for paired binomial data. (B) Kaplan-Meier plot showing progression-free survival with the most recent regimen and pharmacoscopy-guided treatments for 17 patients. (C) Progression-free survival with most recent regimen or pharmacoscopy-guided treatment per patient. *Ongoing response at time of analysis.
Figure 4
Figure 4
Pharmacoscopy and therapeutic response (A) Average pharmacoscopy scores in all patients per best overall response reveal negative scores associated with progressive disease. (B) i-PCY score per patient by best overall response in 29 patients. Individual dots correspond to individual patients. Bars show average i-PCY scores by overall response. Box and whisker plots show i-PCY scores for progressive disease and partial response and complete remission responses. Inset shows the corresponding ROC curve. Coloured boxes show pharmacoscopy data for all markers and drugs for selected patient; heat map colours range from dark red (iPCY<–1) to white (iPCY=0) to dark blue (PCY>1), see also the legend in the appendix (p 5). i-PCY=integrated pharmacoscopy. (C) Average pharmacoscopy scores. p values directly above bars indicate significant deviation from 0; p values of pairwise comparisons are indicated by corresponding connecting lines (A, C). (D) Box and whisker plots of the tested drugs to which ex-vivo resistance is observed by pharmacoscopy per number of previous treatment lines in 29 patients. Individual patient values are plotted as black dots next to the boxplots. ROC=receiver operating characteristics. Crosses indicate datapoints that do not fall between the whiskers.

Comment in

References

    1. Khwaja A, Bjorkholm M, Gale RE. Acute myeloid leukaemia. Nat Rev Dis Primers. 2016;2:16010. - PubMed
    1. Hood L, Friend SH. Predictive, personalized, preventive, participatory (P4) cancer medicine. Nat Rev Clin Oncol. 2011;8:184–187. - PubMed
    1. Tsimberidou AM, Wen S, Hong DS. Personalized medicine for patients with advanced cancer in the phase I program at MD Anderson: validation and landmark analyses. Clin Cancer Res. 2014;20:4827–4836. - PMC - PubMed
    1. Von Hoff DD, Stephenson JJ, Jr, Rosen P. Pilot study using molecular profiling of patients' tumors to find potential targets and select treatments for their refractory cancers. J Clin Oncol. 2010;28:4877–4883. - PubMed
    1. Le Tourneau C, Delord JP, Goncalves A. Molecularly targeted therapy based on tumour molecular profiling versus conventional therapy for advanced cancer (SHIVA): a multicentre, open-label, proof-of-concept, randomised, controlled phase 2 trial. Lancet Oncol. 2015;16:1324–1334. - PubMed

Publication types

MeSH terms

Associated data