. 2017 Dec 12;9(6):1885-1897.
doi: 10.1016/j.stemcr.2017.10.016. Epub 2017 Nov 16.

PSEN1 Mutant iPSC-Derived Model Reveals Severe Astrocyte Pathology in Alzheimer's Disease

Affiliations

PSEN1 Mutant iPSC-Derived Model Reveals Severe Astrocyte Pathology in Alzheimer's Disease

Minna Oksanen et al. Stem Cell Reports. .

Abstract

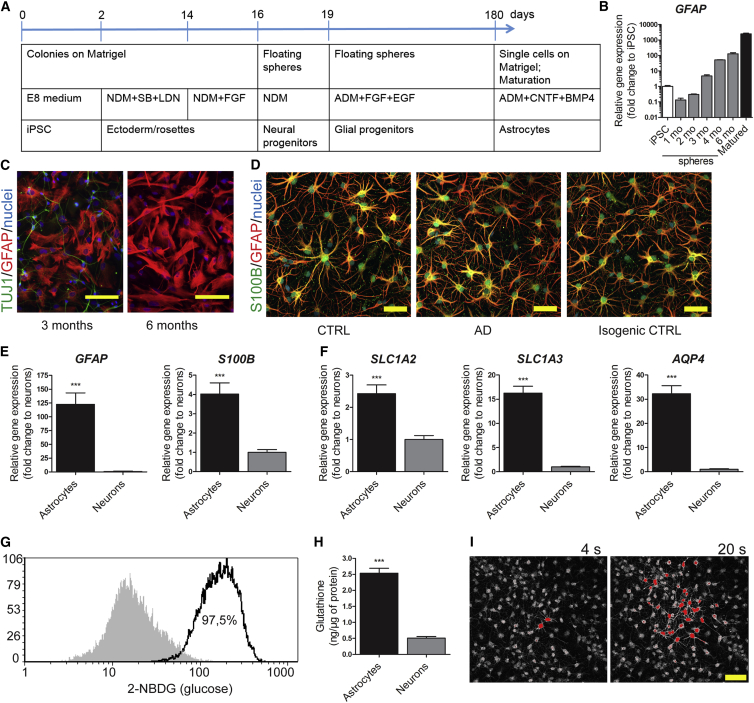
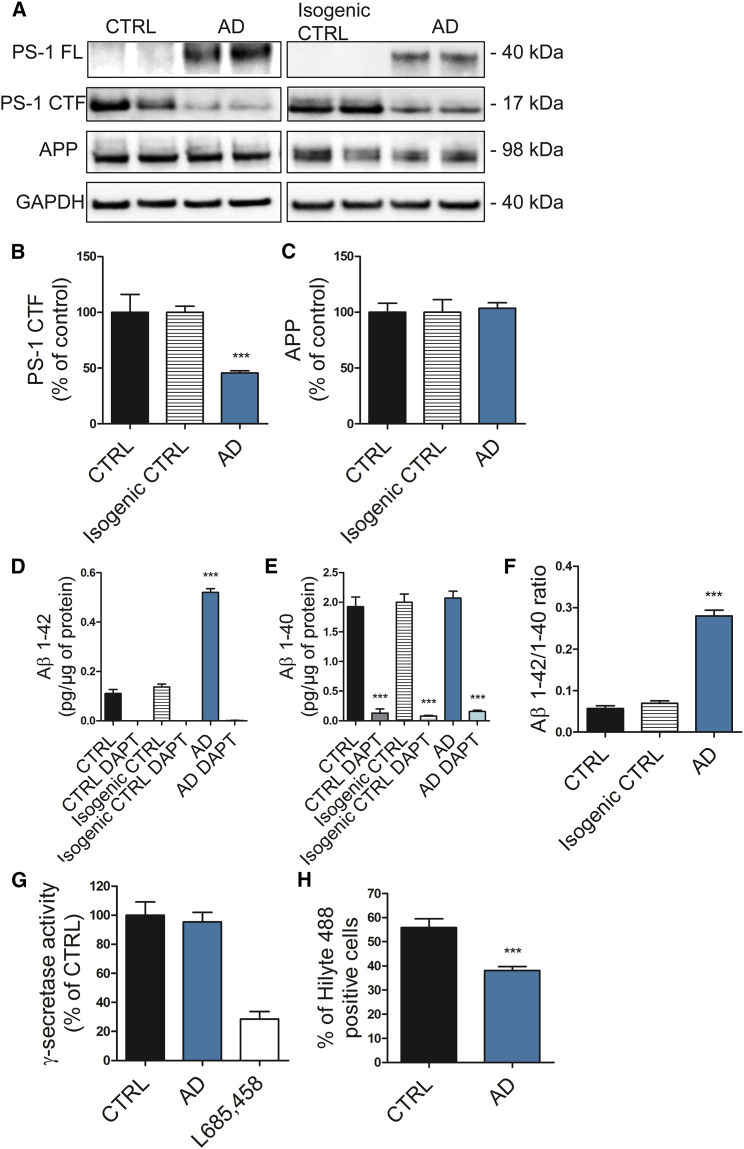
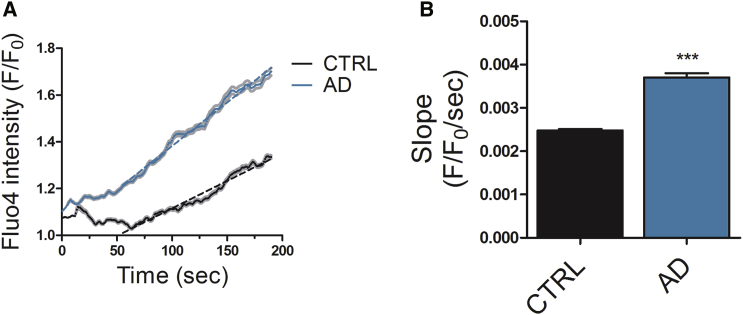
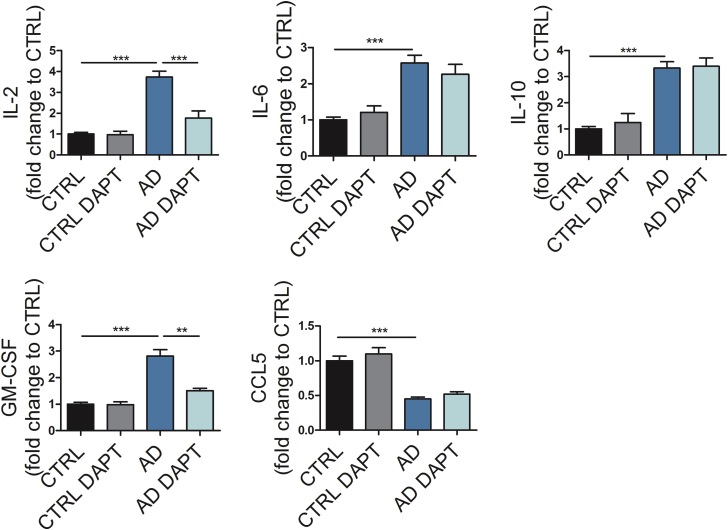
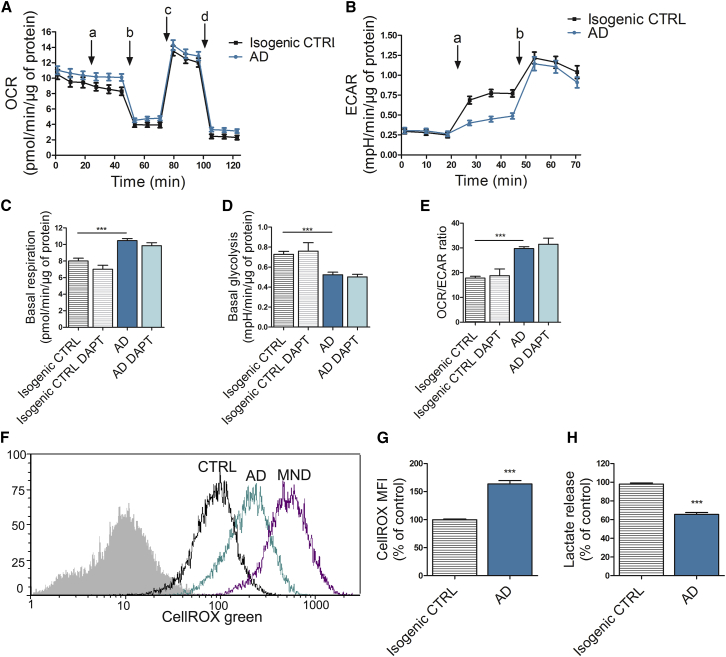
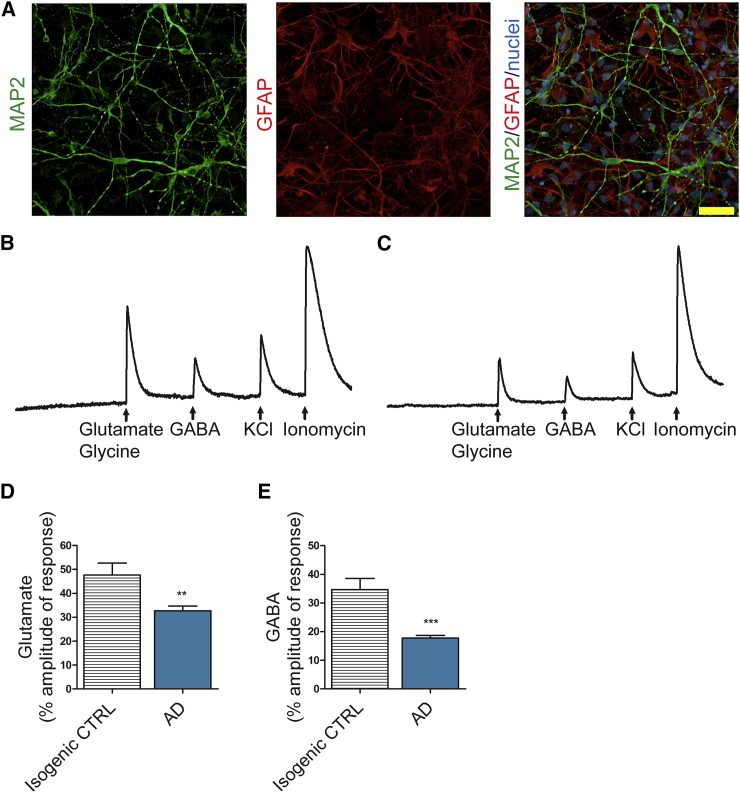
Alzheimer's disease (AD) is a common neurodegenerative disorder and the leading cause of cognitive impairment. Due to insufficient understanding of the disease mechanisms, there are no efficient therapies for AD. Most studies have focused on neuronal cells, but astrocytes have also been suggested to contribute to AD pathology. We describe here the generation of functional astrocytes from induced pluripotent stem cells (iPSCs) derived from AD patients with PSEN1 ΔE9 mutation, as well as healthy and gene-corrected isogenic controls. AD astrocytes manifest hallmarks of disease pathology, including increased β-amyloid production, altered cytokine release, and dysregulated Ca2+ homeostasis. Furthermore, due to altered metabolism, AD astrocytes show increased oxidative stress and reduced lactate secretion, as well as compromised neuronal supportive function, as evidenced by altering Ca2+ transients in healthy neurons. Our results reveal an important role for astrocytes in AD pathology and highlight the strength of iPSC-derived models for brain diseases.

Keywords: calcium homeostasis; cytokine release; lactate secretion; mitochondrial metabolism; oxidative stress; β-amyloid production.


Figures

Figure 1
Figure 1
Differentiation and Characterization of iPSC-Derived Astrocytes (A) Schematic illustrating the astrocyte differentiation protocol. NDM, neural differentiation medium; SB, SB431542; LDN, LDN193189; ADM, astrocyte differentiation medium. (B) Relative gene expression of GFAP during astrocytic differentiation shown as fold change to iPSCs. Representative data from three independent differentiations. (C) Representative immunocytochemistry images of cells dissociated from 3- or 6-month-old spheres stained for TUJ1 (green) and GFAP (red). Nuclei are stained with Hoechst. Scale bars, 100 μm. (D) Representative immunocytochemistry images of astrocytes from control, AD, and isogenic control lines matured with CNTF and BMP4 for 7 days, stained for S100β (green) and GFAP (red). Nuclei are stained with Hoechst. Scale bars, 50 μm. (E) Relative gene expression levels of GFAP and S100B in astrocytes shown as fold change to iPSC-derived neurons (astrocytes, n = 14 lines; neurons, n = 5 lines; ∗∗∗p < 0.001). (F) Relative gene expression levels of SLC1A2, SLC1A3, and AQP4 in astrocytes shown as fold change to iPSC-derived neurons (astrocytes, n = 14 lines; neurons, n = 5 lines; ∗∗∗p < 0.001). (G) Representative FACS histogram of glucose uptake analyzed by fluorescent glucose analog. Gray area shows untreated cells and the black line shows cells incubated with 2-NBDG; 97.5% of the cells were positive for 2-NBDG after 30 min of incubation. (H) Glutathione secreted to media (astrocytes, n = 14 lines; neurons, n = 5 lines; ∗∗∗p < 0.001). (I) Propagation of intercellular calcium waves. Representative images of Fluo4-loaded cells are shown 4 and 20 s after electrical stimulation. Scale bar, 50 μm. All data are presented as mean ± SEM. See also Figures S1–S3.
Figure 2
Figure 2
AD Astrocytes Present Hallmarks of β-Amyloid Pathology (A) Representative western blot images of the endoproteolysis of PS-1 in astrocytes. PS-1 FL was not detected in control and isogenic control samples. GAPDH was used as loading control. PS-1 FL, full-length PS-1; PS-1 CTF, C-terminal fragment of PS-1. (B and C) Quantification of PS-1 CTF (B) and APP (C) levels. Results normalized against GAPDH and shown as percentage of control (CTRL, n = 6 lines; isogenic CTRL, n = 4 replicates from 2 lines; AD, n = 6 lines; ∗∗∗p < 0.001). (D–F) Aβ1–42 (D), Aβ1–40 (E), and Aβ1–42/1–40 ratio (F) were quantified from media with or without γ-secretase inhibitor DAPT and normalized to total protein content. Three independent experiments (CTRL, n = 6 lines; isogenic CTRL, n = 4 replicates from 2 lines; AD, n = 6 lines; ∗∗∗p < 0.001). (G) γ-Secretase activity shown as percentage of control. γ-Secretase inhibitor L685,458 was added to validate the assay (CTRL, n = 6 lines; AD, n = 6 lines; GSI-treated, n = 2 lines). (H) Percentage of cells positive for HiLyte 488-labeled Aβ1–42 representing Aβ uptake quantified by FACS. Three independent experiments (CTRL, n = 6 lines; AD, n = 6 lines; ∗∗∗p < 0.001). All data are presented as mean ± SEM. See also Figures S1 and S4.
Figure 3
Figure 3
Ca2+ Homeostasis Is Disturbed in AD Astrocytes (A) Dynamics of Ca2+ leakage from the ER in the presence of 50 μM ryanodine, 100 μM 2APB, and 1 μM thapsigargin. Solid lines represent average traces with SEM (in gray) and dotted lines the linear fit for slope measurement. Representative traces from one control and one AD line are shown. (B) Quantification of the rate of Ca2+ leakage (slope) from the linear range of the traces. Data are presented as mean ± SEM from three independent experiments (CTRL, n = 814 cells; AD, n = 540 cells; ∗∗∗p < 0.001). See also Figure S5.
Figure 4
Figure 4
AD Astrocytes Show Altered Cytokine Release in Pro-inflammatory Conditions Concentrations of IL-2, IL-6, IL-10, GM-CSF, and CCL5 were quantified from media after stimulation with TNFα (50 ng/mL) and IL-1β (10 ng/mL) for 48 hr with CBA assay. Results are shown as fold change to control lines. DAPT: cells were treated with γ-secretase inhibitor DAPT simultaneously with TNFα and IL-1β stimulation. Data are presented as mean ± SEM from three independent experiments (CTRL, n = 6 lines; AD, n = 6 lines; ∗∗p < 0.01, ∗∗∗p < 0.001). See also Figure S3.
Figure 5
Figure 5
Altered Mitochondrial Metabolism in AD Astrocytes Leads to Increased ROS Production and Reduced Lactate Secretion (A) Oxygen consumption rate (OCR) following sequential additions of 10 μM glucose (a), 1 μM oligomycin (b), 1 μM FCCP (c), and 1 μM antimycin A and rotenone (d). Results are normalized to protein content. Three independent experiments (n = 30 replicates/group from 2 isogenic pairs). (B) Extracellular acidification rate following sequential additions of 10 μM glucose (a) and 1 μM oligomycin (b). Results are normalized to protein content. Three independent experiments (n = 30 replicates/group from 2 isogenic pairs). (C–E) Basal respiration (C) and basal glycolysis (D) were quantified after glucose addition from OCR and ECAR curves, respectively. The OCR/ECAR ratio (E) was calculated after glucose addition to determine the metabolic profile of astrocytes. DAPT: cells were treated with γ-secretase inhibitor DAPT before experiments. ∗∗∗p < 0.001. (F) Representative median fluorescent intensity FACS histograms from CellROX analysis. Non-stained cells are shown in gray, isogenic control cells in black, and AD cells in turquoise. Menadione (MND)-treated cells (violet) were used as a positive control. (G) Quantification of ROS production with CellROX green probe showing median fluorescent intensities (MFI) as a percentage of control group. Three independent experiments (n = 25–30 replicates/group from 2 isogenic pairs; ∗∗∗p < 0.001). (H) Lactate release was quantified from media with an enzymatic assay and normalized to protein content. Three independent experiments (n = 30 replicates/group from 2 isogenic pairs; ∗∗∗p < 0.001). All data are presented as mean ± SEM. See also Figure S1.
Figure 6
Figure 6
AD Astrocytes Influence the Calcium Signaling Activity of Healthy Neurons (A) Representative immunocytochemistry image of the thin-layer Matrigel co-culture with MAP2-positive neurons (green) and GFAP-positive astrocytes (red). Nuclei are stained with Hoechst. Scale bar, 50 μm. (B) Representative electrogram of isogenic control neurons co-cultured with isogenic control astrocytes showing Ca2+ amplitudes in response to applications of glutamate and glycine, GABA, KCl, and ionomycin. (C) Representative electrogram of isogenic control neurons co-cultured with AD astrocytes showing Ca2+ amplitudes in response to applications of glutamate and glycine, GABA, KCl, and ionomycin. (D) Quantification of the Ca2+ amplitudes in response to glutamate and glycine application. The x axis shows the genotype of the astrocytes (isogenic CTRL, n = 35 cells; AD, n = 134 cells from 3 independent experiments with 2 isogenic pairs; ∗∗p < 0.01). (E) Quantification of the Ca2+ amplitudes in response to GABA application. The x axis shows the genotype of the astrocytes (isogenic CTRL, n = 27 cells; AD, n = 132 cells from 3 independent experiments with 2 isogenic pairs; ∗∗∗p < 0.001). Data are presented as mean ± SEM. See also Figure S1.

Similar articles

Cited by

References

    1. Beal M.F. Oxidative damage as an early marker of Alzheimer's disease and mild cognitive impairment. Neurobiol. Aging. 2005;26:585–586. - PubMed
    1. Belanger M., Allaman I., Magistretti P.J. Brain energy metabolism: focus on astrocyte-neuron metabolic cooperation. Cell Metab. 2011;14:724–738. - PubMed
    1. Berridge M.J. Calcium signalling and Alzheimer's disease. Neurochem. Res. 2011;36:1149–1156. - PubMed
    1. Bezprozvanny I., Mattson M.P. Neuronal calcium mishandling and the pathogenesis of Alzheimer's disease. Trends Neurosci. 2008;31:454–463. - PMC - PubMed
    1. Birch A.M. The contribution of astrocytes to Alzheimer's disease. Biochem. Soc. Trans. 2014;42:1316–1320. - PubMed

Publication types

MeSH terms