. 2018 Feb 22;37(8):1107-1118.
doi: 10.1038/onc.2017.404. Epub 2017 Nov 20.

Secretion-mediated STAT3 activation promotes self-renewal of glioma stem-like cells during hypoxia

Affiliations

Secretion-mediated STAT3 activation promotes self-renewal of glioma stem-like cells during hypoxia

D A Almiron Bonnin et al. Oncogene. .

Abstract

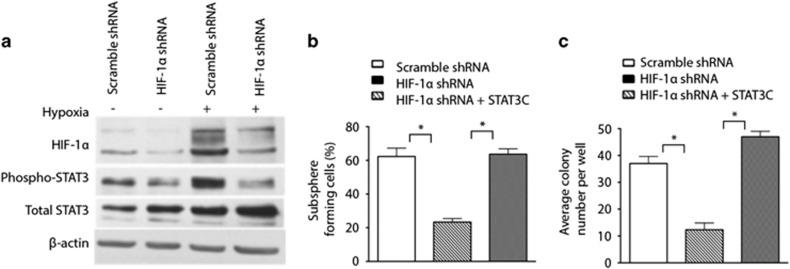
High-grade gliomas (HGGs) include the most common and the most aggressive primary brain tumor of adults and children. Despite multimodality treatment, most high-grade gliomas eventually recur and are ultimately incurable. Several studies suggest that the initiation, progression, and recurrence of gliomas are driven, at least partly, by cancer stem-like cells. A defining characteristic of these cancer stem-like cells is their capacity to self-renew. We have identified a hypoxia-induced pathway that utilizes the Hypoxia Inducible Factor 1α (HIF-1α) transcription factor and the JAK1/2-STAT3 (Janus Kinase 1/2 - Signal Transducer and Activator of Transcription 3) axis to enhance the self-renewal of glioma stem-like cells. Hypoxia is a commonly found pathologic feature of HGGs. Under hypoxic conditions, HIF-1α levels are greatly increased in glioma stem-like cells. Increased HIF-1α activates the JAK1/2-STAT3 axis and enhances tumor stem-like cell self-renewal. Our data further demonstrate the importance of Vascular Endothelial Growth Factor (VEGF) secretion for this pathway of hypoxia-mediated self-renewal. Brefeldin A and EHT-1864, agents that significantly inhibit VEGF secretion, decreased stem cell self-renewal, inhibited tumor growth, and increased the survival of mice allografted with S100β-v-erbB/p53-/- glioma stem-like cells. These agents also inhibit the expression of a hypoxia gene expression signature that is associated with decreased survival of HGG patients. These findings suggest that targeting the secretion of extracellular, autocrine/paracrine mediators of glioma stem-like cell self-renewal could potentially contribute to the treatment of HGGs.


Conflict of interest statement

The authors declare no conflict of interest.

Figures

Figure 1
Figure 1
HIF-1α and STAT3 phosphorylation enhances glioma self-renewal during hypoxia. (a) Effect of hypoxia on TSC1 and TSC2 tumor subsphere formation (7 days). Data points represent the percentage of plated cells that grew as spheres in three independent experiments conducted in triplicate and are presented as the mean±s.d. (*P<0.05). (b) Effect of hypoxia on TSC1 (left) and TSC2 (right) colony formation in soft agar (7 days). Data points represent three independent experiments conducted in triplicate and are presented as the mean±s.d. (*P<0.01). (c) Western blot analysis of HIF-1α, phospho-STAT3, and total STAT3 in TSC1 incubated in hypoxia. (d) Western blot analysis of HIF-1α, phospho-STAT3, and total STAT3 in TSC2 incubated in hypoxia. (e) Effect of shRNA HIF-1α expression on TSC1 tumor subsphere formation in hypoxia (7 days). Data points represent the percentage of plated cells that grew as spheres in three independent experiments conducted in triplicate and are presented as the mean±s.d. (*P<0.05). (f) Effect HIF-1α shRNA expression on TSC1 colony formation in soft agar during hypoxia (7 days). Data points represent three independent experiments conducted in triplicate and are presented as the mean±s.d. (*P<0.01). (g) Effect of S3I-201 (100 μM) treatment on TSC1 tumor subsphere formation in hypoxia (7 days). Data points represent the percentage of plated cells that grew as spheres in three independent experiments conducted in triplicate and are presented as the mean±s.d. (*P<0.05). (h) Effect of S3I-201 (100 μM) treatment on TSC1 colony formation in soft agar during hypoxia (7 days). Data points represent three independent experiments conducted in triplicate and are presented as the mean±s.d. (*P<0.01).
Figure 2
Figure 2
HIF-1α mediated STAT3 phosphorylation enhances glioma self-renewal. (a) Western blot analysis of HIF-1α, phospho-STAT3, and total STAT3 in TSC1 cells expressing scramble shRNA or HIF-1α shRNA and incubated in normoxia or hypoxia (16 h). (b) Rescue of TSC1 subsphere formation by STAT3C after inhibition of HIF-1α expression. Data points represent the percentage of plated cells that grew as spheres in three independent experiments conducted in triplicate and are presented as the mean±s.d. (*P<0.05). (c) Rescue of TSC1 colony formation in soft agar by STAT3C after inhibition of HIF-1α expression. Data points represent three independent experiments conducted in triplicate and are presented as the mean±s.d. (*P<0.05).
Figure 3
Figure 3
Secreted factors from hypoxic S100β-v-erbB/p53−/− spheroid cells promote STAT3 phosphorylation and enhance self-renewal. (a) Western blot analysis of phospho-STAT3 and total STAT3 in TSC1 cells cultured in NCM, HCM, or growth medium supplemented with OSM (50 ng/ml) (4h). (b) Effect of incubation in NCM or HCM on TSC1 and TSC2 subsphere formation cultured in normoxia (7 days). Data points represent the percentage of plated cells that grew as spheres in three independent experiments conducted in triplicate and are presented as the mean±s.d. (*P<0.01). (c) Effect of incubation in NCM or HCM on TSC1 and TSC2 colony formation in soft agar cultured in normoxia (7 days). Data points represent three independent experiments conducted in triplicate and are presented as the mean±s.d. (*P<0.01). (d) Quantitative RT-PCR analysis of mRNA expression of an array of known regulators of self-renewal in TSC1 incubated in fresh media (M) or HCM (4 h). Data points are from a representative experiment conducted in triplicate and are presented as the mean±s.d. (*P<0.05).
Figure 4
Figure 4
VEGF secreted by S100β-v-erbB/p53−/− tumor spheres during hypoxia increases STAT3 phosphorylation and enhances glioma self-renewal. (a) Luminex assay evaluation of VEGF secreted by TSC1 cells cultured under hypoxia (0 h, 8 h, 16 h). Data points are from a representative experiment conducted in triplicate and are presented as the mean±s.d. (*P<0.01). (b) Western blot analysis of phospho-STAT3 and total STAT3 in TSC1 cells cultured in NCM, NCM with bovine serum albumin (BSA) (2 μg/ml), NCM supplemented with recombinant VEGF protein (2 μg/ml), HCM, HCM supplemented with immunoglobulin G (IgG), or HCM depleted of VEGF (4h). (c) Effect of Ki8751 (1 μM) on TSC1 (left) and TSC2 (right) subsphere formation in HCM (7 days). Data points represent the percentage of plated cells that grew as spheres in three independent experiments conducted in triplicate and are presented as the mean±s.d. (*P<0.05). (d) Effect of Ki8751 (1 μM) on TSC1 (left) and TSC2 (right) colony formation in soft agar in HCM (7 days). Data points represent three independent experiments conducted in triplicate and are presented as the mean±s.d. (*P<0.05).
Figure 5
Figure 5
Pharmacological inhibition of secretion inhibits the increased tumor cell self-renewal induced by hypoxia. (a) Luminex assay evaluation of VEGF secreted by TSC1 cells cultured under hypoxia in the presence of BFA (0.1μM) or EHT-1864 (1 μM) (16h). Data points are from a representative experiment conducted in triplicate and are presented as the mean±s.d. (*P<0.001). (b) Effect of BFA (0.1μM), EHT-1864 (1 μM), BFA (0.1 μM) supplemented with VEGF (400pg) or EHT-1864 (1 μM) supplemented with VEGF (400 pg) on TSC1 subsphere formation in hypoxia (7 days). Data points represent the percentage of plated cells that grew as spheres in a representative experiment conducted in triplicate and are presented as the mean±s.d. (*P<0.01). (c) Effect of BFA (0.1 μM), EHT-1864 (1 μM), BFA (0.1 μM) supplemented with VEGF (400 pg), or EHT-1864 (1 μM) supplemented with VEGF (400pg) on TSC1 colony formation in soft agar during hypoxia (7 days). Data points are from a representative experiment conducted in triplicate and are presented as the mean±s.d. (*P<0.01). (d) Effect of BFA (0.1 μM) or EHT-1864 (1 μM) in the presence of HCM on TSC1 subsphere formation (7 days). Data points represent the percentage of plated cells that grew as spheres in a representative experiment conducted in triplicate and are presented as the mean±s.d. (*P<0.01). (e) Effect of BFA (0.1 μM) or EHT-1864 (1 μM) in the presence of HCM on TSC1 colony formation in soft agar (7 days). Data points are from a representative experiment conducted in triplicate and are presented as the mean±s.d. (*P<0.01).
Figure 6
Figure 6
BFA and EHT-1864 reduce VEGF secretion, slow tumor growth, and increase the survival of mice harboring S100β-v-erbB/p53−/− allografts. (a) Plasma VEGF levels of mice growing glioma tumor allografts treated either with vehicle (n=3), BFA (n=4), or EHT-1864 (n=4) (7 days). Data points are presented as the mean±s.d. (*P<0.001) (b) Gross appearance of tumors extracted 12 to 20 days after treatment initiation with vehicle (n=5), BFA (n=4), or EHT-1864 (n=4). (c) Estimated tumor volumes of S100β-v-erbB/p53−/− allografts treated with vehicle (n=8) or BFA (n=7). Dashed line indicates end of treatment. When comparing all vehicles against all BFA treated allografts, P<0.009. (d) Tumor volume of TSC1 allografts treated with vehicle (n=8) or EHT-1864 (n=7). Dashed line indicates end of treatment. When comparing all vehicles against all EHT-1864 treated allografts, P<0.0004. (e) Kaplan–Meier survival curve of mice that grew glioma tumor allografts and were treated either with vehicle (n=8), BFA (n=7), or EHT-1864 (n=7). Log-rank tests comparing the survival curves for vehicle control against those of BFA and EHT-184 yield P-values of 0.0056 and 0.0017, respectively.
Figure 7
Figure 7
BFA and EHT disrupt a glioma stem-like cell hypoxia signature associated with poor survival. (a) Heat map representation of the expression levels of the 19 genes conforming the glioma stem-like cell hypoxia signature in TSC1 cells treated with either DMSO, BFA (0.1 μM), or EHT-1864 (1 μM) grown in hypoxia or normoxia (16 h) as indicated in the figure. (b) Pie charts describing the Gene Ontology protein classes of the genes in a. (c) Pie charts describing the Gene Ontology pathways of the genes in a. (d) Kaplan–Meier survival curves comparing GBM patients with high hypoxia signature scores (H) and GBM patients with low hypoxia signature scores (L). Log-rank test comparing these survival curves has a P-value of 0.0109.

References

    1. Rosen JM, Jordan CT. The increasing complexity of the cancer stem cell paradigm. Science 2009; 324: 1670–1673. - PMC - PubMed
    1. Lapidot T, Sirard C, Vormoor J, Murdoch B, Hoang T, Caceres-Cortes J et al. A cell initiating human acute myeloid leukaemia after transplantation into SCID mice. Nature 1994; 367: 645–648. - PubMed
    1. Al-Hajj M, Wicha MS, Benito-Hernandez A, Morrison SJ, Clarke MF. Prospective identification of tumorigenic breast cancer cells. Proceedings of the National Academy of Sciences of the United States of AmericaProc Natl Acad Sci USA 2003; 100: 3983–3988. - PMC - PubMed
    1. Hemmati HD, Nakano I, Lazareff JA, Masterman-Smith M, Geschwind DH, Bronner-Fraser M et al. Cancerous stem cells can arise from pediatric brain tumors. Proceedings of the National Academy of Sciences of the United States of AmericaProc Natl Acad Sci USA 2003; 100: 15178–15183. - PMC - PubMed
    1. Singh SK, Clarke ID, Terasaki M, Bonn VE, Hawkins C, Squire J et al. Identification of a cancer stem cell in human brain tumors. Cancer ResearchCancer ResCancer Res 2003; 63: 5821. - PubMed

Publication types

MeSH terms