

Review
doi: 10.1021/acs.analchem.7b04733.
Epub 2017 Dec 13.
Mass Spectrometry Imaging: A Review of Emerging Advancements and Future Insights
Affiliations
- PMID: 29155564
- PMCID: PMC5959842
- DOI: 10.1021/acs.analchem.7b04733
Item in Clipboard
Review
Mass Spectrometry Imaging: A Review of Emerging Advancements and Future Insights
Anal Chem.
.
No abstract available
Conflict of interest statement
The authors declare no competing financial interest.
Figures
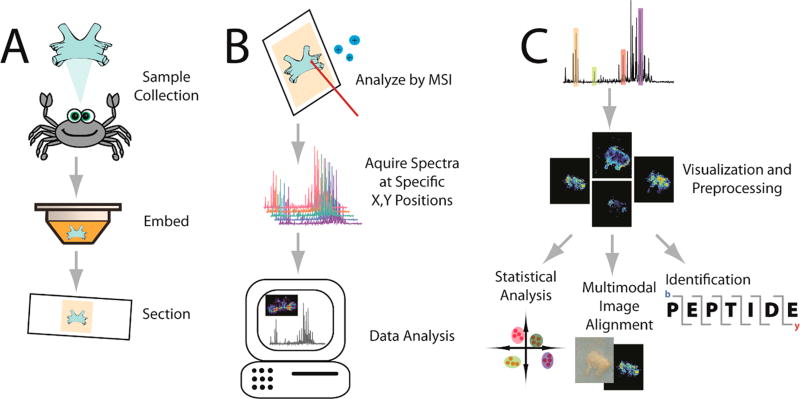
Visual workflow for the MSI analysis. A crustacean’s brain is used as an example tissue for this workflow. (A) Sample preparation. After collection from the animal, the sample is embedded in a supporting medium for sectioning onto slides. Other sample processing, such as applications of enzymes, matrix, or derivatization agents, may be performed depending on the molecular species of interest or the instrument being used. (B) Sample analysis. After acquiring a spectrum at each (x,y) grid point on the tissue, sophisticated software tools are used to process and visualize the data. A laser is used to ionize molecules as depicted, although several nonlaser based methods are also used. (C) Data processing. After preprocessing the data (e.g., baseline correction), the distribution of selected molecules can be visualized. From there, identification of the m/z values and statistical analysis between different images or image coregistration with other image modalities can occur.
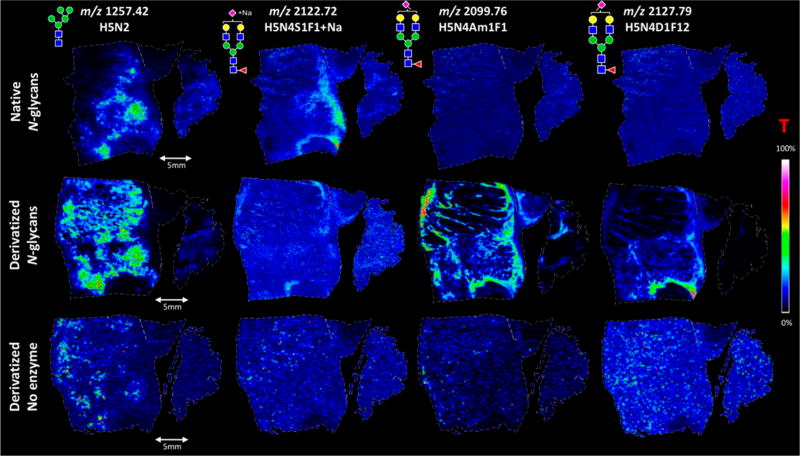
MSI comparison of digestion and derivatization of N-glycans in FFPE colon carcinoma sections. Different section preparations are shown in each row, while each column is a different N-glycan. Native N-glycans (e.g., digested) are shown in the first row. The second row shows the digested, derivatized samples. This in situ derivatization specifically targeted sialic acids by dimethylation and subsequent amidation. Finally, the last row shows a negative control sample where derivatization was performed but no digestion was done. Without a digestion step, N-glycans should not be available for analysis. On the basis of the results, it is clear that the derivatized, digested N-glycan (middle row) method produces the best extraction and ionization of N-glycans with sialic acids. Green circle, mannose; yellow circle, galactose; blue square, N-acetylglucosamine; yellow square, N-acetylgalactosamine; white square, N-acetylhexosamine; red triangle, fucose; purple diamond, N-acetylneuraminic acids; T, total ion current normalization. Reproduced from Holst, S.; Heijs, B.; Haan, N.; van Zeijl, R. J. M.; Briaire-de Bruijn, I. H.; van Pelt, G. W.; Mehta, A. S.; Angel, P. M.; Mesker, W. E.; Tollenaar, T. A.; Drake, R. R.; Bovee, J. V. M. G.; McDonnell, L. A.; Wuhrer, M. Analytical Chemistry
2016, 88 (11), 5904-5913 (ref 52). Copyright 2016 American Chemical Society.
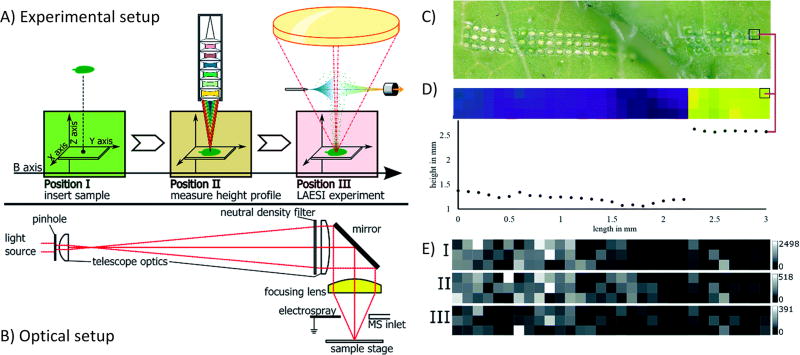
Overall setup and demonstration of capabilities of a LAESI source for samples with uneven surfaces. (A) Workflow representation of experimental setup related to the LAESI source, including sample insertion, measurement of height profile, and LAESI experiment for MS acquisition. (B) Schematic of the telescope optics implemented to focus the laser. (C) Optical image of R. sativus leaf after LAESI experiment, showing the laser ablation pattern. Note the even distance between ablation spots throughout sample despite uneven surface. (D) Topographical height profile of leaf surface along the ablation pattern, showing the change in height across the sample. The red line indicates identical positions on the sample surface. (E) MSI intensity maps of m/z values 418.051, 434.024, and 447.054, showing differences in spatial resolution. These m/z distributions were acquired in the same experiment as the topographical profile. Reproduced from Bartels, B.; Kulkarni, P.; Danz, N.; Bocker, S.; Saluz, H. P.; Svatos, A., RSC Advances
2017, 7 (15), 9045-9050 (ref 92), with permission (https://creativecommons.org/licenses/by/3.0/ ) of the Royal Society of Chemistry.
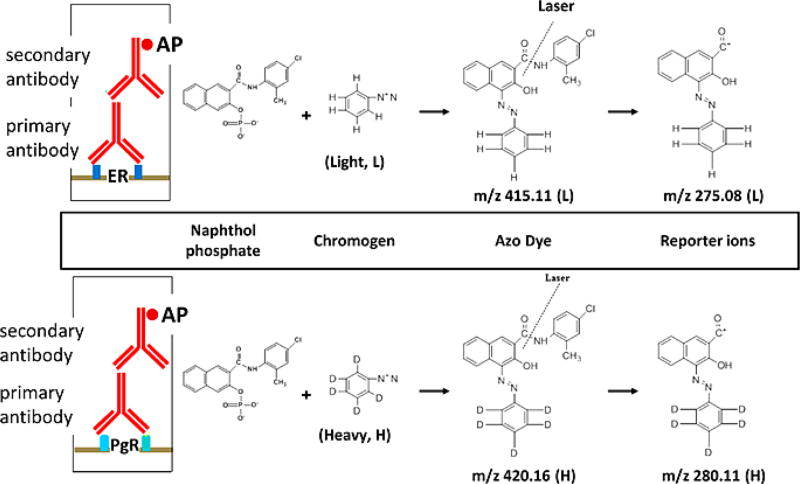
Schematic of the general working principle of SILMSI. After incubating the section with a primary antibody for the biomarker of interest, in this case PgR and ER, a secondary antibody is applied that is conjugated with alkaline phosphatase (AP). AP cleaves naphthol from naphthol phosphate. The naphthol mixes with the heavy or light chromagen to form an azo dye precipitate on the tissue. The incubation of the two antibodies can be done on the same tissue with proper washing. In the instrument, the azo dye absorbs energy from the laser, creating fragments including characteristic reporter ions. The heavy and light reporter ions are separated by 5 Da in the MS spectrum. Reproduced from Wang, H.; DeGnore, J. P.; Kelly, B. D.; True, J.; Garsha, K.; Bieniarz, C., A technique for relative quantitation of cancer biomarkers in formalin-fixed, paraffin-embedded (FFPE) tissue using stable-isotope-label based mass spectrometry imaging (SILMSI), J. Mass Spectrom., Vol. 50, Issue 9 (ref 100). Copyright 2015 Wiley.
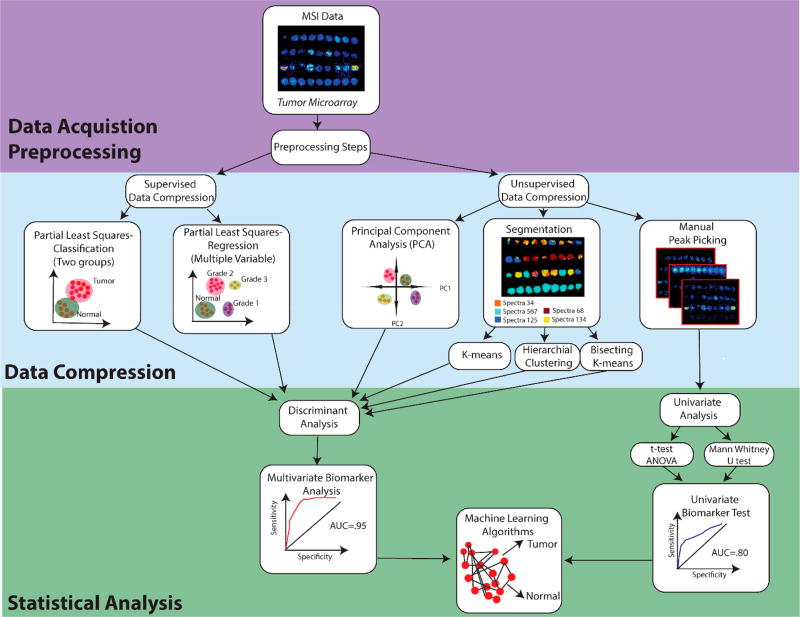
Workflow for data processing and data analysis for MSI data. Following data acquisition, MSI data are subjected to preprocessing including normalization, baseline compression, smoothing, and spectral recalibration. Next, data are compressed to reduce computational load for statistical analysis. This includes supervised data compression, where the groups are defined. If two groups are used, it is known as classification, or if more than two groups are used, linear regression is used for analysis. Data can also be compressed without preclassifying the data through unsupervised data compression. Here, we describe three main methods: principal component analysis, segmentation, and manual peak picking. Unsupervised data compression includes k-means, hierarchical clustering, and bisecting k-means. Following compression of multiple variables, discriminant analysis is used to evaluate how well the chosen classification system separates groups of data. Manual peak picking helps pull out a few m/z peaks of interest. Univariate analysis can be done using either a t test or ANOVA (Gaussian distribution) or Mann-Whitney U test (non-Gaussian distribution) to test for significance between groups of data. If the user is interested in biomarker discovery, a specific m/z or group of m/z values can be used to conduct a biomarker analysis, where an AUC value closer to 1 indicates a perfect predictive biomarker. Following biomarker analysis, machine learning algorithms can then be used to predict the classification of new data sets into the existing data classifications.
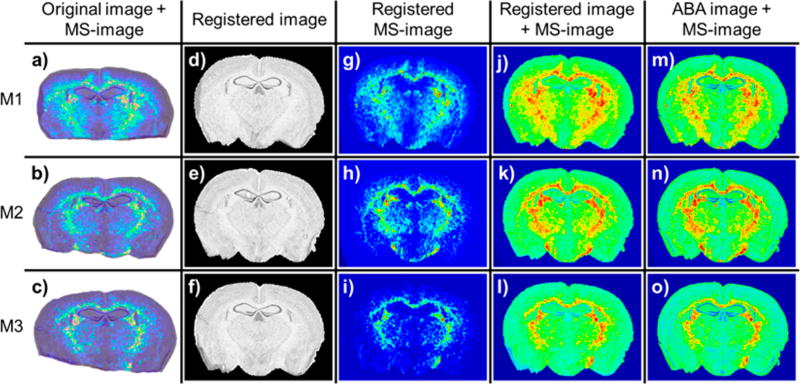
MSI acquired on a mouse brain is registered to corresponding histology and then to the Allen Brain Atlas (ABA) to understand where m/z values colocalize with anatomical brain regions. Shown here are three coronal sections from three different mouse brains (M1, M2, and M3) and their respective MSI images. (a, b, and c) Distribution of m/z 863 before preprocessing and registration. (d, e, and f) Samples after preprocessing and registration to histology, (g, h, and i) Distribution of m/z 863 after registration to histology, where histology image is removed. (j, k, and l) Registered images and registered MSI images are superimposed to display the visual distribution of ion m/z 863. (m, n, and o) Registered images with the MSI distribution are then registered again with the ABA. On the basis of the alignment, it appears that m/z 863 is expressed mainly in the striatum of the brain for these brain sections. Reproduced from Abdelmoula, W. M.; Carreira, R. J.; Shyti, R.; Balluff, B.; van Zeijl, R. J.; Tolner, E. A.; Lelieveldt, B. F.; van den Maagdenberg, A. M.; McDonnell, L. A.; Dijkstra, J. Analytical Chemistry
2014, 86 (8), 3947-3954 (ref 192). Copyright 2014 American Chemical Society.
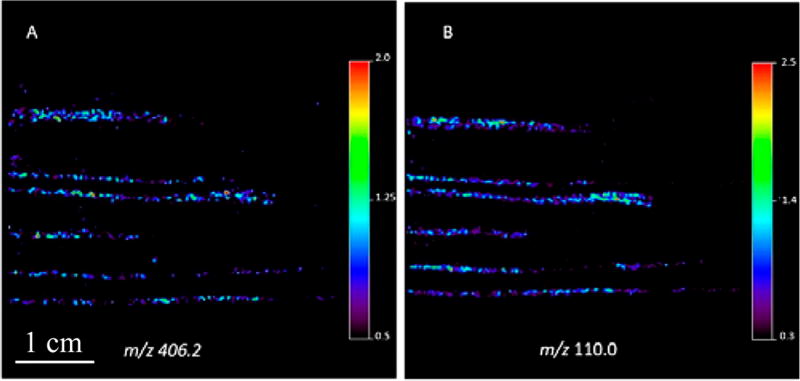
MALDI-MSI MS/MS was utilized to confidently identify THC drugs in single hair samples. (A) Parent ion images (m/z 406.2). (B) Characteristic fragment ion (m/z 110.0). The distributions match each other for all hair samples, indicating they belong to the same ion. Reproduced from Beasley, E.; Francese, S.; Bassindale, T. Analytical Chemistry
2016, 88 (20), 10328-10334 (ref 29). Copyright 2016 American Chemical Society.
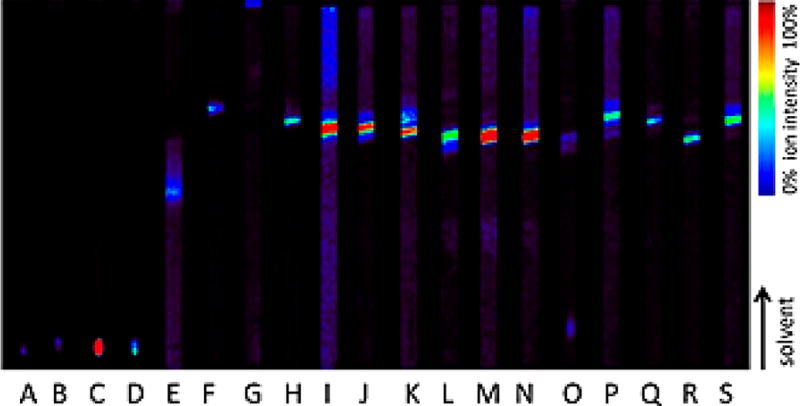
Extracted ion images from a positive ion mode DESI-MS imaged high-performance TLC plate, showing the separation of a variety of metabolic compounds. (A) m/z 138, (B) m/z 152, (C) m/z 166, (D) m/z 168, (E) m/z 261, (F) m/z 303, (G) m/z 373, (H) m/z 403, (I) m/z 433, (J) m/z 463, (K) m/z 579, (L) m/z 581, (M) m/z 609, (N) m/z 611, (O) m/z 625, (P) m/z 667, (Q) m/z 725, (R) m/z 741, (S) m/z 755. Reproduced from High-performance thin-layer chromatography/desorption electrospray ionization mass spectrometry imaging of the crude extract from the peels of Citrus aurantium L. (Rutaceae), Bagatela, B. S.; Lopes, A. P.; Cabral, E. C.; Perazzo, F. F.; Ifa, D. R., Rapid Commun. Mass Spectrom., Vol. 29, Issue 16 (ref 237). Copyright 2015 Wiley.
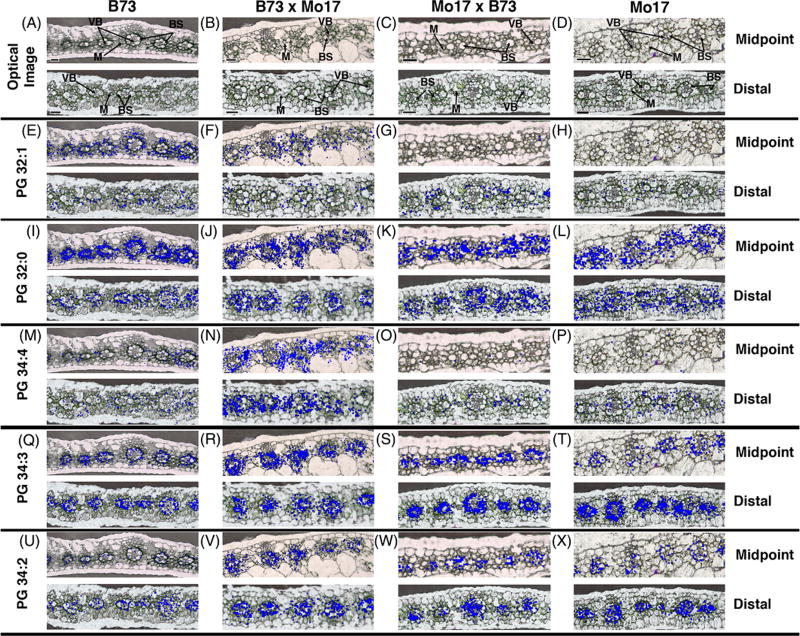
Demonstration of 5-µm, subcellular resolution MALDI-MS images for several lipid species (rows) overlaid on their optical image across four different genotypes of maize leaves (columns) at the midpoint and distal regions. The scale bar for the images is 50 µm for all images, and it is noted that the Mo17 and Mo17 × B73 have slightly larger scale bars. Reproduced from High spatial resolution mass spectrometry imaging reveals the genetically programmed, developmental modification of the distribution of thylakoid membrane lipids among individual cells of maize leaf, Duenas, M. E.; Klein, A. T.; Alexander, L. E.; Yandeau-Nelson, M. D.; Nikolau, B. J.; Lee, Y. J., Plant J., Vol. 89, Issue 4 (ref 224) Copyright 2017 Wiley.
References
Publication types
MeSH terms
Grants and funding
LinkOut - more resources
Full Text Sources
Other Literature Sources
