

fluEvidenceSynthesis: An R package for evidence synthesis based analysis of epidemiological outbreaks
- PMID: 29155812
- PMCID: PMC5714397
- DOI: 10.1371/journal.pcbi.1005838
fluEvidenceSynthesis: An R package for evidence synthesis based analysis of epidemiological outbreaks
Abstract
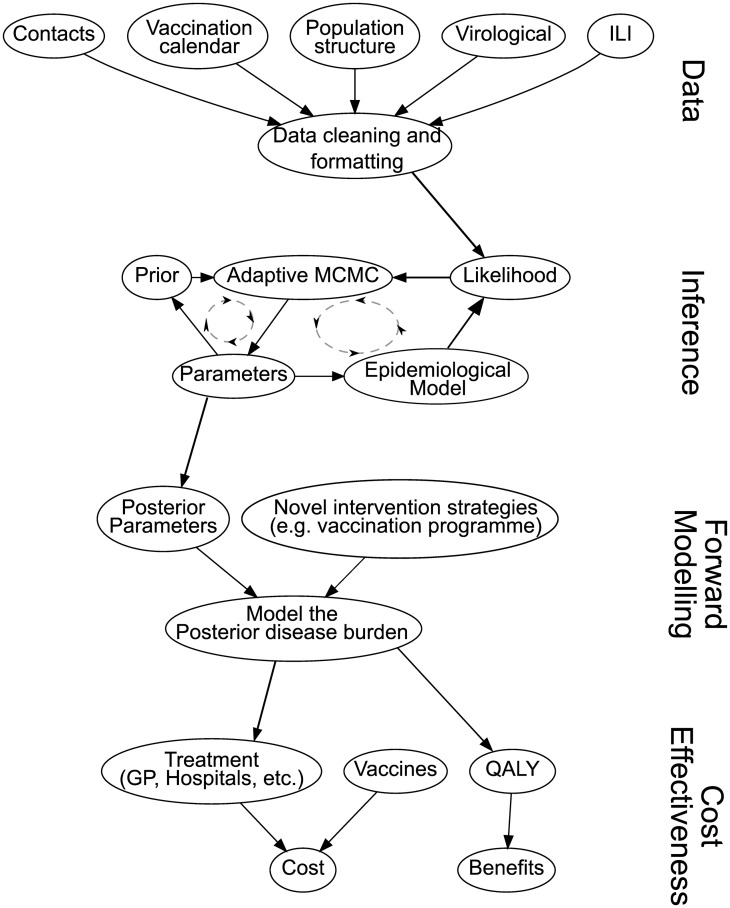
Public health related decisions often have to balance the cost of intervention strategies with the benefit of the reduction in disease burden. While the cost can often be inferred, forward modelling of the effect of different intervention options is complicated and disease specific. Here we introduce a package that is aimed to simplify this process. The package allows one to infer parameters using a Bayesian approach, perform forward modelling of the likely results of the proposed intervention and finally perform cost effectiveness analysis of the results. The package is based on a method previously used in the United Kingdom to inform vaccination strategies for influenza, with extensions to make it easily adaptable to other diseases and data sources.
Conflict of interest statement
The authors have declared that no competing interests exist.
Figures
References
-
- Aragon TJ. Epitools: Epidemiology Tools. R package version 0.5-7. 2012; Available: http://CRAN.R-project.org/package=epitools
-
- Carstensen B, Plummer M, Laara E, Hills M. Epi: A Package for Statistical Analysis in Epidemiology. R package version 2.0]. 2016; Available: http://CRAN.R-project.org/package=Epi
-
- Therneau TM. Survival: Survival Analysis. R package version 2.38-3. 2015; Available: http://CRAN.R-project.org/package=survival
-
- Merl D, Johnson L, Gramacy R, Mangel M. Amei: An R Package for the Adaptive Management of Epidemiological Interventions. Journal of Statistical Software. 2010;36: 1–32.
-
- Baguelin M, Hoek AJV, Jit M, Flasche S, White PJ, Edmunds WJ. Vaccination against pandemic influenza A/H1N1v in England: A real-time economic evaluation. Vaccine. 2010;28: 2370–2384. doi: 10.1016/j.vaccine.2010.01.002 - DOI - PubMed
MeSH terms
Substances
Grants and funding
LinkOut - more resources
Full Text Sources
Other Literature Sources
Medical
Molecular Biology Databases
