Case Reports
. 2018 Mar 1;110(3):316-320.
doi: 10.1093/jnci/djx213.

Immune Activation and Benefit From Avelumab in EBV-Positive Gastric Cancer

Affiliations
Case Reports

Immune Activation and Benefit From Avelumab in EBV-Positive Gastric Cancer

Anshuman Panda et al. J Natl Cancer Inst. .

Abstract

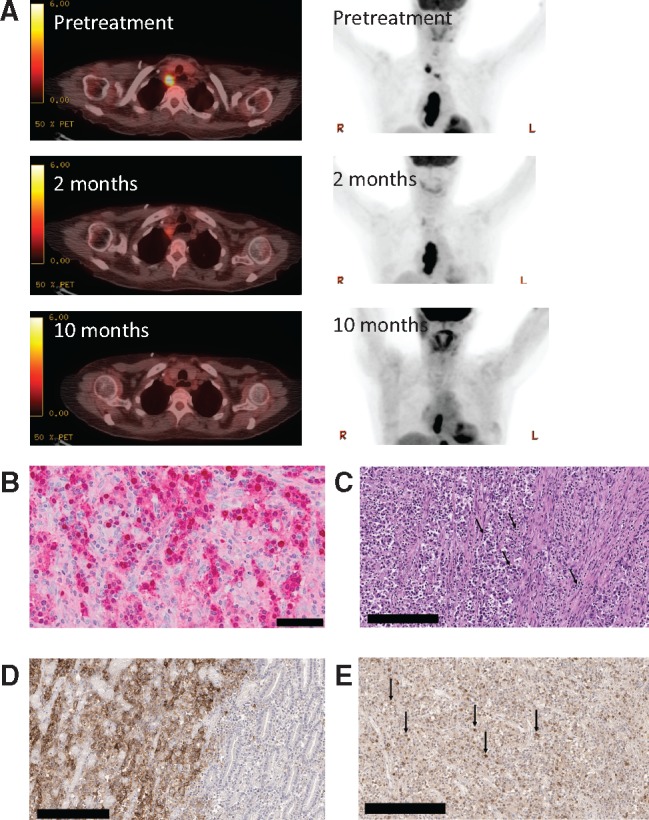
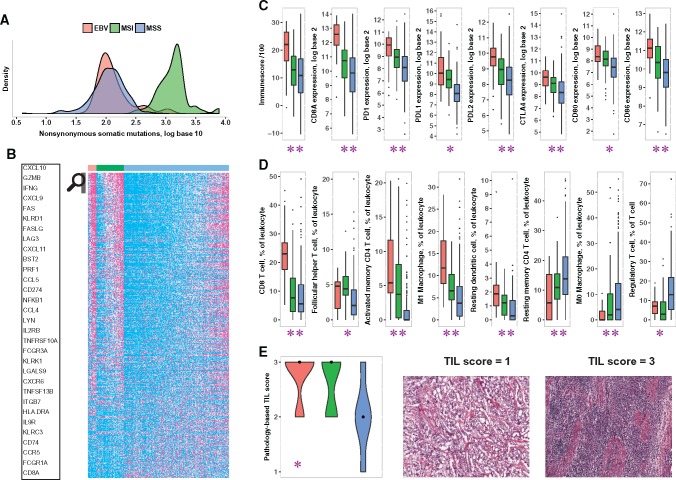
Response to immune checkpoint therapy can be associated with a high mutation burden, but other mechanisms are also likely to be important. We identified a patient with metastatic gastric cancer with meaningful clinical benefit from treatment with the anti-programmed death-ligand 1 (PD-L1) antibody avelumab. This tumor showed no evidence of high mutation burden or mismatch repair defect but was strongly positive for presence of Epstein-Barr virus (EBV) encoded RNA. Analysis of The Cancer Genome Atlas gastric cancer data (25 EBV+, 80 microsatellite-instable [MSI], 310 microsatellite-stable [MSS]) showed that EBV-positive tumors were MSS. Two-sided Wilcoxon rank-sum tests showed that: 1) EBV-positive tumors had low mutation burden (median = 2.07 vs 3.13 in log10 scale, P < 10-12) but stronger evidence of immune infiltration (median ImmuneScore 2212 vs 1295, P < 10-4; log2 fold-change of CD8A = 1.85, P < 10-6) compared with MSI tumors, and 2) EBV-positive tumors had higher expression of immune checkpoint pathway (PD-1, CTLA-4 pathway) genes in RNA-seq data (log2 fold-changes: PD-1 = 1.85, PD-L1 = 1.93, PD-L2 = 1.50, CTLA-4 = 1.31, CD80 = 0.89, CD86 = 1.31, P < 10-4 each), and higher lymphocytic infiltration by histology (median tumor-infiltrating lymphocyte score = 3 vs 2, P < .001) compared with MSS tumors. These data suggest that EBV-positive low-mutation burden gastric cancers are a subset of MSS gastric cancers that may respond to immune checkpoint therapy.


Figures

Figure 1.
Figure 1.
Histologic, radiologic, and genomic characteristics of a patient with Epstein-Barr virus (EBV)–positive gastric cancer responding to the anti–programmed death–ligand 1 (PD-L1) antibody therapy avelumab. A) Representative positron emission tomography–computerized tomography images taken prior to treatment with anti-PD-L1 antibody and two months and 10 months after initiation of therapy. B) Staining of primary tumor for EBV-encoded RNA (EBER) is shown in red. Normal gastric mucosa on the slide serves as an internal negative control (not shown). Scale bar = 50 μm. C) High-power image of the original gastric biopsy shows intense infiltrate of lymphocytes within the tumor (black arrows in the center) and associated stroma (black arrow to the right; hematoxylin and eosin ×400). Scale bar = 200 μm. D) Immunostaining of the gastric biopsy sample using the Ventana SP142 for PD-L1 antibody. Gastric adenocarcinoma with 100% staining of malignant cell in a membranous pattern (ie, only the peripheral cytoplasmic membrane stains for the marker and the nucleus and cytoplasm are unstained) for anti-PD-L1 (left portion of image). Bordering benign gastric mucosa shows complete absence of anti PD-L1 staining (right portion of image). The negative control omitting the anti-PD-L1 antibody showed no evidence of staining. Scale bar = 200 μm. E) Of the numerous tumor-infiltrating lymphocytes identified, 50% stain strongly positive for PD-1 expression (black arrows) using the OriGene PD-1 UltraMAB antibody. Scale bar = 200 μm.
Figure 2.
Figure 2.
Comparison of immune markers and mutation burden in Epstein-Barr virus (EBV)–positive (red), microsatellite-instable (MSI; green), and microsatellite-stable (MSS; blue) tumors of The Cancer Genome Atlas (TCGA) gastric cancer cohort. The results shown here are in whole or part based upon data generated by the TCGA Research Network: http://cancergenome.nih.gov/. A) Distribution of nonsynonymous somatic mutation burden (in log10 scale) in the three classes. B) Expression (percentile) of immune-related genes differentially expressed (false discovery rate < 0.01, two-sided Wilcoxon rank-sum test with Benjamini-Hochberg correction) between the three classes pairwise. For each gene, samples with expression level in the bottom half (0%–50%) are colored cyan, those in the top quartile (75%–100%) are colored magenta, and the rest (50%–75%) are colored white. The genes in the heat map were sorted in descending order for the quantity x = (mean expression in EBV+ - mean expression in MSS) + (mean expression in MSI - mean expression in MSS). The names of a few genes with the highest x values are highlighted. The complete data used in the figure are in Supplementary Table 2 (available online). C) Expression of immune checkpoint genes PDCD1 (“PD-1”) and CTLA-4, their ligands, T cell marker CD8A, and overall immune infiltration (“ImmuneScore”) in the three classes. D) Level of CD8+ T cells, follicular helper T cells, activated and resting memory CD4 T cells, M1 and M0 polarized macrophages, and resting dendritic cells as a fraction of infiltrating leukocytes, as well as proportion of regulatory T cells (Tregs) among all T cells, in the three classes. All pairwise P values are shown in Supplementary Table 1 (available online). E) Pathology-based Lymphocyte Infiltration Scores in the three classes on a 1 (low) to 3 (high) scale, as represented in the images to the right. These images have no scale bar because they were obtained from the TCGA Digital Slide Archive, which provided no scale (21). In (C–E), ** means EBV+ values are statistically significantly different from both MSI and MSS, and * means EBV+ values are statistically significantly different from MSS but not from MSI. Number of samples: 25 EBV+, 69 MSI, 277 MSS (A); 25 EBV+, 80 MSI, 310 MSS (B, C); 23 EBV+, 58 MSI, 189 MSS (D); 17 EBV+, 13 MSI, 16 MSS (E). The number of samples is different in (A) and (B, C) because for some samples expression data were available but mutation data were not, or vice versa. For samples shown in (B, C) but not in (D), CIBERSORT provided P values of .05 greater. Boxplots (C, D) use the following convention: the horizontal line represents the median value, the box covers the interquartile range (IQR), the whiskers cover values within 1.5 IQR beyond the box, and values beyond 1.5 IQR are represented as dots. In violin plots (E), the black dots mark the median of each class. EBV = Epstein-Barr virus; MSI = microsatellite-instable; MSS = microsatellite-stable; TIL = tumor-infiltrating lymphocyte.

References

    1. Muro K, Chung HC, Shankaran V et al. , Pembrolizumab for patients with PD-l1-positive advanced gastric cancer (KEYNOTE-012): A multicentre, open-label, phase 1b trial. Lancet Oncol. 2016;176:717–726. - PubMed
    1. Rosenberg JE, Hoffman-Censits J, Powles T et al. , Atezolizumab in patients with locally advanced and metastatic urothelial carcinoma who have progressed following treatment with platinum-based chemotherapy: A single-arm, multicentre, phase 2 trial. Lancet. 2016;38710031:1909–1920. - PMC - PubMed
    1. Snyder A, Makarov V, Merghoub T et al. , Genetic basis for clinical response to CTLA-4 blockade in melanoma. N Engl J Med. 2014;37123:2189–2199. - PMC - PubMed
    1. Van Allen EM, Miao D, Schilling B et al. , Genomic correlates of response to CTLA-4 blockade in metastatic melanoma. Science. 2015;3506257:207–211. - PMC - PubMed
    1. Johnson DB, Frampton GM, Rioth MJ et al. , Targeted next generation sequencing identifies markers of response to PD-1 blockade. Cancer Immunol Res. 2016;411:959–967. - PMC - PubMed

Publication types

MeSH terms