. 2018 Jan 4;46(D1):D239-D245.
doi: 10.1093/nar/gkx1141.

DIANA-TarBase v8: a decade-long collection of experimentally supported miRNA-gene interactions

Affiliations

DIANA-TarBase v8: a decade-long collection of experimentally supported miRNA-gene interactions

Dimitra Karagkouni et al. Nucleic Acids Res. .

Abstract

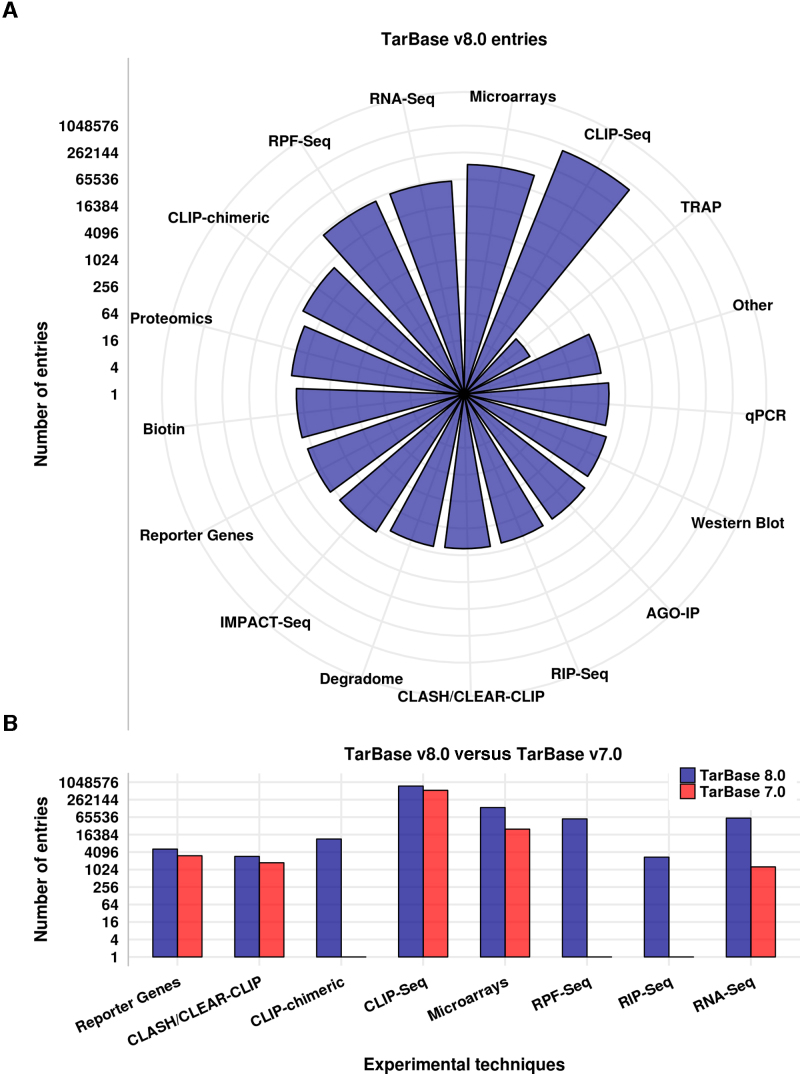
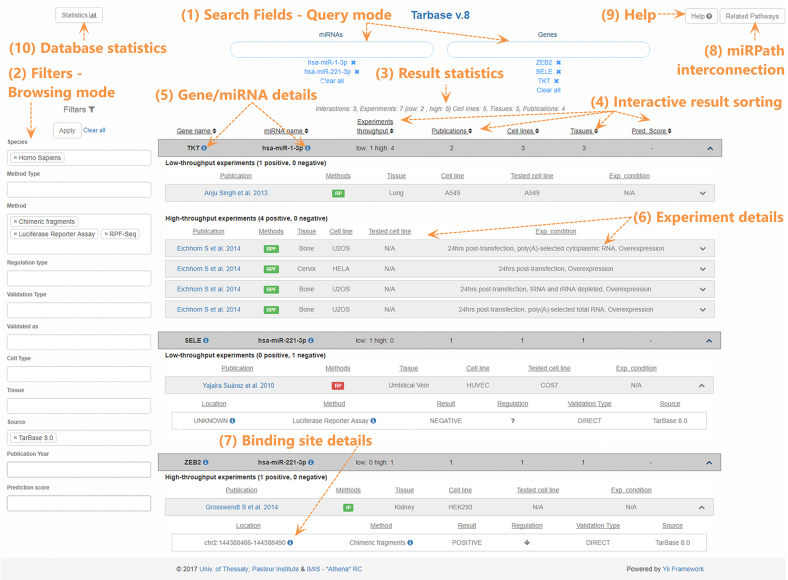
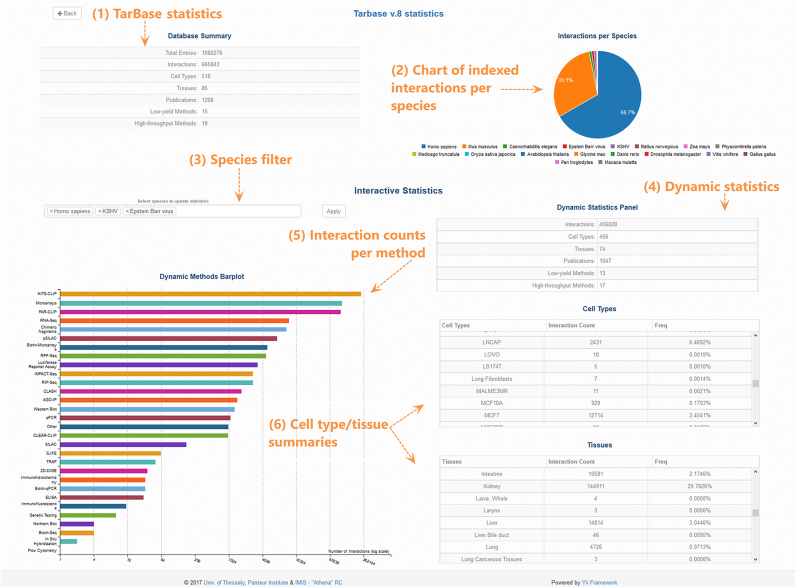
DIANA-TarBase v8 (http://www.microrna.gr/tarbase) is a reference database devoted to the indexing of experimentally supported microRNA (miRNA) targets. Its eighth version is the first database indexing >1 million entries, corresponding to ∼670 000 unique miRNA-target pairs. The interactions are supported by >33 experimental methodologies, applied to ∼600 cell types/tissues under ∼451 experimental conditions. It integrates information on cell-type specific miRNA-gene regulation, while hundreds of thousands of miRNA-binding locations are reported. TarBase is coming of age, with more than a decade of continuous support in the non-coding RNA field. A new module has been implemented that enables the browsing of interactions through different filtering combinations. It permits easy retrieval of positive and negative miRNA targets per species, methodology, cell type and tissue. An incorporated ranking system is utilized for the display of interactions based on the robustness of their supporting methodologies. Statistics, pie-charts and interactive bar-plots depicting the database content are available through a dedicated result page. An intuitive interface is introduced, providing a user-friendly application with flexible options to different queries.


Figures

Figure 1.
Figure 1.
TarBase entries divided per methodology. Values are plotted in log2 scale. Each grid line corresponds to quadrupling of indexed miRNA interactions. (A) Total miRNA–gene entries incorporated in TarBase v8.0. (B) Comparison of TarBase v8.0 and TarBase v7.0 entries.
Figure 2.
Figure 2.
Snapshot depicting the DIANA-TarBase v8.0 interface. Users can apply a query with miRNA and/or gene names (1) or navigate in the database content through combinations of the filtering criteria (2). Positive/negative interactions can be refined with a series of filtering options including species, tissues/cell types, methodologies, type of validation (direct/indirect), database source, publication year as well as in silico predicted score (2). Brief result statistics are promptly calculated (3). Interactions can be sorted in ascending or descending order based on gene and/or miRNA names, on the number of experiments, publications and cell types/tissues supporting them (4). Gene and miRNA details, complemented with active links to Ensembl, miRBase and the DIANA disease tag cloud, are provided (5). Details regarding the experimental procedures such as the methodology, cell type/tissue, experimental conditions and link to the actual publication are presented (6). Methods are color-coded, with green and red portraying validation for positive and negative regulation, respectively. Interactions are also accompanied by miRNA-binding site details (7). Links to DIANA-miRPath functional analysis resource (8) and to an informative Help section (9) are also available. Users can navigate to the separate database statistics page (10).
Figure 3.
Figure 3.
Screenshot depicting DIANA-TarBase statistics page. The number of interactions, cell types/tissues, publications and low-/high-throughput methodologies are summarized at the top of the page (1). A pie-chart portraying the database content per species is provided (2). The user can select any species combination (3) to obtain relevant statistics (4). The bar-plot (5) and tables (6) at the end of the page show the number of interactions (log2-scaled) per methodology and the cell-type/tissue frequencies respectively. They are also dynamically populated depending on the user’s choice of species.

References

    1. Vlachos I.S., Hatzigeorgiou A.G.. Online resources for miRNA analysis. Clin. Biochem. 2013; 46:879–900. - PubMed
    1. Huntzinger E., Izaurralde E.. Gene silencing by microRNAs: contributions of translational repression and mRNA decay. Nat. Rev. Genet. 2011; 12:99–110. - PubMed
    1. Thomson D.W., Bracken C.P., Goodall G.J.. Experimental strategies for microRNA target identification. Nucleic Acids Res. 2011; 39:6845–6853. - PMC - PubMed
    1. Goodwin S., McPherson J.D., McCombie W.R.. Coming of age: ten years of next-generation sequencing technologies. Nat. Rev. Genet. 2016; 17:333–351. - PMC - PubMed
    1. Vlachos I.S., Georgakilas G., Tastsoglou S., Paraskevopoulou M.D., Karagkouni D., Hatzigeorgiou A.G.. De Pietri Tonelli D. Computational challenges and -omics approaches for the identification of miRNAs and targets. Essentials of Noncoding RNA in Neuroscience. 2017; Boston: Academic Press; 39–60.

Publication types