. 2017 Sep 24;8(49):84743-84760.
doi: 10.18632/oncotarget.21262. eCollection 2017 Oct 17.

Vemurafenib-resistance via de novo RBM genes mutations and chromosome 5 aberrations is overcome by combined therapy with palbociclib in thyroid carcinoma with BRAFV600E

Affiliations

Vemurafenib-resistance via de novo RBM genes mutations and chromosome 5 aberrations is overcome by combined therapy with palbociclib in thyroid carcinoma with BRAFV600E

Zeus A Antonello et al. Oncotarget. .

Abstract

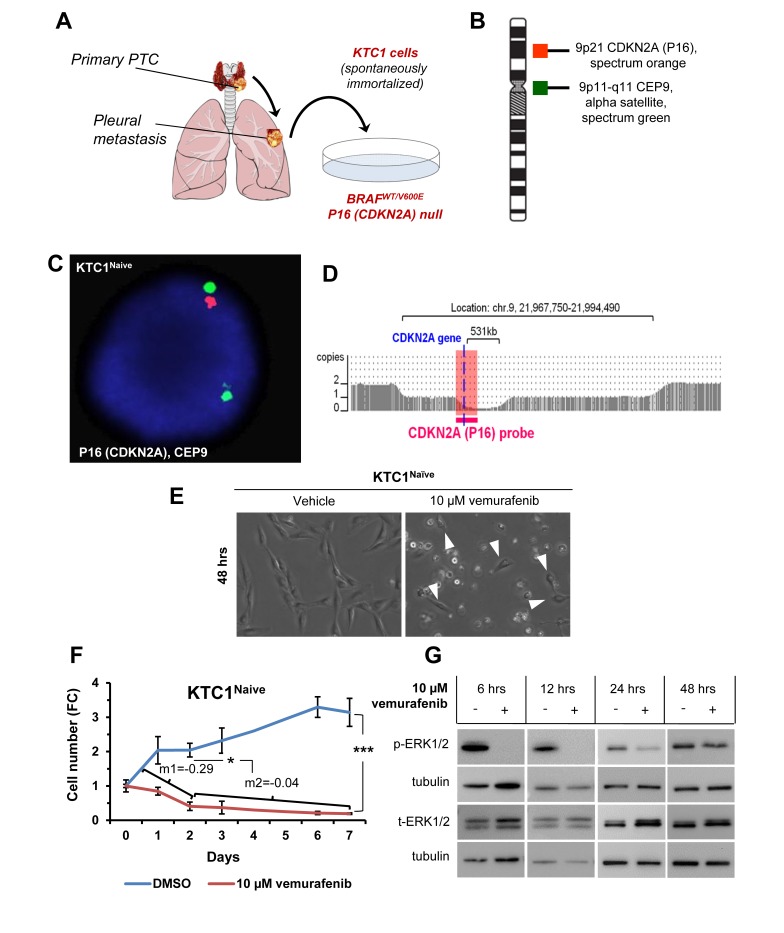
Purpose: Papillary thyroid carcinoma (PTC) is the most frequent endocrine tumor. BRAFV600E represents the PTC hallmark and is targeted with selective inhibitors (e.g. vemurafenib). Although there have been promising results in clinical trials using these inhibitors, most patients develop resistance and progress. Tumor clonal diversity is proposed as one mechanism underlying drug resistance. Here we have investigated mechanisms of primary and secondary resistance to vemurafenib in BRAFWT/V600E-positive PTC patient-derived cells with P16-/- (CDKN2A-/-).

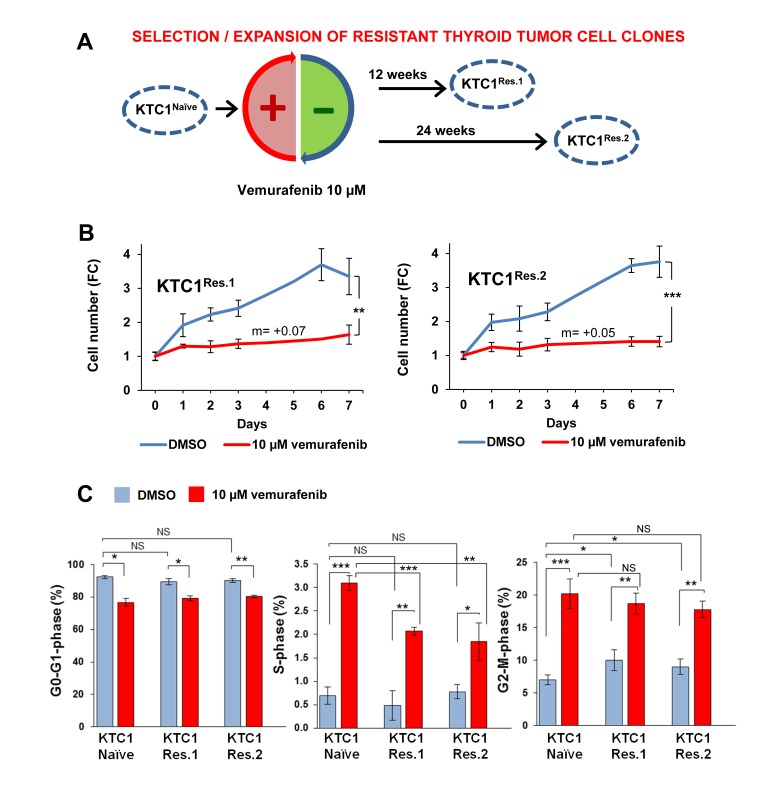
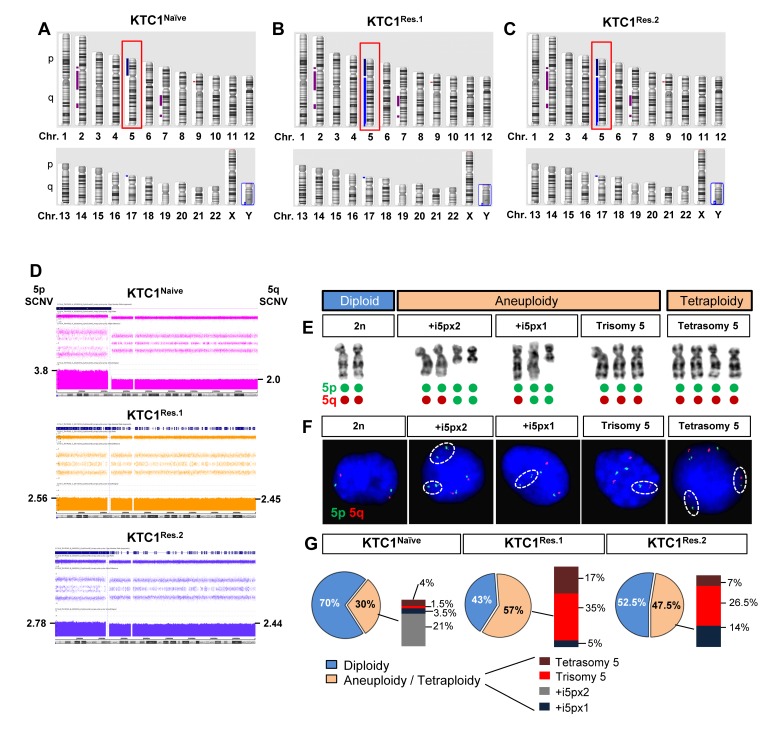
Experimental design: Following treatment with vemurafenib, we expanded a sub-population of cells with primary resistance and characterized them genetically and cytogenetically. We have used exome sequencing, metaphase chromosome analysis, FISH and oligonucleotide SNP-microarray assays to assess clonal evolution of vemurafenib-resistant cells. Furthermore, we have validated our findings by networks and pathways analyses using PTC clinical samples.

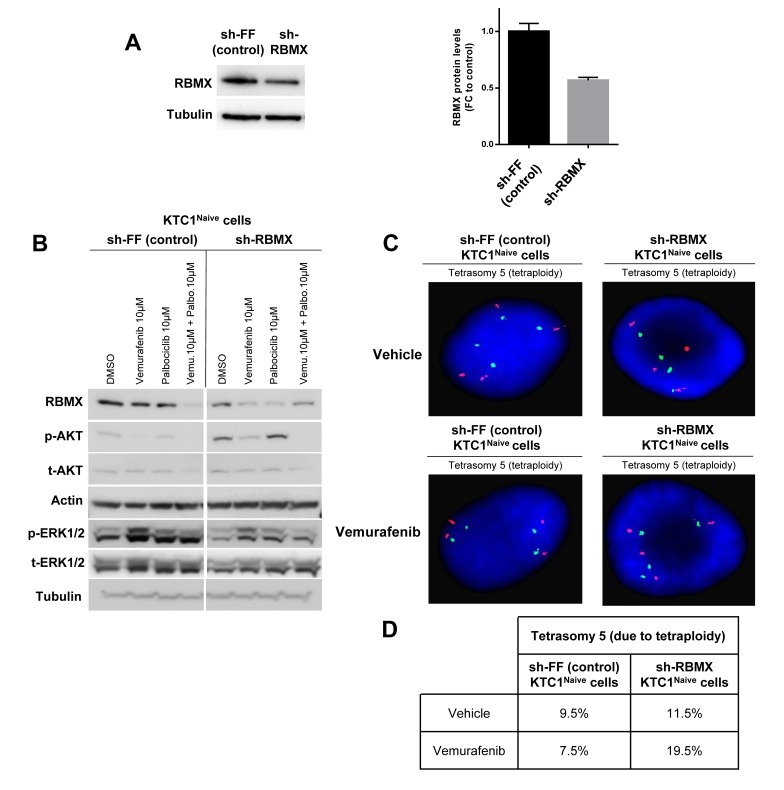
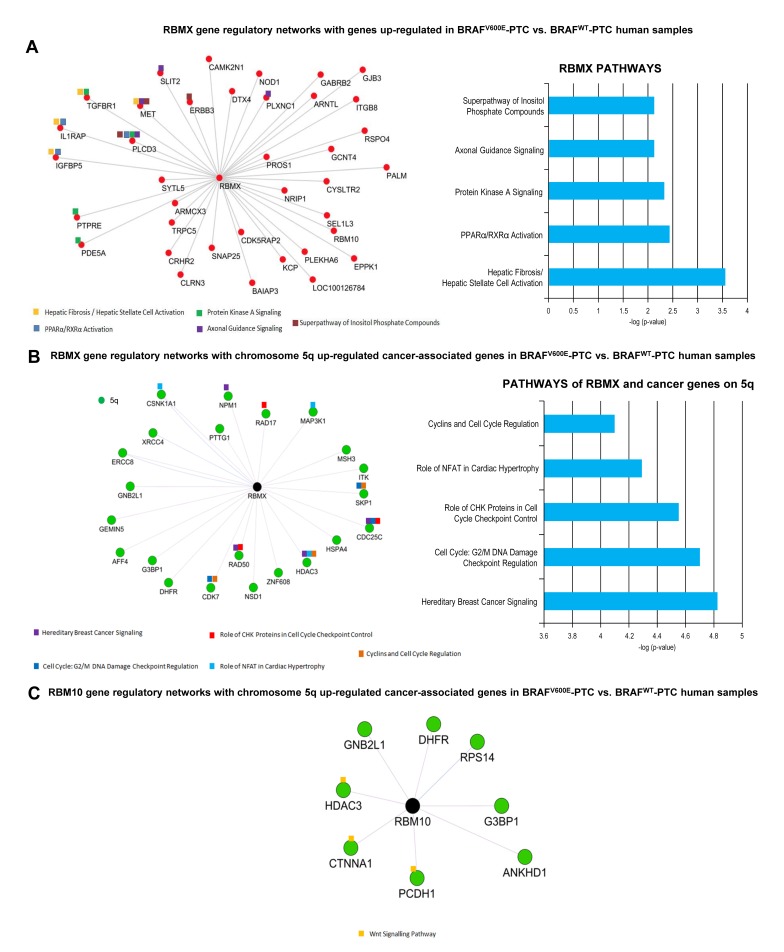
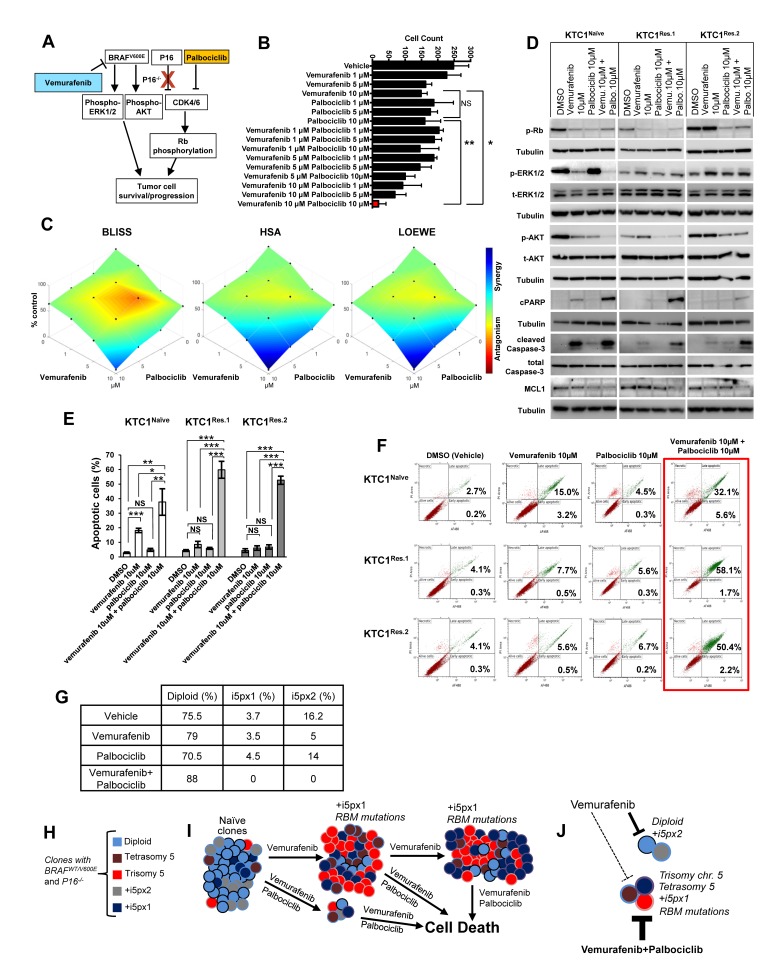
Results: Vemurafenib-resistant cells grow similarly to naïve cells but are refractory to apoptosis upon treatment with vemurafenib, and accumulate in G2-M phase. We find that vemurafenib-resistant cells show amplification of chromosome 5 and de novo mutations in the RBM (RNA-binding motifs) genes family (i.e. RBMX, RBM10). RBMX knockdown in naïve-cells contributes to tetraploidization, including expansion of clones with chromosome 5 aberrations (e.g. isochromosome 5p). RBMX elicits gene regulatory networks with chromosome 5q cancer-associated genes and pathways for G2-M and DNA damage-response checkpoint regulation in BRAFWT/V600E-PTC. Importantly, combined therapy with vemurafenib plus palbociclib (inhibitor of CDK4/6, mimicking P16 functions) synergistically induces stronger apoptosis than single agents in resistant-cells and in anaplastic thyroid tumor cells harboring the heterozygous BRAFWT/V600E mutation.

Conclusions: Critically, our findings suggest for the first time that targeting BRAFWT/V600E and CDK4/6 represents a novel therapeutic strategy to treat vemurafenib-resistant or vemurafenib-naïve radioiodine-refractory BRAFWT/V600E-PTC. This combined therapy could prevent selection and expansion of aggressive PTC cell sub-clones with intrinsic resistance, targeting tumor cells either with primary or secondary resistance to BRAFV600E inhibitor.

Keywords: BRAFV600E; chromosome 5; combined therapy with vemurafenib and palbociclib; drug resistance; papillary thyroid cancer preclinical model.


Conflict of interest statement

CONFLICTS OF INTEREST All authors declare no conflicts of interest that influence this manuscript.

Figures

Figure 1
Figure 1. Model of primary resistance to vemurafenib using PTC patient-derived cells harboring the heterozygous BRAFV600E mutation and with P16 (CDKN2A) deletion
A. KTC1 cells are spontaneously immortalized cell derived from the pleural effusion of a BRAFV600E positive recurrent papillary thyroid carcinoma (PTC). B. Probe design for the detection of P16 (CDKN2A) by fluorescence in situ hybridization (FISH) in KTC1 cells. C. FISH analysis for the detection of P16 (CDKN2A) gene in KTC1 cells. D. Microarray analysis of KTC1 cells (pink). Zoom in view of the CDKN2A gene region of chromosome 9 showing the biallelic deletion of 9p21. The larger 3.0 Mb deletion on one chromosome 9 takes out the CDKN2A gene and the entire segment covered by the orange FISH probe, while the smaller 531 kb deletion also results in deletion of CDKN2A but leaves intact a small portion of the region covered by the FISH probe. This explains why a single small red CDKN2A signal was detected by FISH. All above results were validated by two independent replicate measurements. E. Phase contrast images of KTC1 cells treated with 10 µM vemurafenib or DMSO (vehicle) for 48 hours (hrs) show sub-population of cells resistant to treatment (arrowheads). These results were validated at least by three independent replicate measurements. F. Growth curve based on KTC1 cell count shown as fold change (FC) in the presence of 10 µM vemurafenib or vehicle (DMSO). Angular coefficient (m) values between 0 and 2 days (m1); between 2 and 7 days (m2) are shown: cell death rate was significantly reduced by 6.8-folds beyond 2 days by vemurafenib treatment. These data represent the average ± standard deviation (error bars) of four independent replicate measurements (*p < 0.05, **p < 0.01, ***p < 0.001). G. Representative western blot analysis of KTC1 cells treated with 10 µM vemurafenib at the indicated time points shows that phospho(p)-ERK1/2 protein expression levels are not reduced in surviving cells compared to vehicle-treated cells. These results were validated at least by three independent replicate measurements.
Figure 2
Figure 2. Clonal selection and expansion of PTC patient-derived cells with BRAFV600E and P16-/- in the presence of vemurafenib treatment
A. Experimental model of clonal expansion of KTC1 cells with primary resistance to vemurafenib: two independent batches of resistant cells, KTC1Res.1 and KTC1Res.2, were exposed to 10 µM vemurafenib for 12 or 24 weeks, respectively, to select vemurafenib-resistant clones. B. Growth curve of KTC1Res.1 and KTC1Res.2 cells treated with 10 µM vemurafenib or vehicle (DMSO). Vehicle-treated KTC1Res.1 and KTC1Res.2 cells show similar growth rate compared to KTC1Naive cells (Figure 1F). Vemurafenib-treated resistant cells grew significantly slower compared to vehicle-treated control cells. Vemurafenib-treated resistant cells grew with a constant rate (slope/gradient analysis, m value=+0.07 or =+0.05, respectively) compared to KTC1Naive cells (negative m values reported in Figure 1F). These data represent the average ± standard deviation (error bars) of four independent replicate measurements (*p < 0.05, **p < 0.01, ***p < 0.001). C. Percentage of cells in G0-G1, S and G2-M phases in KTC1Naive, KTC1Res.1, and KTC1Res.2 when exposed to 10 µM vemurafenib or vehicle (DMSO) for 48 hrs: vemurafenib treatment induced a significant increase of either naïve or resistant cells in S and G2-M phase compared to vehicle-treated cells. Vehicle-treated resistant cells significantly increased in G2-M phase compared to vehicle-treated naïve cells (KTC1naïve=6.33±0.78; KTC1Res1=9.53±1.61, p-value=0.023; KTC1Res2= 8.65±1.15, p-value=0.032). These data represent the average ± standard deviation (error bars) of two independent replicate measurements (*p < 0.05, **p < 0.01, ***p < 0.001, NS=not significant).
Figure 3
Figure 3. Vemurafenib-resistant PTC patient-derived cells with BRAFV600E and P16-/- show an increased tetraploidy/aneuploidy and expansion of clones with chromosome 5 amplification
A.-C. Ideogram of an Affymetrix oligonucleotide-SNP microarray analysis of the chromosomes landscape of KTC1Naive, KTC1Res.1, and KTC1Res.2 cells showed copy number gain of chromosome 5 (red box) and on 17p, loss on chromosome 9p and copy number neutral loss of heterozygosity on chromosomes 2 and 7. KTC1Res.1 and KTC1Res.2 cells acquire copy number gain of 5q compared to KTC1Naive cells. D. Affymetrix oligonucleotide-SNP microarray analysis with zoom in of somatic copy number variations (SCNV) of chromosome 5 in KTC1Naive (pink), KTC1Res.1 (orange) and KTC1Res.1 (blue) cells. KTC1Res.1 (2.45 copies) and KTC1Res.2 (2.44) showed extra copies of chromosome 5q compared to the KTC1Naive cells (2 copies). KTC1Naive cells showed 3.8 extra copies of 5p (produced by two copies of one 5p isochromosome) in 45% of the cells in the sample. KTC1Res.1 cells showed 2.56 copies of chromosome 5p in 44% of the cells and 2 extra copies of 5p (produced by a 5p isochromosome) in 17% of the cells in the sample. KTC1Res.2 cells showed 2.78 copies of chromosome 5 in 45% of the cells and 2 extra copies of 5p (produced by a 5p isochromosome) in 5.5% of the cells in the sample. All these findings were validated by at least by two independent experiments with replicates measurements. E. Clones with respect to chromosome 5 identified in KTC1Naive, KTC1Res.1 and KTC1Res.2 cells. KTC1 cells showed karyotype with either diploidy, or aneuploidy or tetrasomy (due to tetraploidy) of chromosome 5. Green and red dots exemplify how these karyotypes are visualized by FISH in panel F. F. Chromosome 5 clones assessed by fluorescence in situ hybridization (FISH) analysis in KTC1Naive, KTC1Res.1 and KTC1Res.2 cells. Specific probes identify chromosome 5p (green) and 5q (red). G. Quantification of chromosome 5 clones detected by FISH in KTC1Naive, KTC1Res.1 and KTC1Res.2 cells.
Figure 4
Figure 4. RBMX knock-down contributes to tetraploidy in PTC patient-derived cells with BRAFV600E and P16-/- treated with vemurafenib
A. Representative western blotting analysis of RBMX knockdown (sh-RBMX) compared to control (sh-FF) and densitometry quantification (FC=fold change) of RBMX protein levels at 48 hrs post seeding in BRAFV600E-KTC1Naive cells. B. Representative western blotting analysis of RBMX, pAKT, tAKT, pERK1/2 and tERK1/2 protein expression levels in KTC1Naive cells with RBMX knockdown (sh-RBMX) compared to shRNA control (sh-FF) cells at 48 hrs. These results were validated by two independent replicate measurements. C. Fluorescence in situ hybridization (FISH) analysis of KTC1Naive cells with RBMX knockdown compared to sh-control cells. D. Quantification of clones by interphase fluorescence in situ hybridization (FISH) analysis in KTC1Naive cells engineered to express sh-RBMX or sh-control (shFF). Cells were treated for 48 hrs with either vehicle or 10 µM vemurafenib. These results were validated quantifying 200 cells by two independent replicate measurements.
Figure 5
Figure 5. RBM genes regulatory networks with up-regulated genes in BRAFV600E-PTC versus BRAFWT-PTC human samples
A. Differential gene expression analysis on BRAFV600E-PTC vs. BRAFWT-PTC human samples (PTC TCGA data base) identified 1884 genes with p < 0.05 and fold change 2. The co-expression analysis for these genes was performed on the basis of PTC TCGA data (interactions with p value <0.05 from correlation test were considered significant) to generate a map of RBMX and RBM10 gene regulatory networks. Image shows genes that depict significant interaction with RBMX top pathways of interactive genes regulatory networks. Red circles indicate up-regulated genes in BRAFV600E-PTC vs. BRAFWT-PTC samples. B. RBMX gene regulatory networks with chromosome 5q cancer-associated genes annotated by NCBI using BRAFV600E-PTC vs. BRAFWT-PTC human samples (PTC TCGA data base). The co-expression analysis for these genes was performed on the basis of PTC TCGA data (interactions with p value <0.05 from correlation test were considered statistically significant). For pathways analysis: -Log p value 1.3= p value= 0.05; -log p value 2= p value= 0.01; -log p value 3= p value= 0.001; -log P value 4= p value=0.0001. C. RBM10 gene regulatory networks with chromosome 5q cancer-associated genes annotated by NCBI using BRAFV600E-PTC vs. BRAFWT-PTC human samples (PTC TCGA data base) (interactions with p value <0.05 from correlation test were considered statistically significant).
Figure 6
Figure 6. Combined therapy with vemurafenib plus palbociclib overcomes resistance to single agent treatments in PTC patient-derived cells with BRAFV600E and P16-/-
A. Diagram of a proposed targeted therapy strategy in human invasive thyroid carcinoma cells harboring the heterozygous BRAFV600E mutation and with P16 loss (P16-/-). B. Histogram shows cells number upon treatments with vehicle, vemurafenib, palbocilib, or combined therapy vemurafenib plus palbociclib; quantitative analysis was performed at 48 hours post-treatments by direct counting of adherent cells. These data represent the average ± standard deviation (error bars) of three replicates from two independent measurements. Statistical significance (*p <0.05; **p < 0.01; NS=not significant) was determined by one-way analysis of variance (ANOVA) using Tukey’s correction for multiple comparisons. C. Visualization of drug combinations: surface plots of naïve KTC1 cells treated vehicle, vemurafenib, palbocilib, or combined therapy vemurafenib plus palbociclib. Each point represents the mean of three replicates from two independent measurements. Plots were generated using Combenefit script by MATLAB R2017a by applying three methods for combined treatments: Bliss (effect-based approach); Highest Single Agent (HSA) (effect-based approach); and Loewe (dose-effect based approach). Level of antagonism or synergism is rapresented by color scale bar. D. Western blotting analysis of proteins expression levels at 24 hrs treatment with DMSO (vehicle), vemurafenib, palbocilib and combined therapy with vemurafenib plus palbocilib. These results were validated by two independent experiments. E. Quantification of apoptosis by annexin V and propidium iodide (PI) dual staining assay in KTC1Naive, KTC1Res.1 and KTC1Res.2 cells at 48 hrs treatment with DMSO (vehicle), 10 µM vemurafenib, 10 µM palbocilib and combined therapy with 10 µM vemurafenib + 10 µM palbocilib. These data represent the average ± standard deviation (error bars) of two independent replicate measurements (*p < 0.05, **p < 0.01, ***p < 0.001, NS=not significant). F. Representive Annexin V/PI Flow cytometry analysis of KTC1Naive, KTC1Res.1 and KTC1Res.2 cells at 48 hrs treatment with DMSO (vehicle), 10 µM vemurafenib, 10 µM palbocilib and combined therapy with 10 µM vemurafenib + 10 µM palbocilib. These data are representative of three independent replicate measurements (*p < 0.05, **p < 0.01, ***p < 0.001). G. Quantification of cell clones with either diploid or chromosome 5 aberrations assessed by interphase fluorescence in situ hybridization (FISH) analysis in KTC1Naive cells treated for 48 hrs with vehicle, 10 µM vemurafenib (vemu), 10 µM palbociclib (palbo) or 10 µM vemurafenib plus 10 µM palbociclib. These results were validated quantifying 200 cells by two independent replicate measurements. H. KTC1 cells harboring the BRAFV600E mutation and with P16 loss show heterogeneous clones which are diploid, aneuploidy (trisomy of chromosome 5, with one copy (+i5px1) or two copies (+i5px2) of isochromosome 5p), or with tetrasomy of chromosome 5 due to tetraploidy. I. Clonal selection and expansion of KTC1 cells during sustained treatment with vemurafenib; these selected clones acquire mutations in the RBM genes (e.g. RBMX, RBM10). J. Scheme of treatments with vemurafenib and palbociclib: dashed lines indicate that KTC1 cells clones with trisomy or tetrasomy of chromosome 5, +i5px1, or RBM mutations are resistant and less responsive to the single agent treatments. Whereas combined therapy with vemurafenib plus palbociclib (thick bold lines) significantly induces cell death and overcomes resistance to the single agent treatments by reducing clonal expansion of KTC1 cells with chromosome 5 aberrations.

Comment in

References

    1. Cancer Genome Atlas Research Network Integrated genomic characterization of papillary thyroid carcinoma. Cell. 2014;159:676–90. - PMC - PubMed
    1. Sosman JA, Kim KB, Schuchter L, Gonzalez R, Pavlick AC, Weber JS, McArthur GA, Hutson TE, Moschos SJ, Flaherty KT, Hersey P, Kefford R, Lawrence D, et al. Survival in BRAF V600-mutant advanced melanoma treated with vemurafenib. N Engl J Med. 2012;366:707–14. - PMC - PubMed
    1. Xing M, Alzahrani AS, Carson KA, Viola D, Elisei R, Bendlova B, Yip L, Mian C, Vianello F, Tuttle RM, Robenshtok E, Fagin JA, Puxeddu E, et al. Association between BRAF V600E mutation and mortality in patients with papillary thyroid cancer. JAMA. 2013;309:1493–501. - PMC - PubMed
    1. Nucera C, Nehs MA, Nagarkatti SS, Sadow PM, Mekel M, Fischer AH, Lin PS, Bollag GE, Lawler J, Hodin RA, Parangi S. Targeting BRAFV600E with PLX4720 displays potent antimigratory and anti-invasive activity in preclinical models of human thyroid cancer. Oncologist. 2011;16:296–309. - PMC - PubMed
    1. Nucera C, Porrello A, Antonello ZA, Mekel M, Nehs MA, Giordano TJ, Gerald D, Benjamin LE, Priolo C, Puxeddu E, Finn S, Jarzab B, Hodin RA, et al. B-Raf(V600E) and thrombospondin-1 promote thyroid cancer progression. Proc Natl Acad Sci U S A. 2010;107:10649–54. - PMC - PubMed