. 2017 Jul 27;8(49):85169-85184.
doi: 10.18632/oncotarget.19615. eCollection 2017 Oct 17.

Multiple regulatory aspects of histone methyltransferase EZH2 in Pb-induced neurotoxicity

Affiliations

Multiple regulatory aspects of histone methyltransferase EZH2 in Pb-induced neurotoxicity

Wei-Zhen Xue et al. Oncotarget. .

Abstract

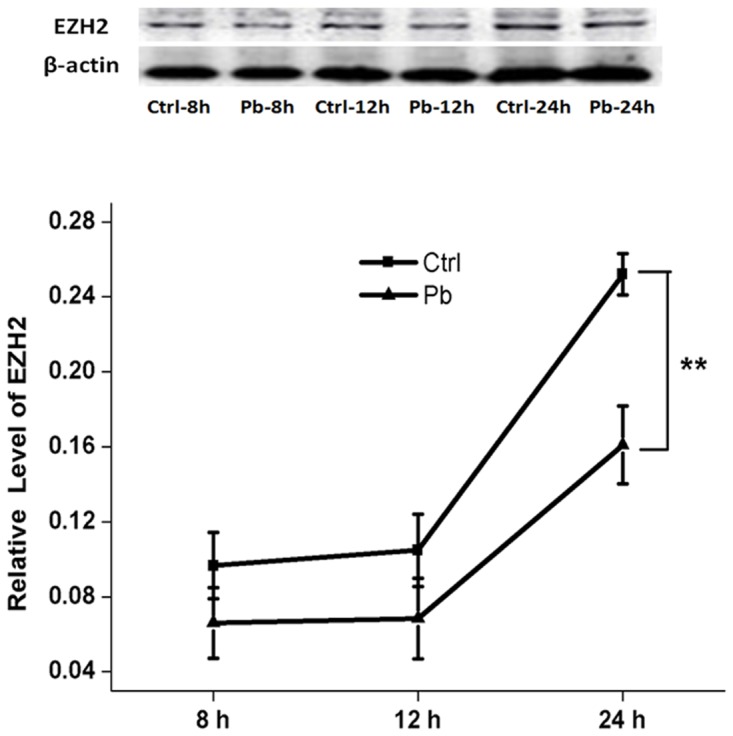
Pb is a pervasive environmental threat to human health. Although remarkable progress has been made in its neurotoxicity, the precise molecular mechanisms underlying this widespread toxicant still remain elusive. In this study, the detailed roles of EZH2, a transcriptional repressor, in the regulation of Pb-led neurotoxicity were investigated, highlighting its sub-functionalization, compartmentalization, functional chaperones and downstream partners. Based on the findings, EZH2's protein levels were significantly reduced in response to Pb treatment; EZH2's gain-of-function trials recovered the dampened neurite outgrowth; EZH2' recruitment to ploycomb complex, as well as its interaction with cytosolic Vav1, was altered in a distinct manner, suggesting that EZH2's multiple roles were markedly redistributed in this context; EZH2's cytosolic and nuclear presence differed in their respective response towards Pb treatment; EZH2 directly occupied the promoters of EGR2, NGFR and CaMKK2, genes responsible for various nerve functions and repair mechanisms, and essentially contributed to their aberrant expression. It indicated that EZH2 mediated the dynamic changes of a cascade of key molecules and consequently the related neurological impairments. In summary, EZH2 emerges as a central player to regulate Pb-led neurotoxicity in a transcriptionally dependent and independent manner, and thereby provided a promising molecular target for medical intervention.

Keywords: EZH2; PRC2; Pb; chromatin immunoprecipitation; neurotoxicity.


Conflict of interest statement

CONFLICTS OF INTEREST The authors declare no conflicts of interest.

Figures

Figure 1
Figure 1. Cell viability altered by Pb exposure with various concentrations for 24 h
The data was obtained from the MTT reduction assay on PC 12 cells. Values represent mean ± SEM of triplicate experiments. * Indicates significantly different (P<0.05) between the indicated groups.
Figure 2
Figure 2. EZH2’s protein expression altered by Pb exposure with various concentrations for 24 h on PC 12 cells
Quantification of western blotting results for EZH2 was shown in the lower portion. The maximum value obtained from the control sample was set as “1” for normalization. Data were shown as mean ± SEM (n=3). ** and *** indicated significantly different (P<0.01 and P<0.001) compared to control, respectively. Representative western blots of EZH2 and β-actin (internal control) proteins were shown in the upper portion.
Figure 3
Figure 3. EZH2’s protein expression altered by 5 μM’s Pb exposure with various incubation periods on PC 12 cells
Quantification of western blotting results for EZH2 was shown in the lower portion. The protein level of EZH2 was calculated as compared to the respective control group. Data were shown as mean ± SEM (n=3). ** indicated significantly different (P<0.01). Representative western blots of EZH2 and β-actin (internal control) proteins were shown in the upper portion.
Figure 4
Figure 4. In vivo test of Pb’s effect on the expression of EZH2 in the rat hippocampus
The rats were administered with 250 ppm’s lead acetate indirectly from their mothers and directly from weaning, and the control (receiving no Pb) and experimental rats were decapitated on PND 21, and their hippocampus were collected for Western analysis. Quantification of western blotting results for EZH2 was shown in the lower portion. The protein level of EZH2 was calculated as compared to that of beta-actin. Data were shown as mean ± SEM (n=6). * Indicated significantly different (P<0.05). Representative western blots of EZH2 and β-actin (internal control) proteins were shown in the upper portion.
Figure 5
Figure 5. EZH2 mediated the lead-led impairment of neurite outgrowth of PC 12 cells
(A, B) Schematic representation of pRNAT-shEZH2 and pEASY-EZH2 vector. (C) Western blotting sampled from EZH2-knocking down and overexpressing cells. EZH2, H3K27me3 antibodies were used to perform the trials, and H3 was used as the internal control. (D) NOI (Neurite Outgrowth Index) values of PC 12 cells in the presence and absence of Pb, shEZH2 and o.e. EZH2 treatment. NOI was calculated as the percentage of cells harboring at least one neurite with length equal to the cell body diameter of the total cells in the field. The cells were sampled from at least 15 visual fields for each group. (E, F) Sholl analysis of PC 12 cells transfected with pRNAT-shEZH2 (E) or pEASY-EZH2 (F) vector. At least 15 cells for each group are analyzed, and error bars indicate S.E.M. (G, H) Representative figures (G) and DNA damage statistics (H) of PC 12 cells transfected with pEASY-EZH2 in the Comet assay (n = 50). The insert is a representative cell analyzed by the software CASP.
Figure 6
Figure 6
Co-immunoprecipitation (Co-IP) of H3K27me3 (A) and EZH2 (B) in Pb-treated and untreated PC 12 cells. IgG represents a control antibody used for IPs. Antibodies used for IP and Western blotting (WB) were labeled as grey and black, respectively. Prior to carrying out the IP experiments, one tenth of total lysates were subjected to the respective WB as input controls. (C) Expressions of Vav1, EED, H3K27me3 in the nucleus and cytosol were analyzed by western blotting. The nuclear (Nuc) and cytosolic (Cyt) cell extracts were collected from PC 12 cells with or without lead exposure (24 h), and subsequently quantified by WB with the corresponding antibodies. Expression of β-actin and H3 was used as the internal control for cytosolic and nuclear proteins, respectively.
Figure 7
Figure 7. Cytosolic and nuclear compartmentalization of EZH2 in the context of lead exposure
(A) IF staining of EZH2 on the coverslip of PC 12 cells with or without lead exposure. Nuclei was stained with DAPI, and bars represent 20 μM. (B, C) Expression of EZH2 in the nucleus and cytosol was analyzed by western blotting. The nuclear and cytosolic cell extracts were collected following 24 h (B) or 36 h’s (C) exposure, and subsequently quantified by WB with anti-EZH2 antibody. Expression of β-actin and H3 was used as the internal control for cytosolic and nuclear proteins, respectively.
Figure 8
Figure 8. ChIP analysis of Alox15, Notch1, NGFR, EGR2, HFE, CaMKK2 promoter regions occupied by EZH2 in both control and Pb-exposed cells
Antibodies of IgG (mock) and EZH2 were used to perform the ChIP assay, respectively. Percentages of input DNA are shown as the means ± SEM of triplicate independent experiments. *** Indicates the statistical significance of differences of P<0.001.
Figure 9
Figure 9
Promoter CpG islands’ prediction (A) and qRT-PCR’s analysis of mRNA levels (B) of Notch1, NGFR, EGR2, HFE, CAMKK2 in response to Pb treatment. (A) “Methprimer” was used to perform the CpG island prediction of each gene’s promoter region, termed as the “-500 ∼ +200” region of TSS (Transcription Start Site). The predicted CpG islands (CGI) were marked as the blue shadow. The schematic representation was shown for CAMKK2’s CGI profiles to comply with the calculated result, due that the prediction picture could not be properly exhibited by Methprimer software, in this instance; (B) the fold change indicates the relative change in expression levels between the presence and absence of Pb’s treatment on PC 12 cells. The expression value of each control sample was normalized to “0”, and fold changes are expressed as the relative alterations of Ct values. Fold changes are shown as the means ± SEM of triplicate independent experiments. *** and * indicate the statistical significance of differences of P<0.001 and P<0.05, respectively.
Figure 10
Figure 10. qRT-PCR’s analysis of mRNA levels of EZH2, NGFR, EGR2, CAMKK2 upon EZH2’ overexpression following Pb’s treatment
The expression value of each control sample was normalized to “1”, and fold changes are given as percentages of control after normalization. Fold changes are shown as the means ± SEM of triplicate independent experiments. The expression levels of each gene showed significant difference (P<0.05) in the comparisons of groups pertaining to control-Pb and Pb-oeEZH.
Figure 11
Figure 11. Schematic representation of EZH2’s roles in lead-led neurotoxicity
The proteins (or genes) and the neurological processes involved in Pb-lead neurotoxicity were indicated with hollow boxes. The subcellular location and mode of action of EZH2 was also shown in the same way. The arrows indicate the regulatory or functional relationships between the individual elements.

Similar articles

Cited by

References

    1. Neal AP, Guilarte TR. Molecular neurobiology of lead ((2+)): effects on synaptic function. Mol Neurobiol. 2010;42:151–60. https://doi.org/10.1007/s12035-010-8146-0. - DOI - PMC - PubMed
    1. Amos-Kroohs RM, Graham DL, Grace CE, Braun AA, Schaefer TL, Skelton MR, Vorhees CV, Williams MT. Developmental stress and lead (Pb): effects of maternal separation and/or Pb on corticosterone, monoamines, and blood Pb in rats. Neurotoxicology. 2016;54:22–33. https://doi.org/10.1016/j.neuro.2016.02.011. - DOI - PMC - PubMed
    1. Senut MC, Cingolani P, Sen A, Kruger A, Shaik A, Hirsch H, Suhr ST, Ruden D. Epigenetics of early-life lead exposure and effects on brain development. Epigenomics. 2012;4:665–74. https://doi.org/10.2217/epi.12.58. - DOI - PMC - PubMed
    1. White LD, Cory-Slechta DA, Gilbert ME, Tiffany-Castiglioni E, Zawia NH, Virgolini M, Rossi-George A, Lasley SM, Qian YC, Basha MR. New and evolving concepts in the neurotoxicology of lead. Toxicol Appl Pharmacol. 2007;225:1–27. https://doi.org/10.1016/j.taap.2007.08.001. - DOI - PubMed
    1. Sanders T, Liu Y, Buchner V, Tchounwou PB. Neurotoxic effects and biomarkers of lead exposure: a review. Rev Environ Health. 2009;24:15–45. - PMC - PubMed

LinkOut - more resources