

TSSC3 represses self-renewal of osteosarcoma stem cells and Nanog expression by inhibiting the Src/Akt pathway
- PMID: 29156746
- PMCID: PMC5689636
- DOI: 10.18632/oncotarget.20429
TSSC3 represses self-renewal of osteosarcoma stem cells and Nanog expression by inhibiting the Src/Akt pathway
Abstract
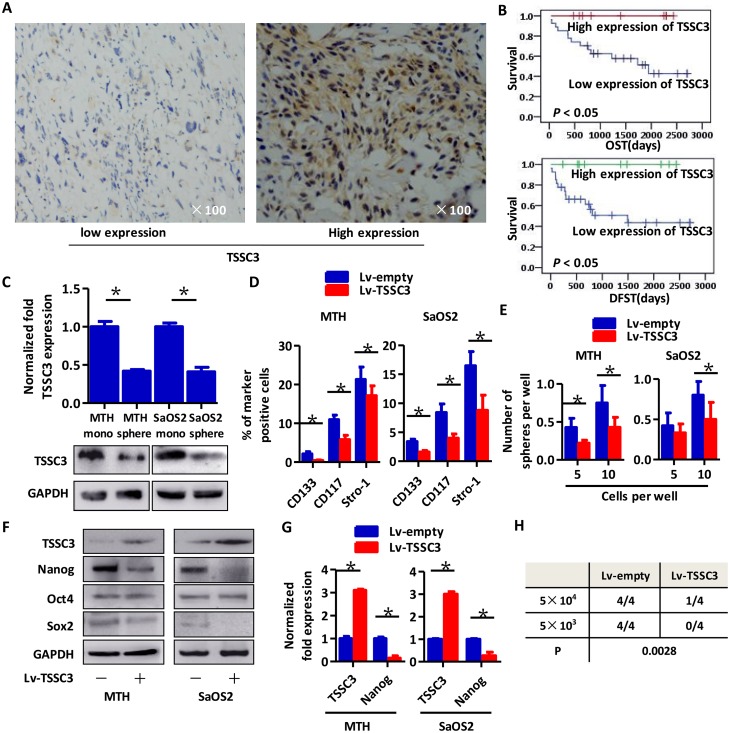
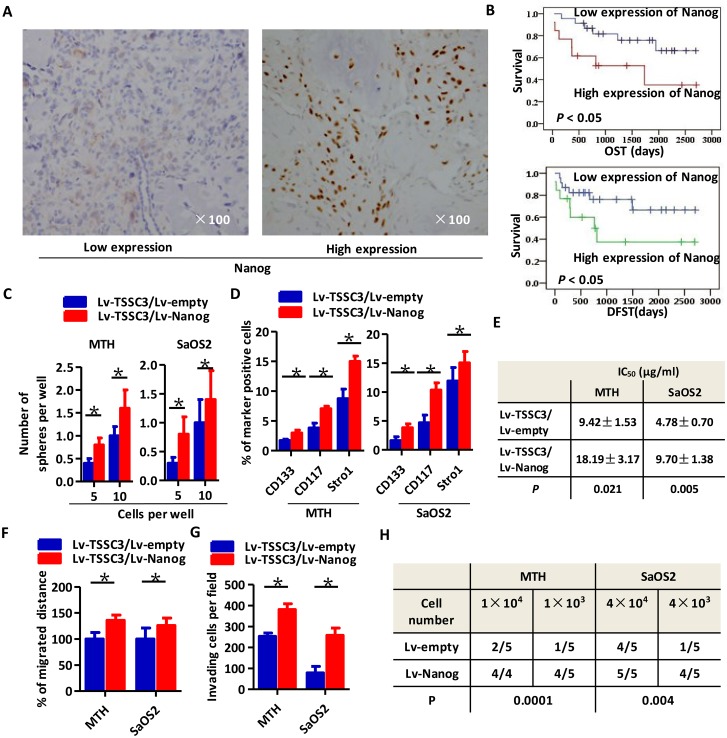
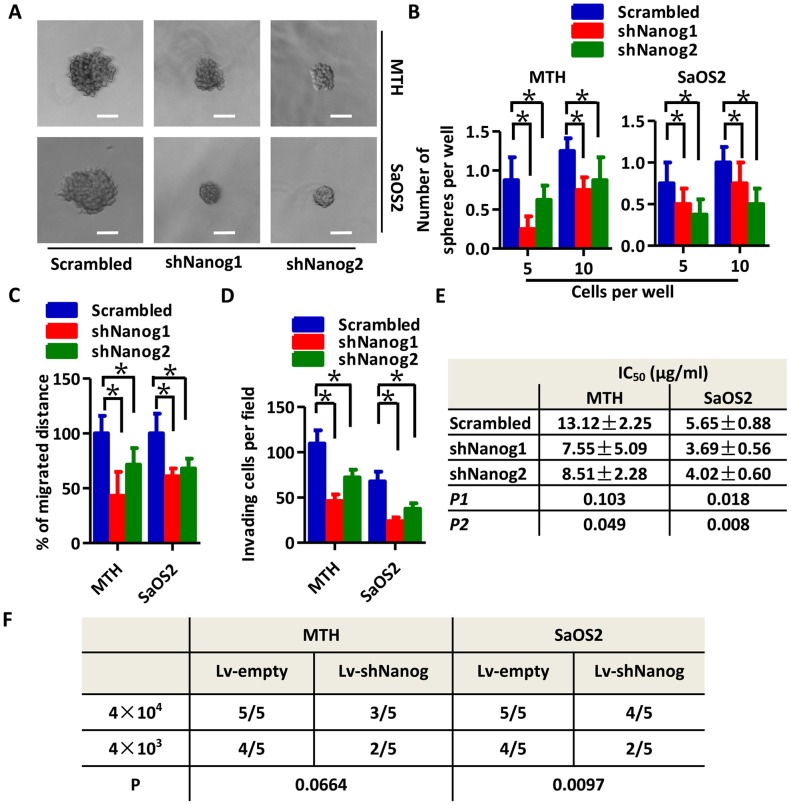
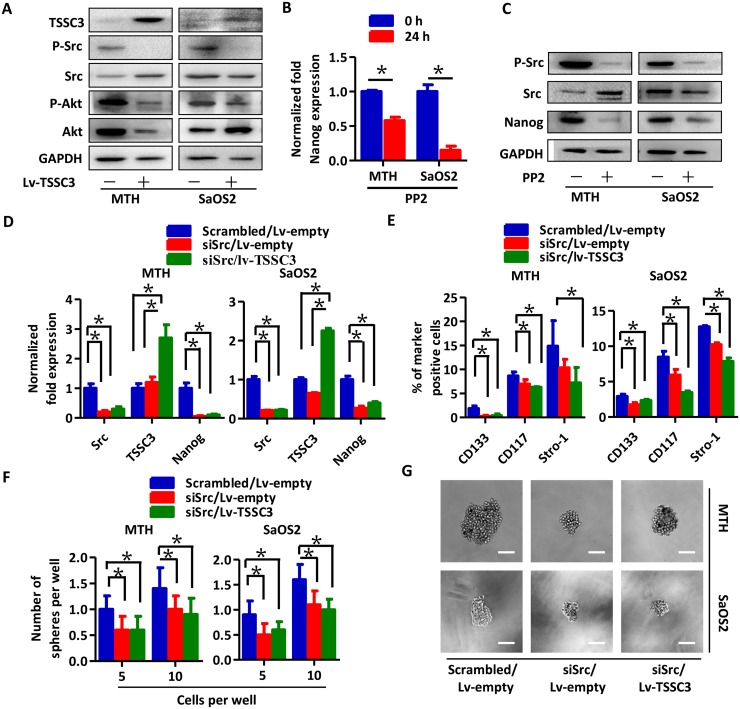
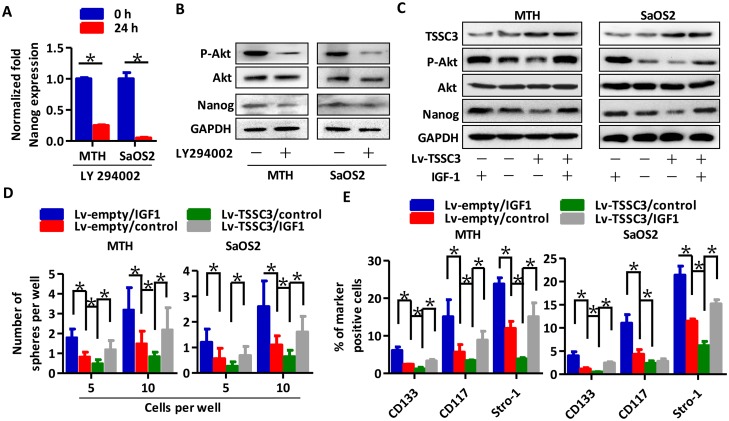
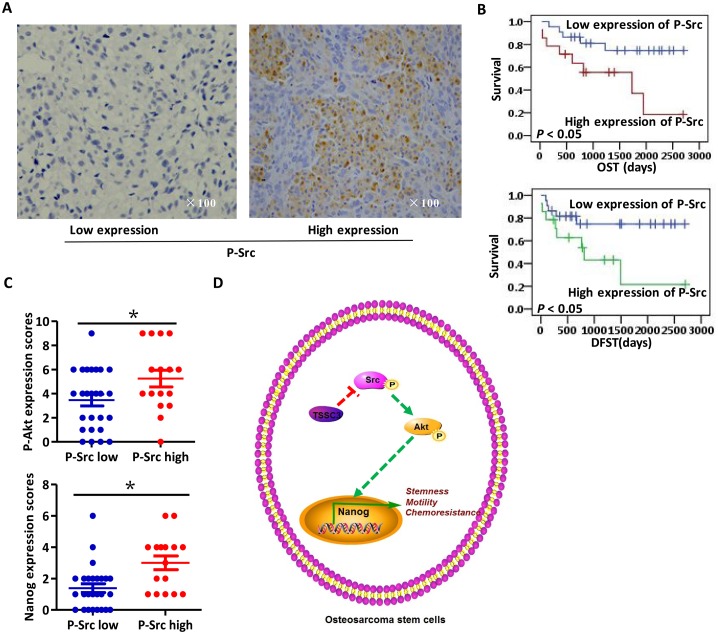
Osteosarcoma is the most common type of bone cancer, and the second leading cause of cancer-related death in children and young adults. Osteosarcoma stem cells are essential for osteosarcoma initiation, metastasis, chemoresistance and recurrence. In the present study, we report that: 1) higher TSSC3 expression indicates a better prognosis for osteosarcoma patients, and; 2) overexpression of TSSC3 significantly decreases sphere-forming capacity, tumor initiation, stemness-related surface markers and Nanog expression in osteosarcoma cells. We also discovered that higher Nanog expression correlates to a worse prognosis for osteosarcoma patients, and overexpression of Nanog increases the stem-related phenotype in osteosarcoma cells. Knockdown of Nanog suppresses these phenotypes. Inhibition of Nanog expression and self-renewal of osteosarcoma cells by TSSC3 overexpression appears to be mediated through inactivation of the Src/Akt pathway. In the clinical setting, expression of TSSC3, p-Src and Nanog is associated with recurrence, metastasis and surgical intervention. Lower TSSC3 expression, higher Nanog expression or higher p-Src expression indicate a poor prognosis for osteosarcoma patients. Overall, our study demonstrates that TSSC3 inhibits the stem-like phenotype and Nanog expression by inactivation of the Src/Akt pathway; this emphasizes the importance of Nanog in osteosarcoma stem cells.
Keywords: Nanog; SRC; TSSC3; cancer stem cells; osteosarcoma.
Conflict of interest statement
CONFLICTS OF INTEREST The authors declare that they have no competing interests.
Figures
Similar articles
-
TSSC3 promotes autophagy via inactivating the Src-mediated PI3K/Akt/mTOR pathway to suppress tumorigenesis and metastasis in osteosarcoma, and predicts a favorable prognosis.J Exp Clin Cancer Res. 2018 Aug 9;37(1):188. doi: 10.1186/s13046-018-0856-6. J Exp Clin Cancer Res. 2018. PMID: 30092789 Free PMC article.
-
RanBP9/TSSC3 complex cooperates to suppress anoikis resistance and metastasis via inhibiting Src-mediated Akt signaling in osteosarcoma.Cell Death Dis. 2016 Dec 29;7(12):e2572. doi: 10.1038/cddis.2016.436. Cell Death Dis. 2016. PMID: 28032865 Free PMC article.
-
TSSC3 overexpression reduces stemness and induces apoptosis of osteosarcoma tumor-initiating cells.Apoptosis. 2012 Aug;17(8):749-61. doi: 10.1007/s10495-012-0734-1. Apoptosis. 2012. PMID: 22610481
-
Advances in osteosarcoma stem cell research and opportunities for novel therapeutic targets.Cancer Lett. 2016 Jan 28;370(2):268-74. doi: 10.1016/j.canlet.2015.11.003. Epub 2015 Nov 10. Cancer Lett. 2016. PMID: 26571463 Review.
-
Insights into the Nanog gene: A propeller for stemness in primitive stem cells.Int J Biol Sci. 2016 Oct 25;12(11):1372-1381. doi: 10.7150/ijbs.16349. eCollection 2016. Int J Biol Sci. 2016. PMID: 27877089 Free PMC article. Review.
Cited by
-
FOSL1 promotes stem cell‑like characteristics and anoikis resistance to facilitate tumorigenesis and metastasis in osteosarcoma by targeting SOX2.Int J Mol Med. 2024 Nov;54(5):94. doi: 10.3892/ijmm.2024.5418. Epub 2024 Sep 2. Int J Mol Med. 2024. PMID: 39219279 Free PMC article.
-
TSSC3 promotes autophagy via inactivating the Src-mediated PI3K/Akt/mTOR pathway to suppress tumorigenesis and metastasis in osteosarcoma, and predicts a favorable prognosis.J Exp Clin Cancer Res. 2018 Aug 9;37(1):188. doi: 10.1186/s13046-018-0856-6. J Exp Clin Cancer Res. 2018. PMID: 30092789 Free PMC article.
-
High expression of ID1 facilitates metastasis in human osteosarcoma by regulating the sensitivity of anoikis via PI3K/AKT depended suppression of the intrinsic apoptotic signaling pathway.Am J Transl Res. 2019 Apr 15;11(4):2117-2139. eCollection 2019. Am J Transl Res. 2019. PMID: 31105823 Free PMC article.
-
PHLDA2 reshapes the immune microenvironment and induces drug resistance in hepatocellular carcinoma.Oncol Res. 2024 May 23;32(6):1063-1078. doi: 10.32604/or.2024.047078. eCollection 2024. Oncol Res. 2024. PMID: 38827322 Free PMC article.
-
Anoikis‑resistant human osteosarcoma cells display significant angiogenesis by activating the Src kinase‑mediated MAPK pathway.Oncol Rep. 2019 Jan;41(1):235-245. doi: 10.3892/or.2018.6827. Epub 2018 Oct 29. Oncol Rep. 2019. PMID: 30542722 Free PMC article.
References
-
- Ta HT, Dass CR, Choong PFM, Dunstan DE. Osteosarcoma treatment: state of the art. Cancer Metast Rev. 2009;28:247–263. - PubMed
-
- Yang X, Wang YP, Liu FX, Zeng K, Qian MQ, Chen G, Shi L, Zhu GX. Increased invasiveness of osteosarcoma mesenchymal stem cells induced by bone-morphogenetic protein-2. In Vitro Cell Dev-An. 2013;49:270–278. - PubMed
LinkOut - more resources
Full Text Sources
Other Literature Sources
Research Materials
Miscellaneous
