. 2017 Sep 12;8(49):85969-85983.
doi: 10.18632/oncotarget.20837. eCollection 2017 Oct 17.

SCO-spondin oligopeptide inhibits angiogenesis in glioblastoma

Affiliations

SCO-spondin oligopeptide inhibits angiogenesis in glioblastoma

Romain Bibes et al. Oncotarget. .

Abstract

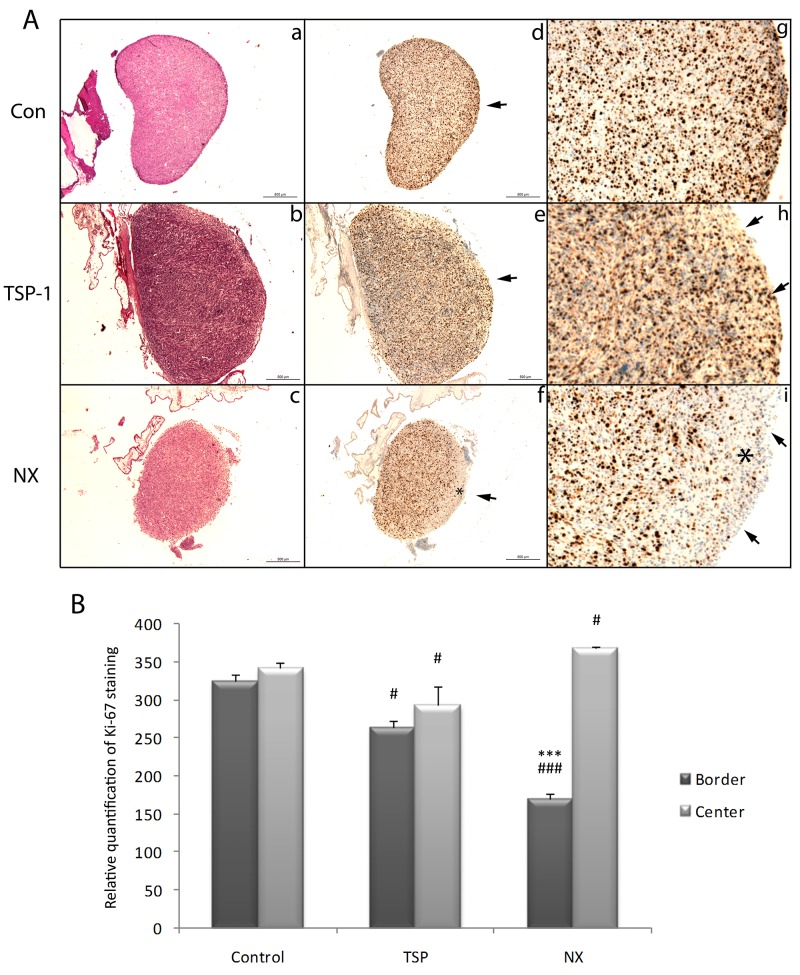
Angiogenesis plays a critical role in glioblastoma growth and progression. We therefore aimed at evaluating the anti-angiogenic properties of an oligopeptide originating from SCO-spondin (NX) on a model of human glioblastoma. To this end, we studied the impact of NX treatment on human brain endothelial cells (HBMECs) alone or co-cultured with glioblastoma cells (U87-MG) on apoptosis, proliferation, migration and release of angiogenic factors. We further investigated the anti-angiogenic potential of NX on human glioblastoma cells grown on chorio-allantoic membrane (CAM) or in glioblastoma xenografts. The results of our experiments showed that NX treatment impaired the microvascular network and induced a decrease in cell proliferation, vascularization and tumor growth in the CAM model as well as in xenotransplants. Interestingly, our in vitro experiments showed that NX impairs HBMECs migration but also regulates the release of angiogenic factors from U87-MG. These results are confirmed by the profiling of NX-treated U87-MG grown on CAM that highlighted modifications of several genes involved in angiogenesis. In conclusion, NX inhibits tumorigenesis by impairing the ability of glioblastoma cells to induce angiogenesis and by inhibiting endothelial cell migration. This molecule might therefore be an interesting candidate for future cancer therapies.

Keywords: NX peptide; SCO-spondin; TSR; glioblastoma; tumor angiogenesis.


Conflict of interest statement

CONFLICTS OF INTEREST No conflicts of interests was disclosed.

Figures

Figure 1
Figure 1
Functional effect of NX in vitro on proliferation, apoptosis and migration of HBMECs analyzed by (A) ELISA Cell Death assays, (B) BrdU Incorporation, (C) migration assay in Boyden chambers and (D) quantification of migration. A and B: Treatments by VEGF, TSP-1, NX were administered separately or in combination in basal medium (BM). Complete medium (CM) and BM were used as controls. P value<0.05 was considered significant. Comparisons between treatments were performed by using analysis of variances (ANOVA). * p<0.05; ** p<0.01; ***p<0.001 compared to BM. C: HBMECs were cultured in BM and seeded in the insert while U87-MG were seeded in the well with FBS free culture medium. HBMECs were treated with TSP-1 (a), NX (b) or H2O (control) (c). U87-MG were treated with TSP-1 (d), NX (e) or H2O (f). D: The number of migrating cells was quantified in 4 random images from each treatment group. Results are presented as mean +/- SEM from 3 independent experiments. Observations were performed using a fluorescent light microscope (magnification x20). Migrating and invading cells are reflected by fluorescent intensity. P value<0.05 was considered significant. *** p<0.001; ### p<0.001: U87-MG treated with H2O vs. U87-MG treated with TSP or NX.
Figure 2
Figure 2. Analysis of angiogenic factors soluble or secreted by HBMECs and U87-MG
HBMECs and U87-MG were treated with H2O (Con), TSP-1 or NX for 24h. Soluble factors from HBMECs supernatants (SN) were analyzed (A); (C) and U87-MG (B); (D) with proteome arrays. Relative quantifications of angiogenic factors released by HBMECs C) and by U87-MG (D) ;D) were normalized by control dots (cs). (E) The changes in VEGF-A release from U87-MG cells were revealed by ELISA and quantified by absorbance determination by spectrophotometry (405/650 nm). Comparisons between NX treatment and control were performed by using analysis of variances (ANOVA). * p<0.05; ** p<0.01 ***p<0.001.
Figure 3
Figure 3. Vascularization of the CAM after treatment for 9h
(A) a, b, c: CAM before treatments; d, e, f: CAM after treatments with H2O, TSP-1 and NX respectively; g, h, i: superficial vessels visualized with FITC-dextran after treatments with H2O, TSP-1 and NX respectively. Scale bars represent 2.04 mm for a, b, c and 1.6 mm for d, e, f, g, h, i. (B) The vascular density was quantified in 4 different images obtained in bright field. P value<0.05 was considered significant. Comparisons between treatments were performed by using analysis of variances (ANOVA). * p<0.05; ** p<0.01; *** p<0.001.
Figure 4
Figure 4. Analysis of tumor angiogenesis on the CAM model and angiogenesis implicated factors on tumors obtained
(A): Macroscopic aspect of tumors treated for 48h with H2O (a, d), TSP-1 (b, e) or NX (c, f), views from the top (a, b and c) and bottom (d, e and f) (scale bars 1 mm) and histological staining of vessels by SNA-lectin (green) and nuclei by DAPI (blue) of tumors treated with H2O (g and j), TSP-1 (h and k) or NX (i and l) (g, h and i: scale bars represent 1 mm; j, k and l: magnifications x2 from g, h and i, respectively). Arrowheads correspond to visible vessels; arrows correspond to the surface treated and stars to areas without vessels. (B): Quantitative analysis of mRNA in tumors grown on the CAM. The different genes are represented by a relative expression compared to control tumors treated with H2O. P value<0.05 was considered significant. * p<0.05; ** p<0.01; *** p<0.001.
Figure 5
Figure 5. Histological and immunohistological analysis of proliferation in tumors from the CAM after treatments
Two treatments with either H2O, 250 µg/mL NX or 10 µg/mL TSP-1 were administered in 48h. Another treatment was administered 24h later. A, B and C: Hematoxylin Eosin Safran stainings of tumors treated with H2O, TSP-1 or NX respectively. D, E and F: Ki-67 immunostaining of tumors treated with H2O, TSP-1 or NX respectively (scale bars 500 µm). G, H and I: magnifications (x2) from D, E and F borders, respectively. Arrows correspond to the surface treated and stars to areas without Ki-67 staining. Ki-67 staining was quantified using Image J and comparisons between treatments and control and between tumor center and border were performed by using analysis of variances (ANOVA test). P value<0.05 was considered significant. * p<0.05; ** p<0.01; *** p<0.001 compared to center of the same tumors; # p<0.05; ## p<0.01; ### p<0.001 compared to control.
Figure 6
Figure 6. NX activity on proliferation, vascularization and tumor growth in mice
Treatments were administered by diluting the compounds in 100 µL hydrogel (CosiGel, Interchim) at a concentration of 250µg/mL for NX and 10µg/mL for TSP-1 before injecting at the periphery of the tumors. 9 animals for each group were used. (A), (B) and (C): Ki-67 immunostaining of tumors treated with H2O, TSP-1 or NX respectively. (G), (H) and (I) CD31 immunostaining (arrowheads) of tumors treated with H2O, TSP-1 or NX respectively (scale bars 500 µm). (D), (E) and (F) are magnifications (x2) from A, B and C; (J), (K) and (L) are magnifications (x2) from G, H and I respectively. (S) and (T) Ki-67 and CD31 stainings were quantified using Image J. Comparisons between treatments and control and between tumor center and border were performed by using analysis of variances (ANOVA test). P value<0.05 is considered significant. * p<0.05 compared to center of the same tumors; # p<0.05; ## p<0.01 compared to control. (M) and (P) tumor from mice after hydrogel treatment alone. (N) and (Q) tumor from mice after TSP treatment. (O) and (R) tumor from mice after NX treatment. (U) Tumor growth measures 5, 12, 17, 19, 21 and 23 days after cell injections. Treatment (hydrogel alone, TSP and NX) injections were realized at day 21 (black arrow). Tumor size in comparison to control’s was performed by using analysis of variances (ANOVA test). ** p<0.01; *** p<0.001.

References

    1. Nabors LB, Fiveash J. Treatment of adults with recurrent malignant glioma. Expert Rev Neurother. 2005;5:509–14. https://doi.org/10.1586/14737175.5.4.509. - DOI - PubMed
    1. Yap R, Veliceasa D, Emmenegger U, Kerbel RS, McKay LM, Henkin J, Volpert OV. Metronomic Low-Dose Chemotherapy Boosts CD95-Dependent Antiangiogenic Effect of the Thrombospondin Peptide ABT-510: A Complementation Antiangiogenic Strategy. Clin Cancer Res. 2005;11:6678–85. https://doi.org/10.1158/1078-0432.CCR-05-0621. - DOI - PubMed
    1. Yee KO, Streit M, Hawighorst T, Detmar M, Lawler J. Expression of the Type-1 Repeats of Thrombospondin-1 Inhibits Tumor Growth Through Activation of Transforming Growth Factor-β. Am J Pathol. 2004;165:541–52. https://doi.org/10.1016/S0002-9440(10)63319-6. - DOI - PMC - PubMed
    1. Iruela-Arispe ML, Lombardo M, Krutzsch HC, Lawler J, Roberts DD. Inhibition of Angiogenesis by Thrombospondin-1 Is Mediated by 2 Independent Regions Within the Type 1 Repeats. Circulation. 1999;100:1423–31. https://doi.org/10.1161/01.CIR.100.13.1423. - DOI - PubMed
    1. Nabors LB, Fiveash JB, Markert JM, Kekan MS, Gillespie GY, Huang Z, Johnson MJ, Meleth S, Kuo H, Gladson CL, Fathallah-Shaykh HM. A phase 1 trial of ABT-510 concurrent with standard chemoradiation for patients with newly diagnosed glioblastoma. Arch Neurol. 2010;67:313–9. https://doi.org/10.1001/archneurol.2010.16. - DOI - PMC - PubMed