. 2017 Nov 21;18(1):890.
doi: 10.1186/s12864-017-4287-0.

Independent impacts of aging on mitochondrial DNA quantity and quality in humans

Affiliations

Independent impacts of aging on mitochondrial DNA quantity and quality in humans

Ruoyu Zhang et al. BMC Genomics. .

Abstract

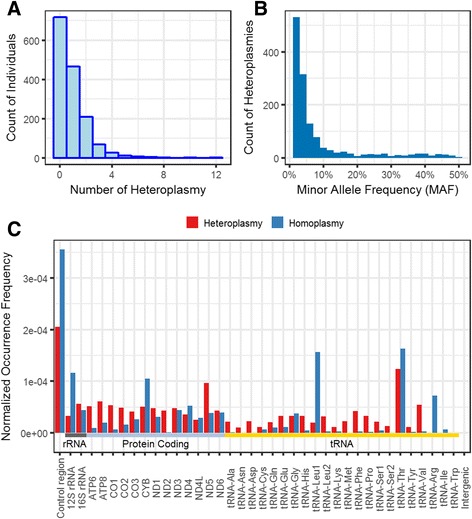
Background: The accumulation of mitochondrial DNA (mtDNA) mutations, and the reduction of mtDNA copy number, both disrupt mitochondrial energetics, and may contribute to aging and age-associated phenotypes. However, there are few genetic and epidemiological studies on the spectra of blood mtDNA heteroplasmies, and the distribution of mtDNA copy numbers in different age groups and their impact on age-related phenotypes. In this work, we used whole-genome sequencing data of isolated peripheral blood mononuclear cells (PBMCs) from the UK10K project to investigate in parallel mtDNA heteroplasmy and copy number in 1511 women, between 17 and 85 years old, recruited in the TwinsUK cohorts.

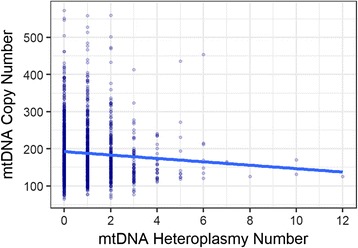
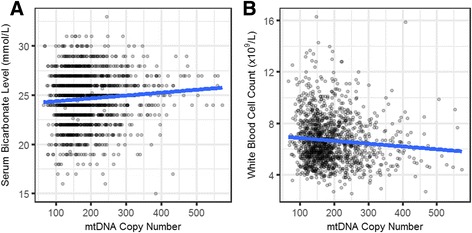
Results: We report a high prevalence of pathogenic mtDNA heteroplasmies in this population. We also find an increase in mtDNA heteroplasmies with age (β = 0.011, P = 5.77e-6), and showed that, on average, individuals aged 70-years or older had 58.5% more mtDNA heteroplasmies than those under 40-years old. Conversely, mtDNA copy number decreased by an average of 0.4 copies per year (β = -0.395, P = 0.0097). Multiple regression analyses also showed that age had independent effects on mtDNA copy number decrease and heteroplasmy accumulation. Finally, mtDNA copy number was positively associated with serum bicarbonate level (P = 4.46e-5), and inversely correlated with white blood cell count (P = 0.0006). Moreover, the aggregated heteroplasmy load was associated with blood apolipoprotein B level (P = 1.33e-5), linking the accumulation of mtDNA mutations to age-related physiological markers.

Conclusions: Our population-based study indicates that both mtDNA quality and quantity are influenced by age. An open question for the future is whether interventions that would contribute to maintain optimal mtDNA copy number and prevent the expansion of heteroplasmy could promote healthy aging.

Keywords: Aging; Heteroplasmy; Whole genome sequencing; mtDNA copy number.


Conflict of interest statement

Ethics approval and consent to participate

All subjects from TwinsUK cohort have ethical approval from the Guy’s and St Thomas’ (GSTT) Ethics Committee (Guy’s and St Thomas’ NHS Foundation Trust), and are compliant with the UK10K Ethical Governance Framework (http://www.uk10k.org/ethics.html).

Consent for publication

Not applicable.

Competing interests

The authors declare that they have no competing interests.

Publisher’s Note

Springer Nature remains neutral with regard to jurisdictional claims in published maps and institutional affiliations.

Figures

Fig. 1
Fig. 1
Distribution of heteroplasmy in UK10K TwinsUK cohort. a Counts of individuals harboring a specific number of heteroplasmies (0–12 heteroplasmies at MAF > 2% cutoff). More than half of individuals (52.5%) carried at least one heteroplasmy in their genome. b Histogram for MAF of all heteroplasmies. 62.7% of heteroplasmies had MAF < 5% and 20.1% had MAF > 10%. c Normalized occurrence frequency distribution of heteroplasmies and homoplasmies. The frequency was normalized by the length of the mitochondrial loci. Dark gray, light blue and yellow bars indicate the genes in three different functional categories: rRNA, Protein coding and tRNA, respectively. The distribution of variants was relatively homogeneous among coding regions, except for some regions, such as higher frequency in ND5 (heteroplasmy) and tRNA Thr (heteroplasmy and homoplasmy)
Fig. 2
Fig. 2
Pathogenic potential for nonsynonymous heteroplasmies. a The box plot of CADD pathogenic score for disease associated mutations, nonsynonymous heteroplasmies and nonsynonymous homoplasmies (heteroplasmy and homoplasmy occurring in multiple individuals were counted only once). Heteroplasmies had significant higher pathogenic scores than homoplasmies (P = 3.967e-7) although still lower than disease associated mutations (P < 2.2e-16). b The cumulative distribution of CADD pathogenic scores of disease associated mutation, homoplasmy, low frequency heteroplasmy (MAF 2%–10%) and high frequency heteroplasmy (MAF > 10%). The distribution of low frequency heteroplasmy was close to disease associated mutations, indicating higher pathogenic potential
Fig. 3
Fig. 3
Distribution of mtDNA copy number in the UK10K Twins cohort and its association with age. a mtDNA copy number was estimated using WGS data by comparing the mean sequencing coverage of mtDNA and nDNA. The distribution of mtDNA copy number was positively skewed, and most individuals had moderate numbers of mtDNA (mean 169 and median 188). b mtDNA copy number was negatively correlated with age (β = −0.395, P = 0.00972). Blue line represents the linear regression line. For every 10 years, mtDNA copy number decreases about 4 copies
Fig. 4
Fig. 4
Association between mtDNA heteroplasmy number and copy number. mtDNA copy number was significantly associated with the total heteroplasmy number within an individual, adjusting for age and mean nuclear sequencing coverage (β = −4.34, P = 0.007). Individuals harboring higher numbers of heteroplasmies were more likely to have low mtDNA copy number
Fig. 5
Fig. 5
mtDNA copy number association with phenotypic traits. a mtDNA copy number was positively associated with serum bicarbonate level (P = 4.46e-5). The reference range for bicarbonate level is 22–29 mmol/L (b) mtDNA copy number was negatively associated with WBC count (P = 0.0006). The reference range for WBC count is 4.0–11.0 (×109/L). The blue lines represent linear regression lines in each case

References

    1. Schon EA, DiMauro S, Hirano M. Human mitochondrial DNA: roles of inherited and somatic mutations. Nat Rev Genet. 2012;13(12):878–890. doi: 10.1038/nrg3275. - DOI - PMC - PubMed
    1. Stewart JB, Chinnery PF. The dynamics of mitochondrial DNA heteroplasmy: implications for human health and disease. Nat Rev Genet. 2015;16(9):530–542. doi: 10.1038/nrg3966. - DOI - PubMed
    1. Picard M, Wallace DC, Burelle Y. The rise of mitochondria in medicine. Mitochondrion. 2016;30:105–116. doi: 10.1016/j.mito.2016.07.003. - DOI - PMC - PubMed
    1. Calvo SE, Clauser KR, Mootha VK. MitoCarta2.0: an updated inventory of mammalian mitochondrial proteins. Nucleic Acids Res. 2016;44(D1):D1251–D1257. doi: 10.1093/nar/gkv1003. - DOI - PMC - PubMed
    1. Lane N, Martin W. The energetics of genome complexity. Nature. 2010;467(7318):929–934. doi: 10.1038/nature09486. - DOI - PubMed

Substances