. 2018 Jan:114:161-174.
doi: 10.1016/j.yjmcc.2017.11.012. Epub 2017 Nov 20.

Resident fibroblast expansion during cardiac growth and remodeling

Affiliations

Resident fibroblast expansion during cardiac growth and remodeling

Malina J Ivey et al. J Mol Cell Cardiol. 2018 Jan.

Abstract

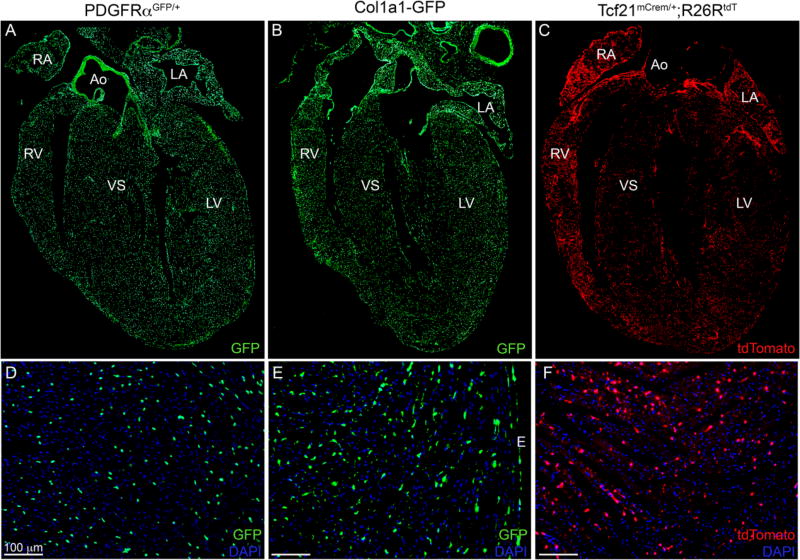
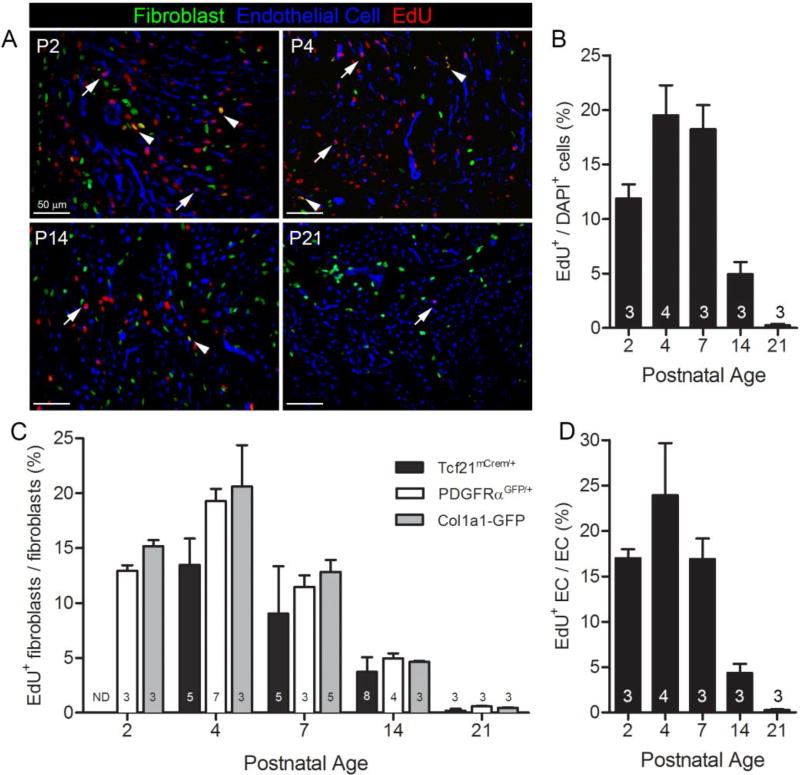
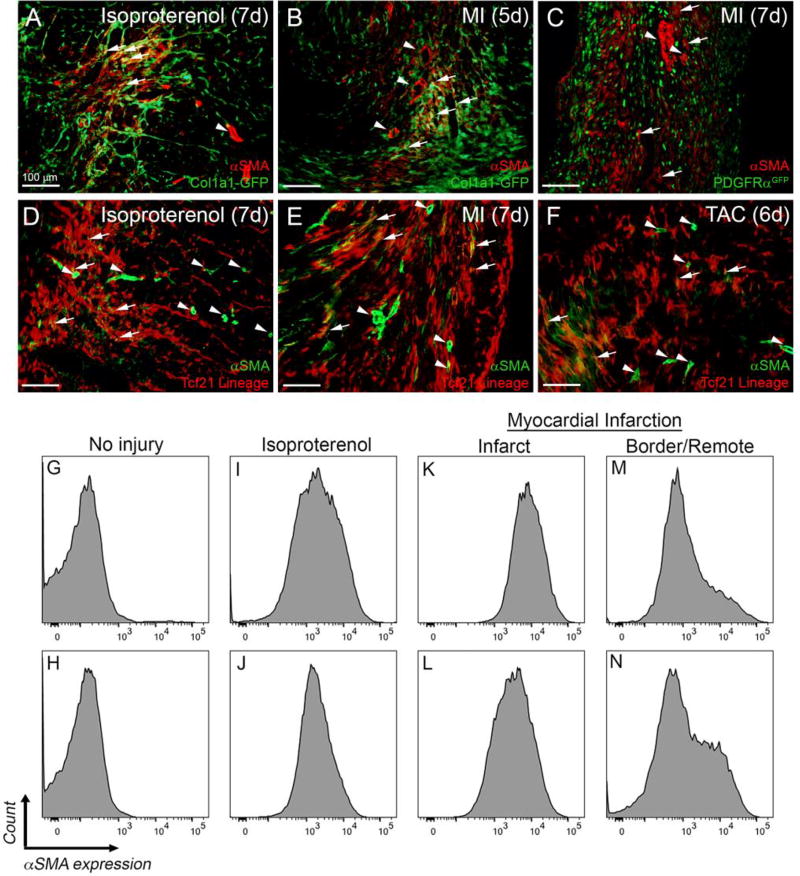
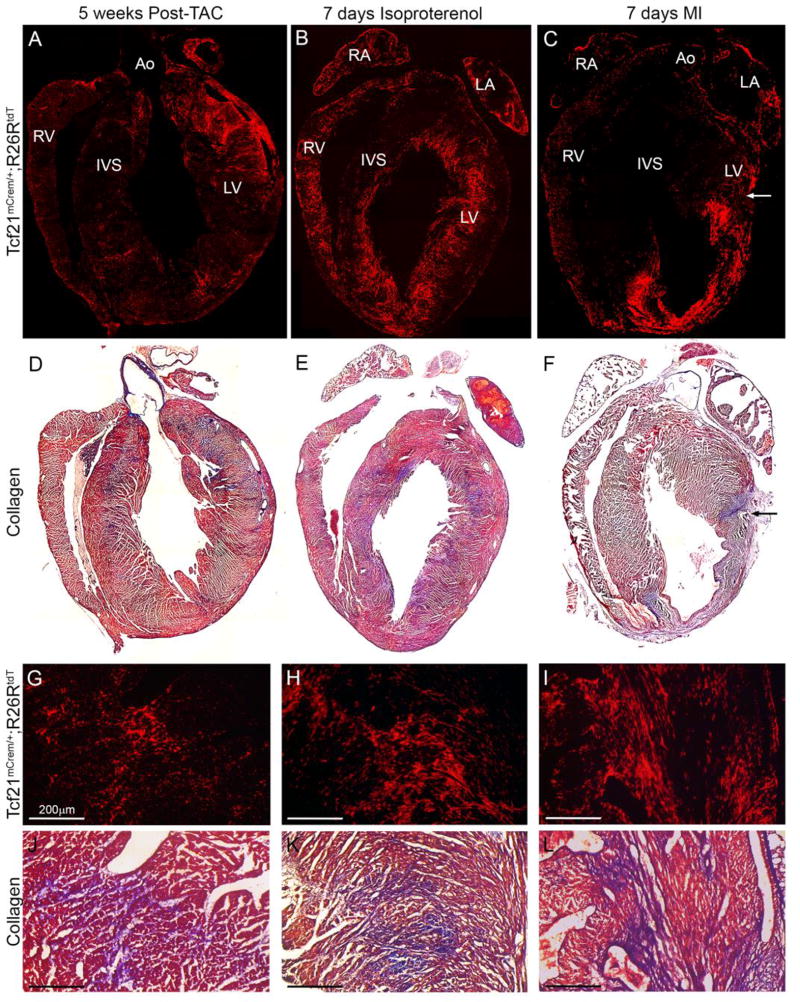
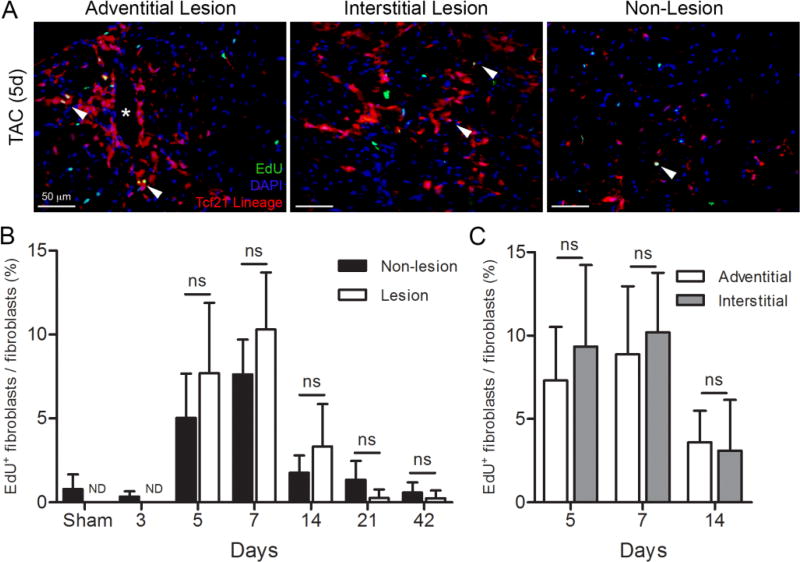
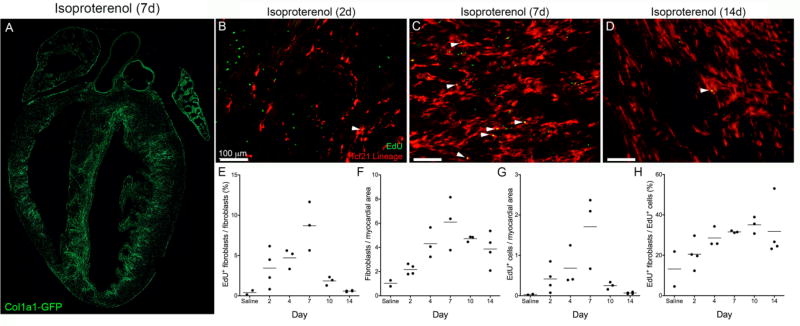
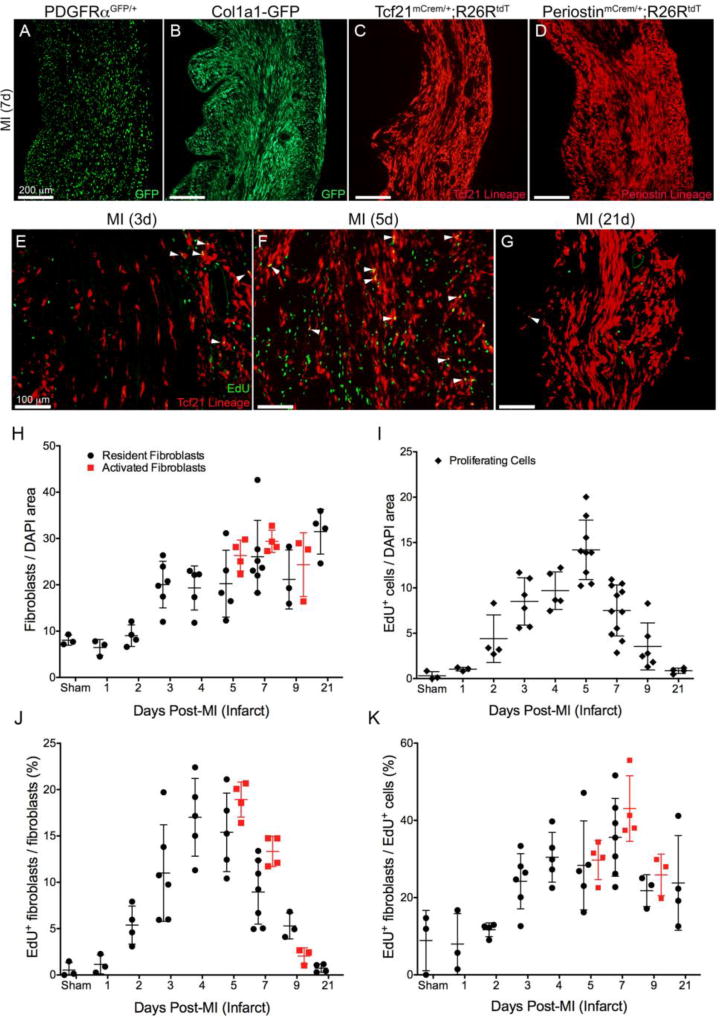
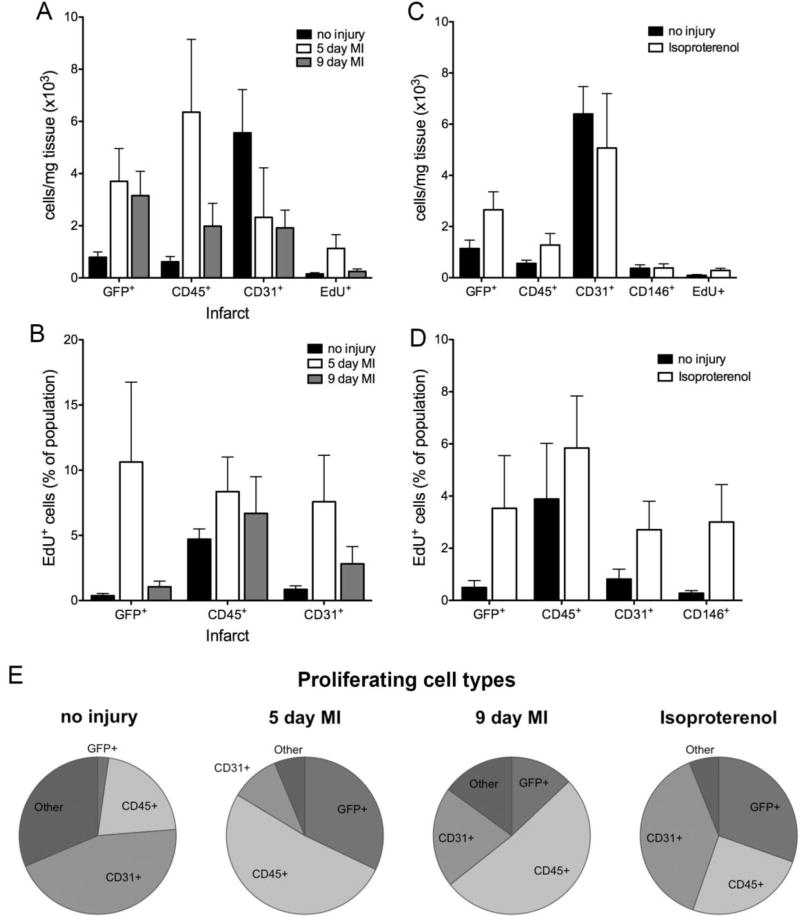
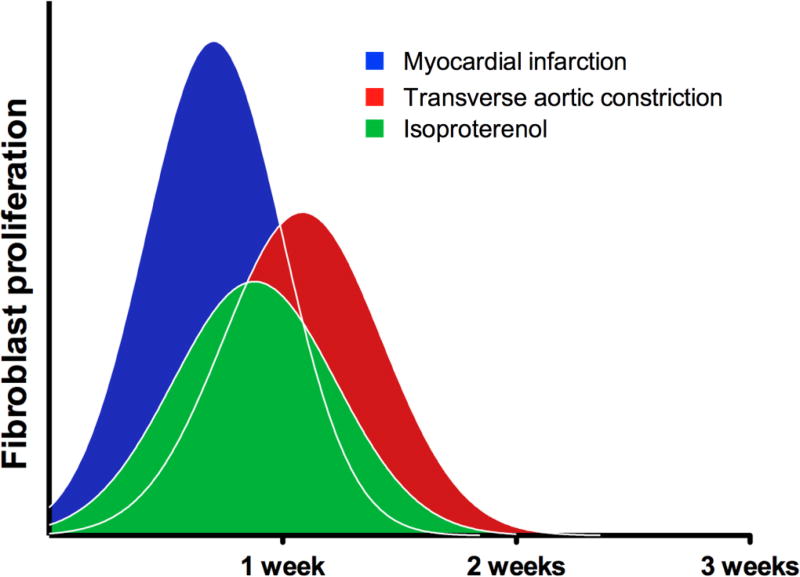
Cardiac fibrosis, denoted by the deposition of extracellular matrix, manifests with a variety of diseases such as hypertension, diabetes, and myocardial infarction. Underlying this pathological extracellular matrix secretion is an expansion of fibroblasts. The mouse is now a common experimental model system for the study of cardiovascular remodeling and elucidation of fibroblast responses to cardiac growth and stress is vital for understanding disease processes. Here, using diverse but fibroblast specific markers, we report murine fibroblast distribution and proliferation in early postnatal, adult, and injured hearts. We find that perinatal fibroblasts and endothelial cells proliferate at similar rates. Furthermore, regardless of the injury model, fibroblast proliferation peaks within the first week after injury, a time window similar to the period of the inflammatory phase. In addition, fibroblast densities remain high weeks after the initial insult. These results provide detailed information regarding fibroblast distribution and proliferation in experimental methods of heart injury.

Keywords: Cardiac fibroblast; Endothelial cell; Fibrosis; Proliferation.


Figures

Figure 1
Figure 1. Fibroblast specific mouse lines
(A–C) 4 chamber view of (A) PDGFRαGFP/+ (9 weeks), (B) Col1a1-GFP (25 weeks), and (C) Tcf21mCrem/+; R26RtdT (18 weeks) hearts. (D–F) Higher magnification of left ventricular free wall from different hearts. (D) PDGFRαGFP/+ (5 weeks), (E) Col1a1-GFP (25 weeks) (F) Tcf21mCrem/+; R26RtdT (8 weeks). Tcf21mCrem/+ mice were induced (C) for two weeks by tamoxifen chow (F) for two days by tamoxifen gavage. Ao: aorta; LA: left atria; RA: right atria; LV: left ventricle; RV: right ventricle; IVS: interventricular septum; E: epicardium. Scale bars: 100µm.
Figure 2
Figure 2. Fibroblast and endothelial cell proliferation in perinatal hearts
(A) Representative images at indicated postnatal time points. Fibroblasts: PDGFRαGFP (green); endothelial cells: isolectin B4 (blue); and proliferating cells: EdU+ (red). Arrows indicate proliferating endothelial cells. Arrowheads indicate proliferating fibroblasts. (B) Overall proliferation rate of cells in PDGFRαGFP/+ hearts. (C) Quantification of proliferation index in PDGFRαGFP, Col1a1-GFP, and Tcf21mCrem/+;R26RtdT labeled fibroblasts. (D) Postnatal endothelial cell proliferation index. ND: not determined. Numbers within bar graphs represent biological replicate n values. Results are mean ± SD. Scale bars: 50µm.
Figure 3
Figure 3. αSMA expression in fibroblast-tagged hearts after injury
(A–B) Representative images of αSMA staining in Col1a1-GFP hearts. (C) Representative images of αSMA staining in PDGFRαGFP/+ hearts. (D–F) Representative images of αSMA staining in Tcf21mCrem/+; R26RtdT hearts. Arrows indicate examples of αSMA staining in fibroblasts identified by the indicated fluorescent tag. Arrowheads indicate a blood vessels with αSMA+ coronary vascular smooth muscle cells. Scale bars: 100µm. (G–N) Representative flow cytometry histograms of αSMA expression in GFP+ fibroblasts isolated from (G, I, K, M) Col1a1-GFP and (H, J, L, N) PDGFRαGFP/+ hearts at (G–H) baseline, (I–J) after 7 days of isoproterenol injections, and 5 days after MI (K–L) in the infarct and (M–N) border/remote area.
Figure 4
Figure 4. Tcf21 lineage tagged cells and collagen deposition after injury
(A–C) 4 chamber view of Tcf21 lineage tagged cells (red) at the indicated time points of injury. (D–F) 4 chamber view of Gomori’s trichrome staining of hearts in A–C. (blue: collagen deposition) Arrow indicates the suture site. (G–I) Higher magnification of Tcf21 lineage tagged cells and (J–L) Gomori’s trichrome staining of adjacent sections of (G–I) (blue: collagen deposition). Ao: aorta; LA: left atria; RA: right atria; LV: left ventricle; RV: right ventricle; IVS: interventricular septum. Scale bars: 200µm.
Figure 5
Figure 5. Fibroblast proliferation after pressure overload
(A) Representative images of an adventitial, interstitial lesion, and a non-lesion area in a Tcf21mCrem/+; R26RtdT heart 5 days after transverse aortic constriction (TAC). Fibroblasts: tdTomato (red); nuclei: DAPI (blue), and proliferating cell: EdU+ (green). Arrowheads indicate proliferating fibroblasts. Asterisk indicates a blood vessel. (B) Quantification of percent fibroblast proliferation in lesion and non-lesion areas. (C) Quantification of percent fibroblast proliferation in adventitial and interstitial lesions. n=3–5 mice per group. ND: not determined. ns: not significant; unpaired student’s t-test. Results are mean ± SD. Scale bars: 50µm.
Figure 6
Figure 6. Fibroblast proliferation after isoproterenol injection
(A) Four chamber view of endocardial fibroblast expansion 7 days of isoproterenol treatment in a Col1a1-GFP heart. Fibroblasts: GFP (green). (B–D) Tcf21 lineage tagged fibroblasts and EdU labeled proliferating cells after (B) 2, (C) 7 and (D) 14 days of isoproterenol injections. Fibroblasts: tdTomato (red); proliferating cell: EdU (green). Arrowheads indicate proliferating fibroblasts. (E) Percent of proliferating fibroblasts, (F) number of fibroblasts, (G) number of proliferating cells, (H) percent of proliferating cells that are fibroblasts. All quantifications were a minimum of five fields of view from two non-sequential sections in at least two biologic replicates and were normalized to myocardial area where applicable. Each point represents the average of one biological replicate. Scale bars: 100µm.
Figure 7
Figure 7. Fibroblast proliferation after myocardial infarction
Resident fibroblast expansion in left ventricular free wall 7 days after LAD ligation using fibroblast lines (A) PDGFRαGFP, (B) Collagen1a1-GFP, (C) Tcf21mCrem/+; R26RtdT or (D) POSTNmCrem/+; R26RtdT. (E–G) Proliferation of Tcf21 lineage-tagged fibroblasts (E) 3 days post-MI, (F) 5 days post-MI and (G) 21 days post-MI. Fibroblasts: tdTomato (red); proliferating cell: EdU (green). Arrowheads indicate proliferating fibroblasts. (H) Number of fibroblasts (I) number of proliferating cells (J) percent of fibroblasts that are proliferating and (K) percent of proliferating cells that are fibroblasts. Resident fibroblasts: PDGFRαGFP, Collagen1a1-GFP or Tcf21 lineage (black circles); activated fibroblasts: periostin lineage (red squares); proliferating cell: EdU+ (black diamonds). Results are mean ± SD. Each point represents the average of one biological replicate normalized to nuclear area where applicable. Scale bars: (A–D) 100µm and (E–G) 200µm.
Figure 8
Figure 8. Flow cytometry of cell populations after injury
(A, C) Cell numbers determined by flow cytometry after (A) myocardial infarction (infarct) or (C) isoproterenol treatment (day 7; both ventricles). (B, D) Proliferation by cell type after (B) myocardial infarction (infarct) or (D) isoproterenol treatment (day 7; both ventricles). For no injury, left ventricle was isolated in the MI controls, and both ventricles were isolated for isoproterenol controls. (E) Distribution of each cell type within the proliferating cell population after the indicated treatments. Proliferating cell: EdU+; immune cell: CD45+; endothelial cell: CD31+; pericyte: CD146+/CD31/CD45/GFP; other: CD31/CD45/GFP; fibroblast: Col1a1-GFP+ (MI) and Col1a1-GFP+ or PDGFRαGFP+ cells (isoproterenol). n=4–6 mice per group. Results are mean ± SD.
Figure 9
Figure 9. Fibroblast proliferation profiles after injury
Schematic of fibroblast proliferation suggesting general patterns of proliferation after injury. Within these experimental parameters peak fibroblast proliferation is around the first week after injury and rapidly returns to basal levels.

References

    1. Weber KT, Sun Y, Bhattacharya SK, Ahokas RA, Gerling IC. Myofibroblast-mediated mechanisms of pathological remodelling of the heart. Nat Rev Cardiol. 2013;10:15–26. - PubMed
    1. Kanisicak O, Khalil H, Ivey MJ, Karch J, Maliken BD, Correll RN, et al. Genetic lineage tracing defines myofibroblast origin and function in the injured heart. Nat Commun. 2016;7:12260. - PMC - PubMed
    1. Molkentin JD, Bugg D, Ghearing N, Dorn LE, Kim P, Sargent MA, et al. Fibroblast-Specific Genetic Manipulation of p38 MAPK in vivo Reveals its Central Regulatory Role in Fibrosis. Circulation. 2017 - PMC - PubMed
    1. Kaur H, Takefuji M, Ngai C, Carvalho J, Bayer J, Wietelmann A, et al. Targeted Ablation of Periostin-Expressing Activated Fibroblasts Prevents Adverse Cardiac Remodeling in Mice. Circ Res. 2016 - PubMed
    1. Gourdie RG, Dimmeler S, Kohl P. Novel therapeutic strategies targeting fibroblasts and fibrosis in heart disease. Nat Rev Drug Discov. 2016;15:620–38. - PMC - PubMed

Publication types

MeSH terms

LinkOut - more resources