. 2017 Dec 4;216(12):4123-4139.
doi: 10.1083/jcb.201610057. Epub 2017 Nov 20.

Receptor-mediated Drp1 oligomerization on endoplasmic reticulum

Affiliations

Receptor-mediated Drp1 oligomerization on endoplasmic reticulum

Wei-Ke Ji et al. J Cell Biol. .

Abstract

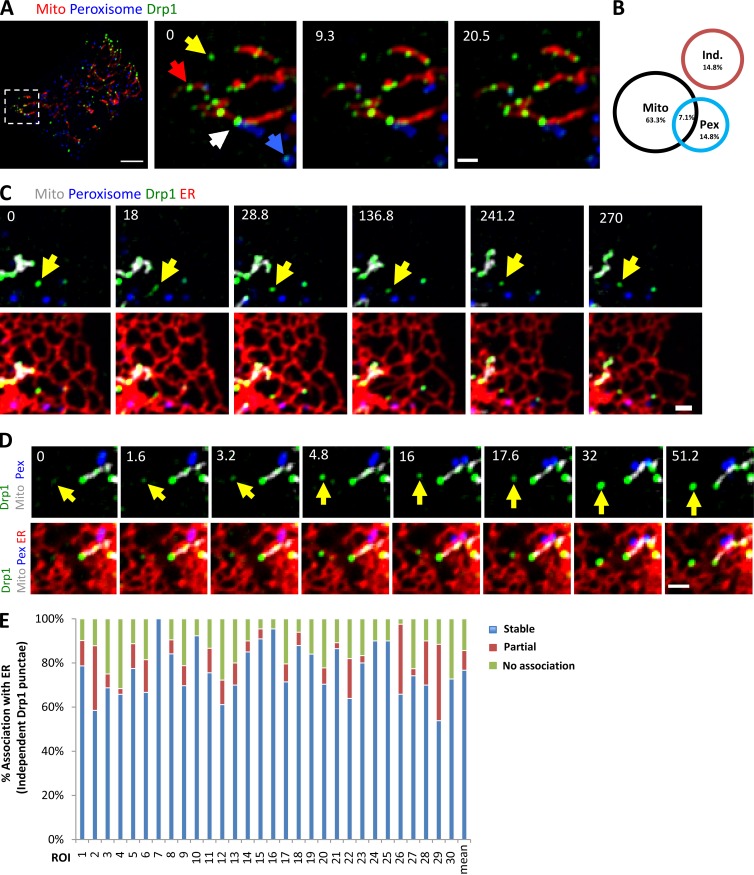
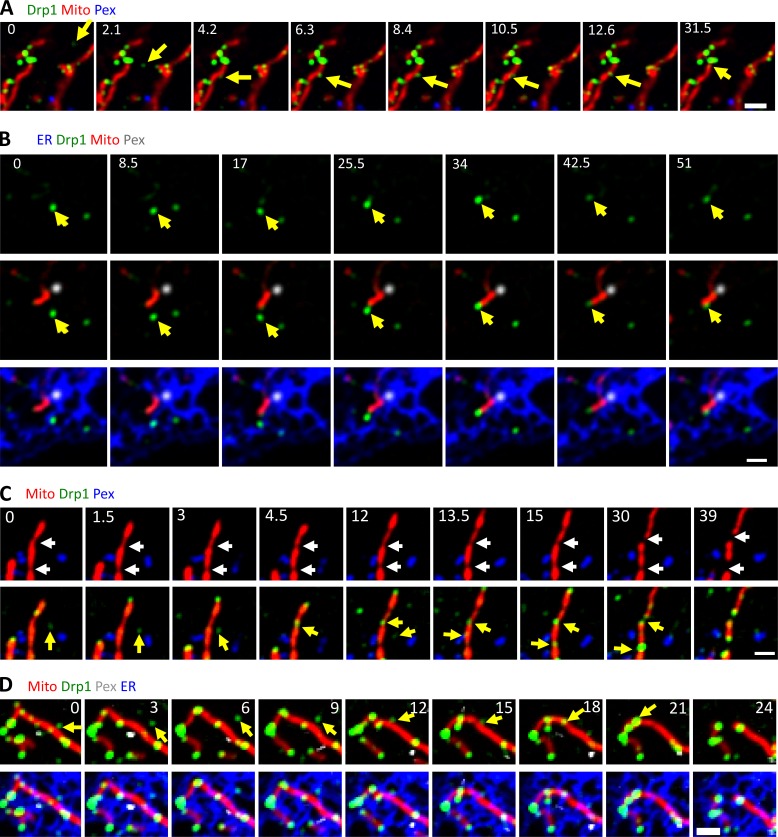
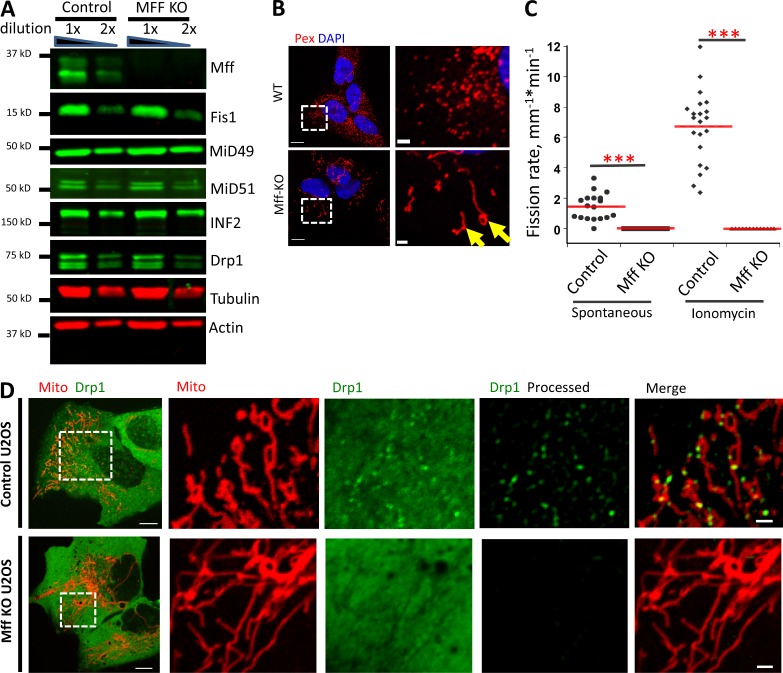
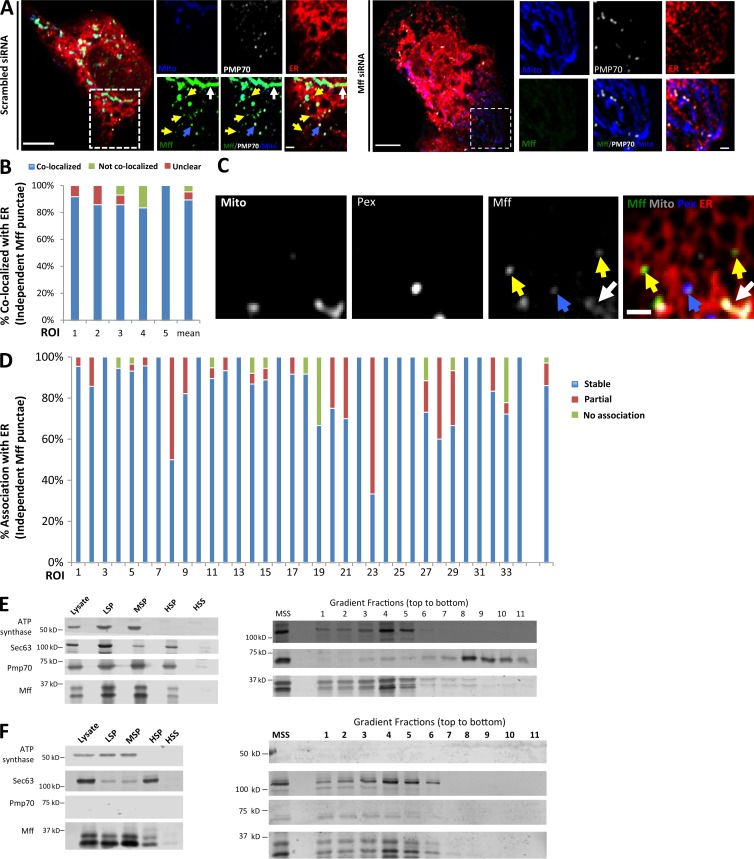
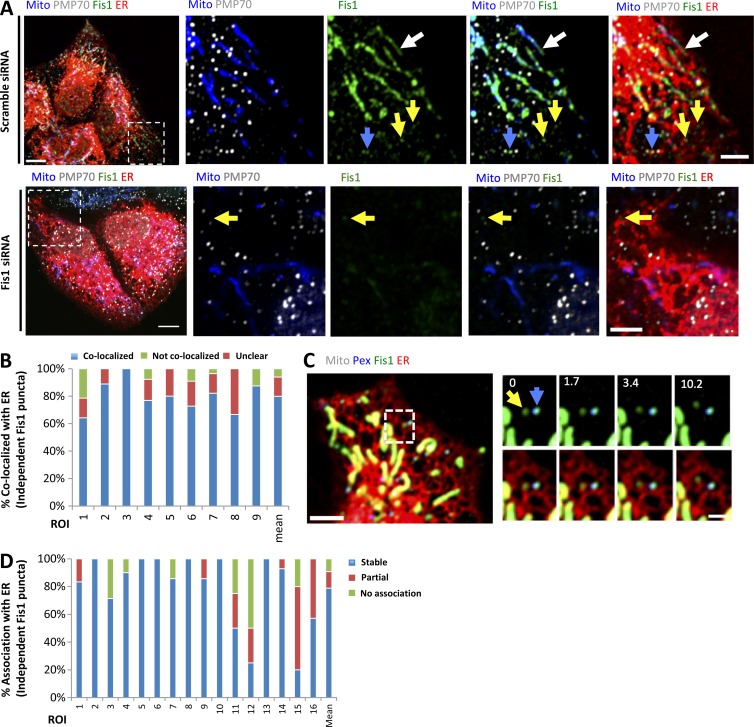
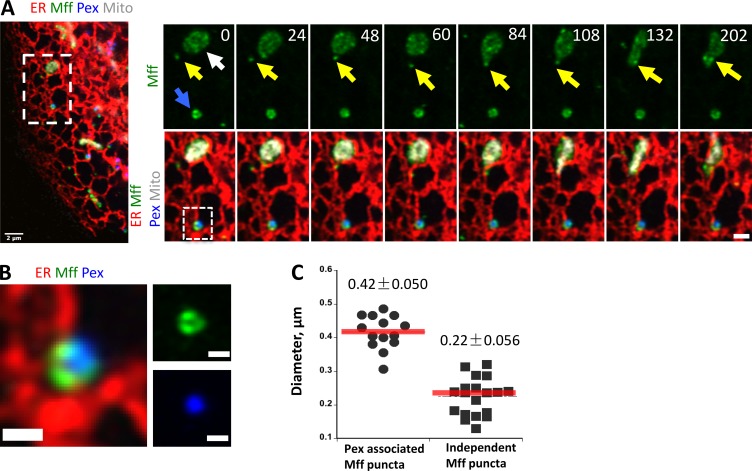
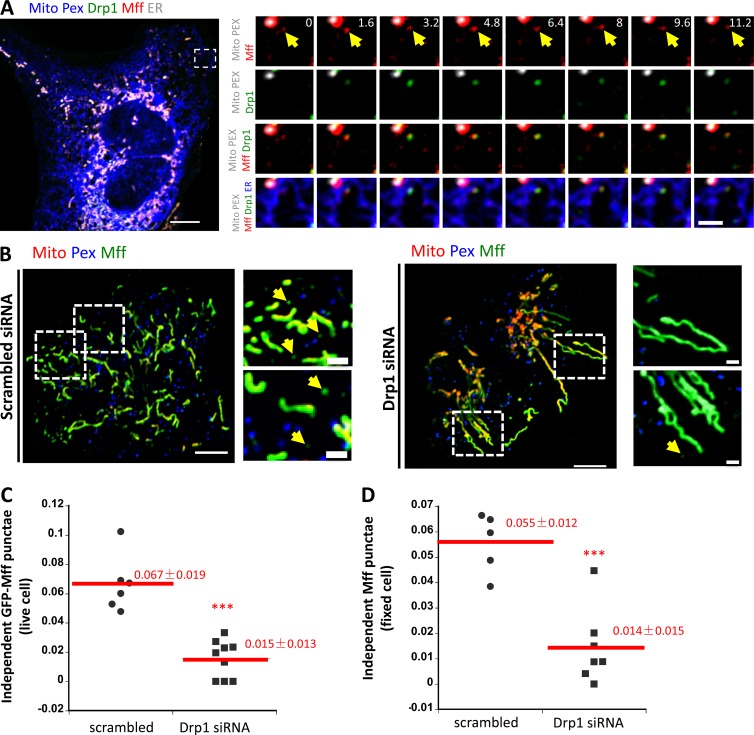
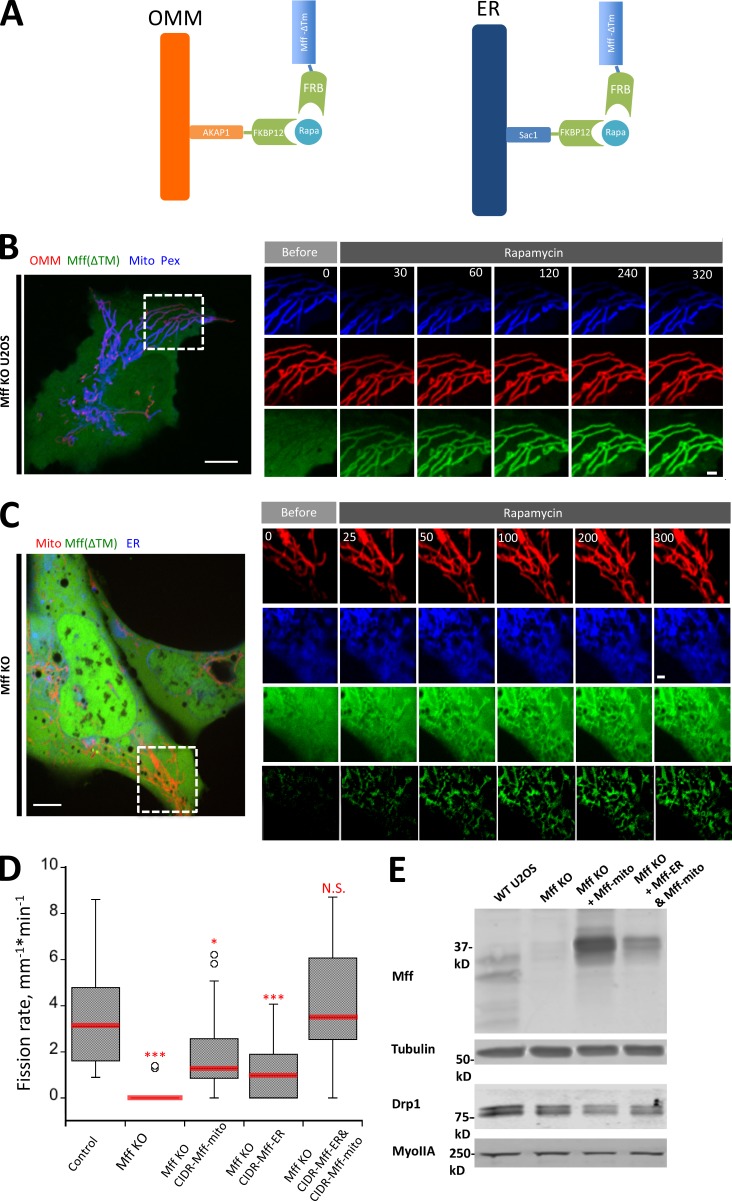
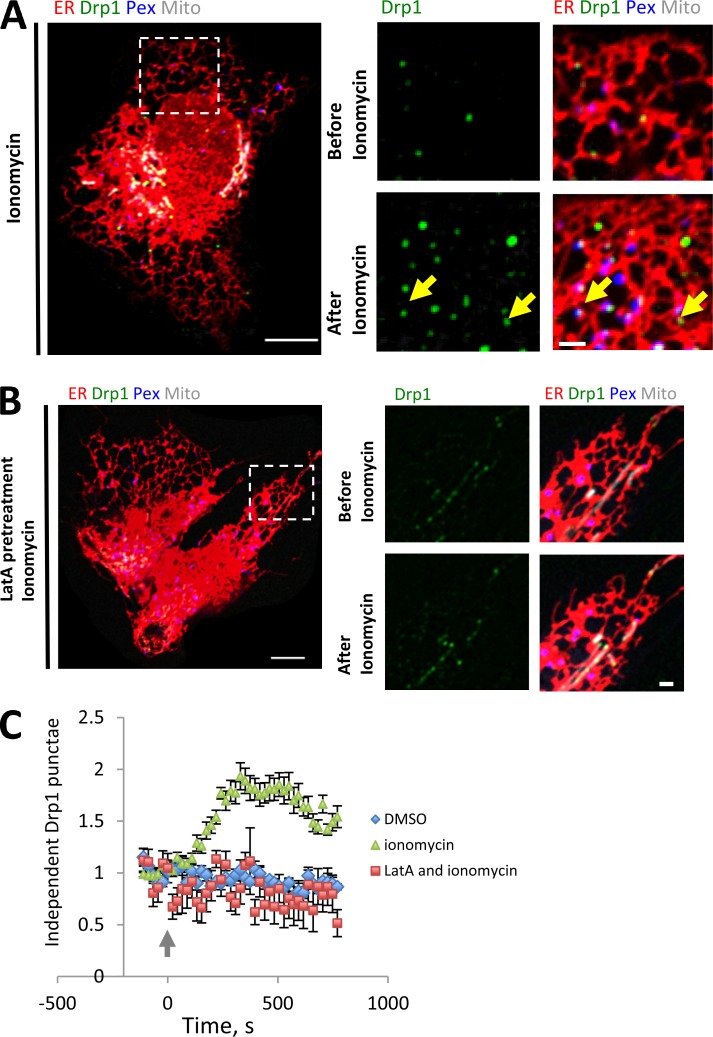
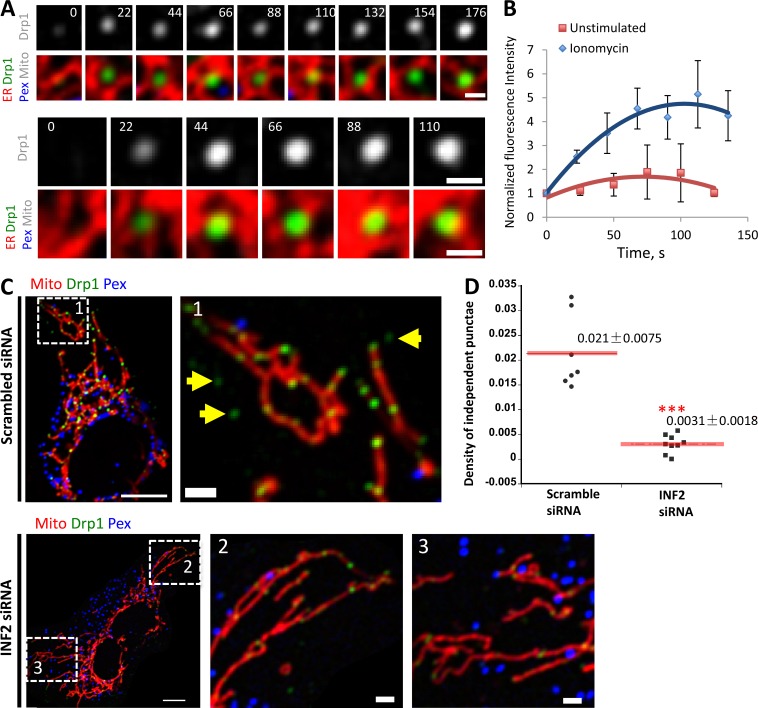
Drp1 is a dynamin guanosine triphosphatase important for mitochondrial and peroxisomal division. Drp1 oligomerization and mitochondrial recruitment are regulated by multiple factors, including interaction with mitochondrial receptors such as Mff, MiD49, MiD51, and Fis. In addition, both endoplasmic reticulum (ER) and actin filaments play positive roles in mitochondrial division, but mechanisms for their roles are poorly defined. Here, we find that a population of Drp1 oligomers is associated with ER in mammalian cells and is distinct from mitochondrial or peroxisomal Drp1 populations. Subpopulations of Mff and Fis1, which are tail-anchored proteins, also localize to ER. Drp1 oligomers assemble on ER, from which they can transfer to mitochondria. Suppression of Mff or inhibition of actin polymerization through the formin INF2 significantly reduces all Drp1 oligomer populations (mitochondrial, peroxisomal, and ER bound) and mitochondrial division, whereas Mff targeting to ER has a stimulatory effect on division. Our results suggest that ER can function as a platform for Drp1 oligomerization, and that ER-associated Drp1 contributes to mitochondrial division.


Figures

Figure 1.
Figure 1.
A population of Drp1 associates with ER independently of mitochondria or peroxisomes. (A) Drp1 distribution in GFP-Drp1-KI cells. Left: Merged image of a live Drp1 KI cell transiently expressing mCherry-mito7 (red) and eBFP2-peroxisome (blue). Drp1 in green. Right: Insets from boxed region at three time points. Yellow arrow, independent Drp1 puncta; blue arrow, peroxisome-associated Drp1; red arrow, mitochondrially associated Drp1; white arrowhead, example of Drp1 puncta localizing at the interface of mitochondrion and peroxisome. (B) Venn diagram of Drp1 distribution in GFP-Drp1-KI cells expressing mitochondrial and peroxisomal markers. Black circles, mitochondrially associated Drp1 punctae; blue circles, peroxisomal associated Drp1 punctae (Pex); red circles, independent Drp1 punctae (Ind). The percentage of Drp1 punctae in each category is the mean from 10 consecutive frames with 12-s time intervals from whole-cell videos. Five cells measured (10,761 punctae). (C) Four-color imaging of a live Drp1 KI cell expressing mPlum-mito3 (Mito, gray); eBFP2-peroxisome (Peroxisome, blue); and ER-tagRFP (ER, red); Drp1 in green. Yellow arrows denote independent Drp1 puncta stably associating with ER. See also Video 1. (D) Time-lapse montage showing de novo assembly of an independent Drp1 punctum (yellow arrow) on an ER tubule. Imaging as in C. (E) Graph depicting the degree of association between independent Drp1 punctae and ER during 2.5-min videos imaged every 1.6 s. 30 ROIs from 25 GFP-Drp1-KI cells analyzed (1,003 punctae). Mean values from ROIs: 76.7 ± 11.7%, stable association between Drp1 punctae and ER (no apparent dissociation from ER in any frame); 8.9 ± 9.5%, partial association; 14.4 ± 8.0%, no association. Bars: (A, whole-cell image) 10 µm; (A, inset; C; and D) 2 µm. Time in seconds.
Figure 2.
Figure 2.
Transfer of Drp1 punctae from ER to mitochondria. (A) Three-color time-lapse images of live GFP-Drp1-KI cell expressing mCherry-mito7 (mitochondria, red), eBFP2-peroxisome (peroxisome, blue), and Drp1 in green. An independent Drp1 puncta (yellow arrow) transfers to a mitochondrion and then translocates along the mitochondrion with no division in the observation time period. See also Video 2. (B) Four-color time-lapse images of live GFP-Drp1-KI cell expressing mito-BFP (mitochondria, gray), mPlum-peroxisome (peroxisome, blue), ER-tagRFP (ER, red) and GFP-Drp1 in green. Yellow arrow denotes an ER-bound Drp1 puncta transferring to mitochondrion. See also Video 3. (C) Three-color time-lapse images of live GFP-Drp1-KI cell expressing mCherry-mito7 (mitochondria, red), eBFP2-peroxisome (peroxisome, blue), and Drp1 in green. Two Drp1 punctae transfer to constriction sites, followed by division. Cells treated with ionomycin (4 µM) to stimulate mitochondrial division. See also Video 4. (D) Four-color time-lapse images of live GFP-Drp1-KI cell expressing mito-BFP (mitochondria, red), mPlum-PMP20 (peroxisome, gray), ER-tagRFP (ER in blue) and GFP-Drp1 in green. Yellow arrow denotes an independent Drp1 puncta transferring to mitochondrion. Cells treated with ionomycin (4 µM) to stimulate mitochondrial division. See also Video 5. Bars, 2 µm. Time in seconds.
Figure 3.
Figure 3.
Mff KO U2OS cells are deficient in mitochondrial and peroxisomal division. (A) Western blotting for Mff and other mitochondrial division proteins in control and Mff KO U2OS cells. (B) Immunofluorescence of fixed cells stained for peroxisomes (red) and DNA (DAPI, blue). Images on right are zoomed regions. Yellow arrows indicate elongated peroxisomes in Mff KO cells. (C) Division rate quantification for both control and Mff KO U2OS cells. For the quantification of spontaneous division rate, 18 ROIs analyzed for either 12 (control) or 14 (Mff KO) cells. For quantification of ionomycin-induced division rate, 21 ROIs (control) and 13 ROIs (Mff KO) were analyzed. ***, P < 0.001 by Student’s t test. (D) Live-cell images of control (top) or Mff KO (bottom) U2OS cells transfected with GFP-Drp1 (green) and mito-RFP (red). Right panels show ROI of selected region (boxed). Raw images shown, except for the rightmost images, which are processed to reveal Drp1 punctae. Bars: (left) 20 µm; (right) 2 µm.
Figure 4.
Figure 4.
A subpopulation of Mff localizes to ER. (A) Endogenous Mff localization in a fixed U2OS cell by immunofluorescence. Cells labeled with anti-Tom20 (mitochondria, blue), anti-PMP70 (peroxisomes, gray), anti-Mff (green) and transfected with ER-TagRFP (ER, red). Left, scrambled siRNA; right, Mff siRNA. Yellow arrows, independent punctae; blue arrow, peroxisome-associated puncta; white arrow, mitochondrially associated Mff. (B) Graph depicting the percentage of colocalization between independent Mff punctae and ER in U2OS cells (endogenous Mff). 54 independent Mff punctae were counted from five ROIs from four cells. Mean values from ROIs: 89.3 ± 6.7%, colocalized Mff with ER; 6.0 ± 6.1%, not colocalized; 4.8 ± 7.3%, unclear localization. (C) Live-cell time-lapse of GFP-Mff-S (green) in U2OS cell also expressing mCherry-mito3 (gray), eBFP2-peroxisome (blue), and E2-Crimson-ER (red). Yellow arrows, independent Mff punctae associating with ER; blue and gray arrows, peroxisomal and mitochondrial Mff, respectively. See also Video 6. (D) Graph depicting the degree of association between independent GFP-Mff-S punctae and ER from live-cell videos as in C (2.5-min videos imaged every 1.5 s). 34 ROIs from 30 U2OS cells analyzed (441 independent Mff punctae). Mean values from ROIs: 86.1 ± 17.1%, stably associated Mff punctae with ER; 11.0 ± 16.8%, partially associated; 4.6 ± 9.4%, not associated. (E) U2OS fractionation. Left: LSP, MSP, and HSP are low, medium, and high-speed pellets; HSS, high-speed supernatant. Marker proteins are ATP synthase, mitochondria; Sec63, ER; and Pmp70, peroxisomes. Right) Sucrose gradient fractionation of the medium-speed supernatant (MSS). (F) Human PEX3-deficient fibroblast fractionation, similar to U2OS fractionation. Bars: (B, whole cell image) 10 µm; (B, inset; and D) 2 µm. Time in seconds.
Figure 5.
Figure 5.
A subpopulation of Fis1 localizes to ER. (A) Endogenous Fis1 localization in fixed U2OS cells by immunofluorescence. Cells labeled with anti-Tom20 (mitochondria, blue), anti-PMP70 (peroxisomes, gray), and anti-Fis1 (green) and transfected with ER-TagRFP (ER, red). Left, scrambled siRNA; right, Fis1 siRNA. Yellow arrows, independent punctae; blue arrow, peroxisome-associated puncta; white arrow, mitochondrially associated Fis1. (B) Graph depicting the percentage of colocalization between independent Fis1 punctae and ER in U2OS cells by immunofluorescence (endogenous Fis1). 117 independent Fis1 punctae counted from nine ROIs from four cells. Mean values from ROIs: 79.9 ± 11.3%, colocalized Fis1 punctae with ER; 6.0 ± 7.4%, not colocalized; 14.1 ± 10.2%, unclear localization. (C) Live-cell time-lapse of GFP-Fis1 in U2OS cell also expressing mCherry-mito3 (gray), eBFP2-peroxisome (blue), and E2-Crimson-ER (red). Right: Individual frames from the time course of boxed region, showing independent Fis1 punctae associated with ER (yellow arrow) next to a peroxisome that is positive for Fis1 (blue arrow). (D) Graph depicting the degree of association between independent GFP-Fis1 punctae and ER from live-cell videos as in C (2.5-min videos imaged every 1.7 s). 16 ROIs from 15 U2OS cells (100 independent Fis1 punctae) analyzed. Mean values from ROIs: 78.8% ± 26.9%, stably associated Fis1 punctae with ER; 11.9 ± 18.2%, partially associated; 9.2 ± 14.8%, not associated. Bars: (A and C, whole-cell images) 10 µm; (A, inset) 5 µm; (C, inset) 2 µm inset. Time in seconds.
Figure 6.
Figure 6.
Dynamics of Mff on ER. (A) Independent Mff punctae dynamics (Airyscan microscopy time-lapse). Left: Merged image of a live U2OS cell expressing ER-tagRFP (ER, red), GFP-Mff-S (green), eBFP2-Peroxisome (blue), and mPlum-mito3 (gray). Right: Time-lapse series of the inset, with independent Mff punctum associating with ER then transferring to mitochondrion (yellow arrow). Blue arrow, peroxisomally associated Mff; white arrow, mitochondrial Mff. Bars: (left) 2 µm; (inset) 1 µm. Time in seconds. See also Video 7. (B) Zoom of A, showing heterogeneous nature of peroxisomally associated Mff. Bars, 0.5 µm. (C) Dot plot showing diameter of peroxisomal Mff and independent Mff punctae from Airyscan images. 14 peroxisomal Mff (0.42 ± 0.050 µm) and 19 independent Mff punctae (0.22 ± 0.056) analyzed.
Figure 7.
Figure 7.
Association between Drp1 and Mff on ER. (A) Left: Merged confocal image of a live GFP-Drp1-KI cell expressing mito-BFP (gray), eBFP2-peroxisome (gray), mStrawberry-Mff-S (red), and pLVX-E2-Crimson-ER (blue). Drp1 in green. Right: Time-lapse confocal images of boxed region show example of a Drp1 puncta maturing from an independent Mff puncta (yellow arrows). See also Video 8. (B) Independent Mff punctae in scramble siRNA–treated cells (left) and Drp1 siRNA–treated cells (right). Left: Merged image of live U2OS cells transiently expressing GFP-Mff-S (Mff, green), eBFP2-peroxisome (Pex, blue), and mCherry-mito7 (Mito, red). Right: Insets from boxed regions in whole-cell image. Yellow arrows denote independent Mff punctae. (C) Density of independent Mff punctae in control siRNA– and Drp1 siRNA–treated U2OS cells, quantified from live-cell images of GFP-Mff as in B. Units, number of independent Mff punctae per square micrometer in the ROI. 368 independent punctae from nine control cell ROIs and 106 punctae from nine Drp1 KD cell ROIs. ***, P < 0.0001 by Student’s t test. (D) Density of independent Mff punctae in control siRNA– and Drp1 siRNA–treated U2OS cells, quantified from fixed-cell immunofluorescence of endogenous Mff. Units, number of Mff punctae per square micrometer in ROI. 643 independent punctae from five control cell ROIs and 153 puncta from seven Drp1 KD cell ROIs. ***, P < 0.0005 by Student’s t test. Bars: (whole-cell images) 10 µm; (insets) 2 µm. Time in seconds.
Figure 8.
Figure 8.
ER-targeted Mff facilitates mitochondrial division. (A) Schematic cartoon of rapamycin-induced Mff recruitment to either OMM (left) or ER (right). “Mff” refers to the cytoplasmic portion of Mff-S. (B) Dynamics of GFP-Mff-FRB translocation to mitochondria upon rapamycin treatment in Mff KO cells. Live-cell images of cell transfected with AKAP-FKBP12 (red), GFP-Mff-Cyto-FRB (green), eBFP2-peroxisome (peroxisomes, blue), and mitoBFP (mitochondria, blue). Rapamycin (final concentration: 10 µM) added at time 0. (C) Dynamics of GFP-Mff-Cyto translocation to ER upon rapamycin in rapamycin treatment in Mff KO cells. Live-cell images of cells transfected with Sac1-FKBP12 (ER, blue), GFP-Mff-Cyto-FRB (green), and mCherry-mito7 (mitochondria, red). The lower green panel represents GFP-MFF-CytoFRB signal that has been thresholded to remove the cytoplasmic signal. Rapamycin (final concentration: 10 µM) added at time 0. (D) Rapamycin-induced mitochondrial division rates in control U2OS cells (16 ROIs from 15 cells); Mff KO cells (21 ROIs from 21 cells; ***, P = 0.00001); Mff KO cells transfected with mitochondria-targeted Mff (34 ROIs from 30 cells; *, P = 0.0179); Mff KO cells transfected with ER-targeted Mff (20 ROIs from 17 cells; ***, P = 0.0049); or Mff KO cells transfected with both mitochondria- and ER-targeted Mff (34 ROIs from 30 cells; P = 0.4181). Statistical analysis based on comparison to control cells by Student’s t test. N.S., not significant. Error bars represent SD. (E) Western blot showing Mff and Drp1 expression levels in WT cells, Mff KO cells, and Mff KO cells transfected with either the Mff-FRB construct + the mitochondrially targeted FKBP12 construct (Mff KO + Mff-mito) or the Mff-FRB construct + the mitochondrially targeted FKBP12 construct + the ER-targeted FKBP12 construct (Mff KO + Mff-ER & Mff-mito). Tubulin and myosin IIA are loading controls. Endogenous Mff runs as a doublet less than 37 kD, whereas the Mff-FRB construct runs at the 37-kD marker. Bars: (whole-cell images) 10 µm; (insets) 2 µm. Time in seconds.
Figure 9.
Figure 9.
Actin-dependent oligomerization of ER-associated Drp1 punctae. (A) Left: Merged image of a live GFP-Drp1-KI cell before ionomycin treatment, transiently expressing mPlum-mito3 (gray), eBFP2-peroxisome (blue), and ER-tagRFP (ER, red). Drp1 in green. Right: Inset from boxed region before (top) and after (bottom) ionomycin treatment (4 µM, 10 min). Yellow arrows denote independent Drp1 maturing upon ionomycin treatment. See also Video 9. (B) Similar experiment as in A, except cells were pretreated for 10 min with 1 µM LatA. See also Video 10. (C) Quantification of independent Drp1 punctae number in response to vehicle treatment (DMSO), ionomycin treatment, and LatA pretreatment followed by ionomycin treatment. Six ROIs from six DMSO-treated cells, 16 ROIs from 14 ionomycin-treated cells, and eight ROIs from six LatA-pretreated/ionomycin-treated cells. Punctae per ROI normalized to 1 at time of ionomycin addition. Error bar, SEM. Arrow indicates time point where ionomycin was added during imaging (time 0). Bars: (left) 10 µm; (right) 2 µm. Time in seconds.
Figure 10.
Figure 10.
Maturation of existing independent Drp1 punctae upon ionomycin stimulation. (A) Two examples of independent Drp1 punctae maturation in response to ionomycin. Time-lapse images of live GFP-Drp1-KI cell as in Fig. 9 A. Time indicates seconds after ionomycin treatment. Fluorescence intensity levels modulated uniformly across time course so that final fluorescence is in linear range (resulting in time 0 fluorescence being undetectable as displayed). Bars, 1 µm. Time in seconds. (B) Quantification of mean independent Drp1 punctum intensity in unstimulated or ionomycin-treated conditions. Seven independent Drp1 punctae from unstimulated cells and eight independent Drp1 punctae from ionomycin-treated cells analyzed. Error bars, SD. (C) Effect of INF2 KD on independent Drp1 punctae in GFP-Drp1-KI cells transfected with mCherry-mito7 (mitochondria, red) and eBFP2-peroxisome (blue). Drp1 in green. Top, control siRNA; bottom, INF2 siRNA. Right, zoomed images of boxed regions indicated by numbers. Yellow arrows, independent Drp1 punctae. Bars: (left) 10 µm; (insets, right) 2 µm. (D) Quantification of independent Drp1 punctae density in control (scrambled siRNA) and INF2 siRNA cells. 174 independent punctae from seven control cells; 45 independent punctae from nine INF2 siRNA cells. Density expressed as number of independent Drp1 punctae per area of ROI (in square micrometers). ***, P < 0.001 by Student’s t test.

References

    1. Aviram N., Ast T., Costa E.A., Arakel E.C., Chuartzman S.G., Jan C.H., Haßdenteufel S., Dudek J., Jung M., Schorr S., et al. . 2016. The SND proteins constitute an alternative targeting route to the endoplasmic reticulum. Nature. 540:134–138. 10.1038/nature20169 - DOI - PMC - PubMed
    1. Bui H.T., and Shaw J.M.. 2013. Dynamin assembly strategies and adaptor proteins in mitochondrial fission. Curr. Biol. 23:R891–R899. 10.1016/j.cub.2013.08.040 - DOI - PMC - PubMed
    1. Bustillo-Zabalbeitia I., Montessuit S., Raemy E., Basañez G., Terrones O., and Martinou J.C.. 2014. Specific interaction with cardiolipin triggers functional activation of dynamin-related protein 1. PLoS One. 9:e102738 10.1371/journal.pone.0102738 - DOI - PMC - PubMed
    1. Chang C.R., and Blackstone C.. 2007. Drp1 phosphorylation and mitochondrial regulation. EMBO Rep. 8:1088–1089. 10.1038/sj.embor.7401118 - DOI - PMC - PubMed
    1. Chang C.R., and Blackstone C.. 2010. Dynamic regulation of mitochondrial fission through modification of the dynamin-related protein Drp1. Ann. N. Y. Acad. Sci. 1201:34–39. 10.1111/j.1749-6632.2010.05629.x - DOI - PMC - PubMed

MeSH terms

Associated data