

Development and validation of QDiabetes-2018 risk prediction algorithm to estimate future risk of type 2 diabetes: cohort study
- PMID: 29158232
- PMCID: PMC5694979
- DOI: 10.1136/bmj.j5019
Development and validation of QDiabetes-2018 risk prediction algorithm to estimate future risk of type 2 diabetes: cohort study
Abstract
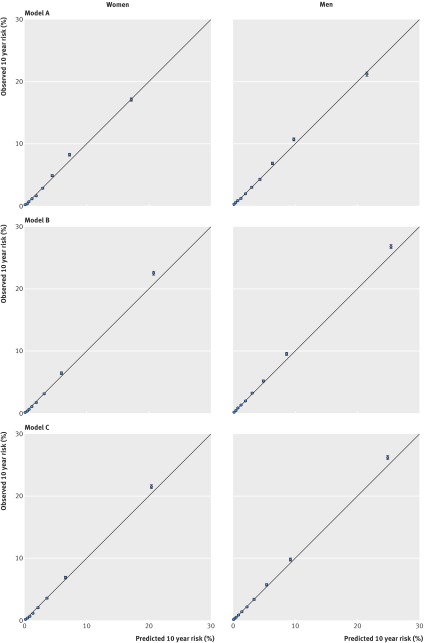
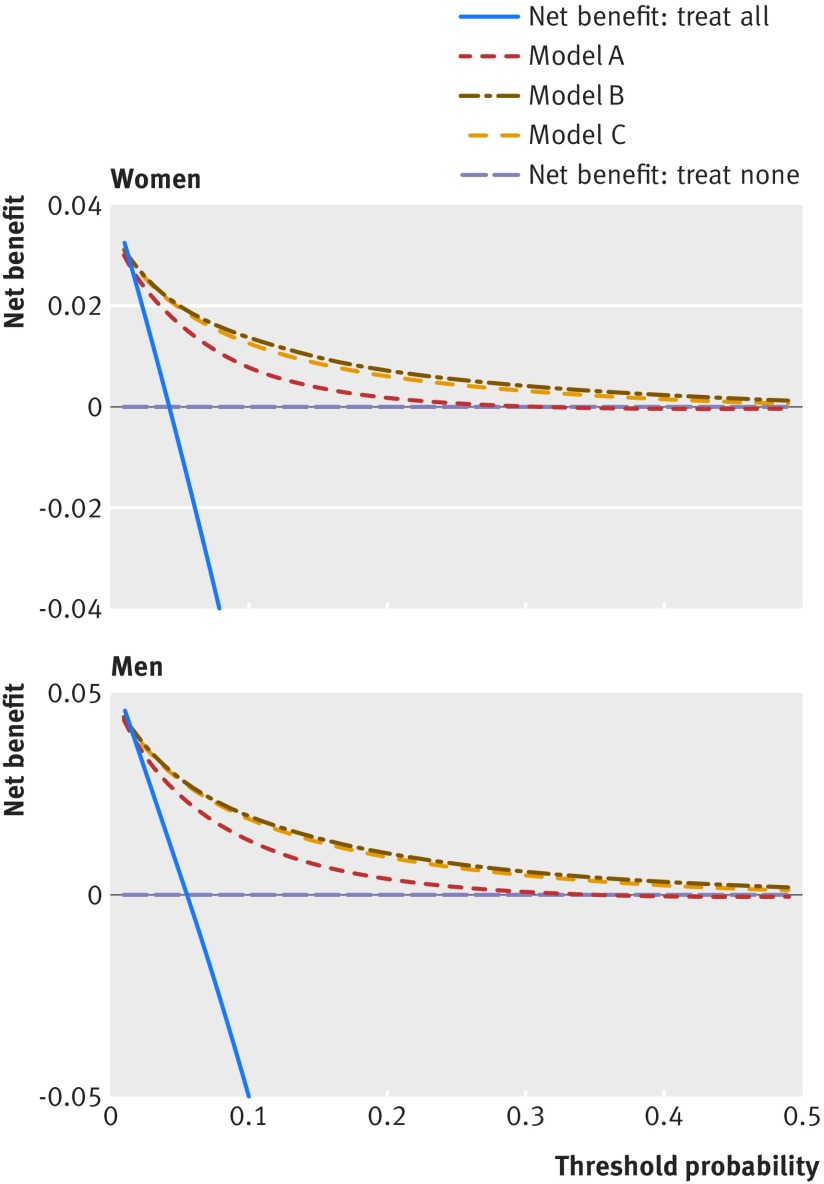
Objectives To derive and validate updated QDiabetes-2018 prediction algorithms to estimate the 10 year risk of type 2 diabetes in men and women, taking account of potential new risk factors, and to compare their performance with current approaches.Design Prospective open cohort study.Setting Routinely collected data from 1457 general practices in England contributing to the QResearch database: 1094 were used to develop the scores and a separate set of 363 were used to validate the scores.Participants 11.5 million people aged 25-84 and free of diabetes at baseline: 8.87 million in the derivation cohort and 2.63 million in the validation cohort.Methods Cox proportional hazards models were used in the derivation cohort to derive separate risk equations in men and women for evaluation at 10 years. Risk factors considered included those already in QDiabetes (age, ethnicity, deprivation, body mass index, smoking, family history of diabetes in a first degree relative, cardiovascular disease, treated hypertension, and regular use of corticosteroids) and new risk factors: atypical antipsychotics, statins, schizophrenia or bipolar affective disorder, learning disability, gestational diabetes, and polycystic ovary syndrome. Additional models included fasting blood glucose and glycated haemoglobin (HBA1c). Measures of calibration and discrimination were determined in the validation cohort for men and women separately and for individual subgroups by age group, ethnicity, and baseline disease status.Main outcome measure Incident type 2 diabetes recorded on the general practice record.Results In the derivation cohort, 178 314 incident cases of type 2 diabetes were identified during follow-up arising from 42.72 million person years of observation. In the validation cohort, 62 326 incident cases of type 2 diabetes were identified from 14.32 million person years of observation. All new risk factors considered met our model inclusion criteria. Model A included age, ethnicity, deprivation, body mass index, smoking, family history of diabetes in a first degree relative, cardiovascular disease, treated hypertension, and regular use of corticosteroids, and new risk factors: atypical antipsychotics, statins, schizophrenia or bipolar affective disorder, learning disability, and gestational diabetes and polycystic ovary syndrome in women. Model B included the same variables as model A plus fasting blood glucose. Model C included HBA1c instead of fasting blood glucose. All three models had good calibration and high levels of explained variation and discrimination. In women, model B explained 63.3% of the variation in time to diagnosis of type 2 diabetes (R2), the D statistic was 2.69 and the Harrell's C statistic value was 0.89. The corresponding values for men were 58.4%, 2.42, and 0.87. Model B also had the highest sensitivity compared with current recommended practice in the National Health Service based on bands of either fasting blood glucose or HBA1c. However, only 16% of patients had complete data for blood glucose measurements, smoking, and body mass index.Conclusions Three updated QDiabetes risk models to quantify the absolute risk of type 2 diabetes were developed and validated: model A does not require a blood test and can be used to identify patients for fasting blood glucose (model B) or HBA1c (model C) testing. Model B had the best performance for predicting 10 year risk of type 2 diabetes to identify those who need interventions and more intensive follow-up, improving on current approaches. Additional external validation of models B and C in datasets with more completely collected data on blood glucose would be valuable before the models are used in clinical practice.
Published by the BMJ Publishing Group Limited. For permission to use (where not already granted under a licence) please go to http://group.bmj.com/group/rights-licensing/permissions.
Conflict of interest statement
Competing interests: All authors have completed the ICJME uniform disclosure form at www.icmje.org/coi_disclosure.pdf (available on request from the corresponding author) and declare: JHC is professor of clinical epidemiology at the University of Nottingham and co-director of QResearch—a not-for-profit organisation, which is a joint partnership between the University of Nottingham and EMIS Health (leading commercial supplier of IT for 55% of general practices in the UK). JHC is also a paid director of ClinRisk, which produces open and closed source software to ensure the reliable and updatable implementation of clinical risk equations within clinical computer systems to help improve patient care. CC is professor of medical statistics in primary care at the University of Nottingham and a paid consultant statistician for ClinRisk. This work and any views expressed within it are solely those of the authors and not of any affiliated bodies or organisations.
Figures
References
-
- Hippisley-Cox J, Coupland C, Robson J, Sheikh A, Brindle P. Predicting risk of type 2 diabetes in England and Wales: prospective derivation and validation of QDScore. BMJ 2009;338:b880.pmid:19297312. - PMC - PubMed
-
- Hippisley-Cox JCC. QDiabetes 2011 Annual Update Information 2011. www.qdiabetes.org/QDScore-2011-Annual-Update-Information.pdf.
-
- Hippisley-Cox JCC. QDiabetes 2013 Annual Update Information 2013. http://qdiabetes.org/QDiabetes-2013-Annual-Update-Information.pdf.
-
- Hippisley-Cox JCC. QDiabetes 2015 Annual Update Information 2015. www.qdiabetes.org/QDiabetes-2015-Annual-Update-Information.pdf.
-
- Hippisley-Cox J, Coupland C, Brindle P. The performance of seven QPrediction risk scores in an independent external sample of patients from general practice: a validation study. BMJ Open 2014;4:e005809 10.1136/bmjopen-2014-005809. pmid:25168040. - DOI - PMC - PubMed
Publication types
MeSH terms
Substances
LinkOut - more resources
Full Text Sources
Other Literature Sources
Medical
Miscellaneous