. 2018 Jan 26;293(4):1120-1137.
doi: 10.1074/jbc.M117.814368. Epub 2017 Nov 20.

Nitro-fatty acid inhibition of triple-negative breast cancer cell viability, migration, invasion, and tumor growth

Affiliations

Nitro-fatty acid inhibition of triple-negative breast cancer cell viability, migration, invasion, and tumor growth

Chen-Shan Chen Woodcock et al. J Biol Chem. .

Abstract

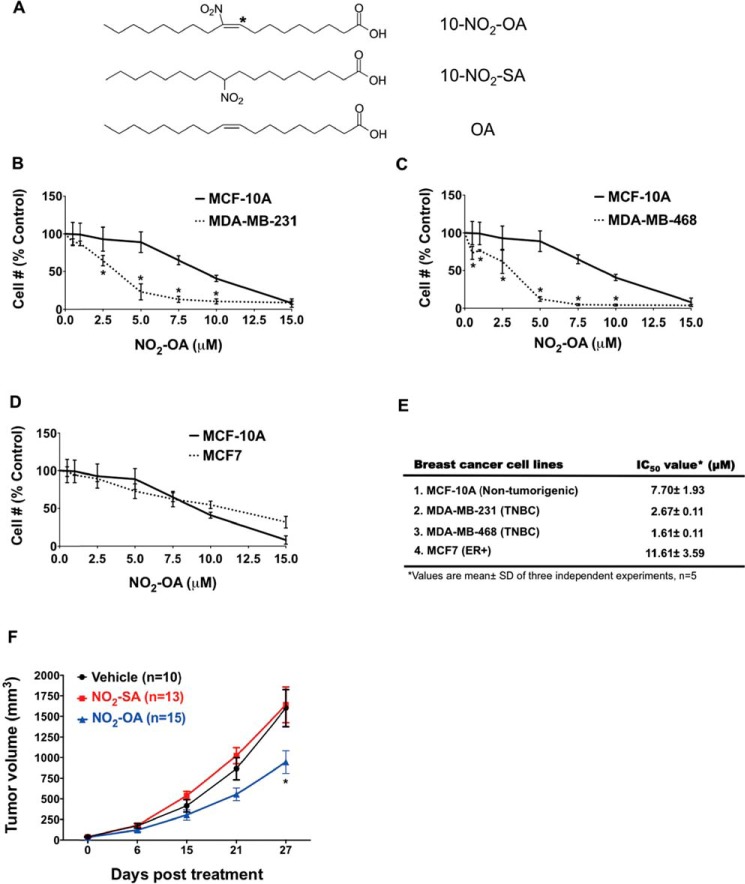
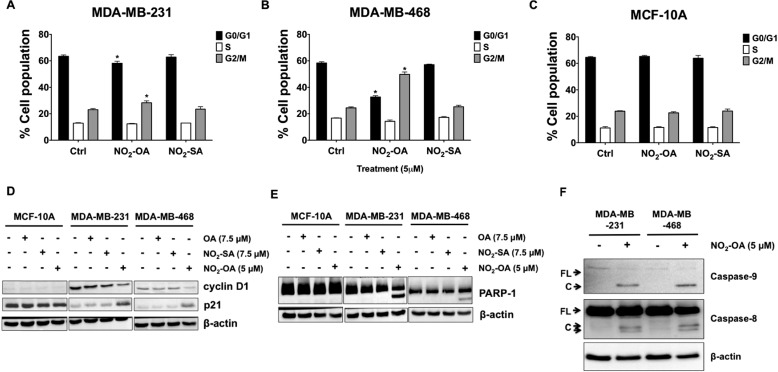
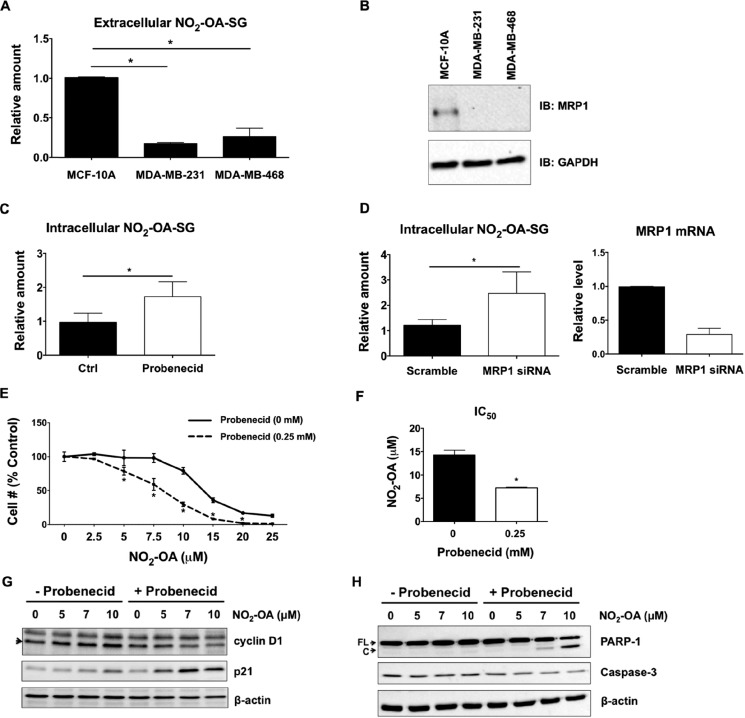
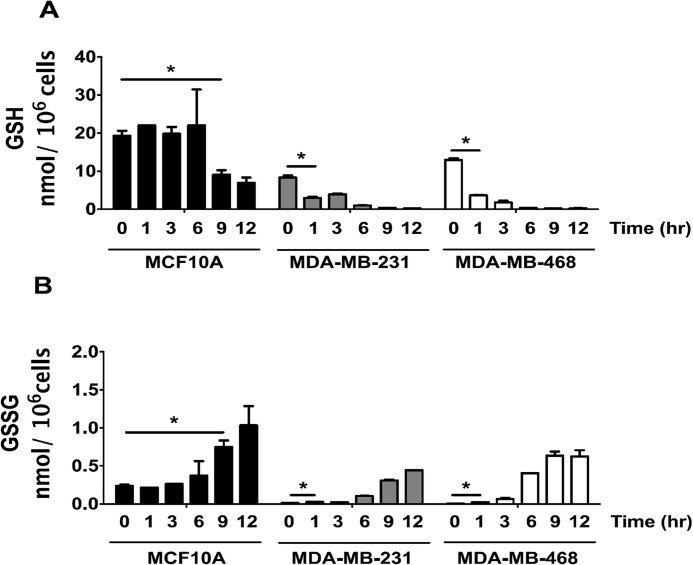
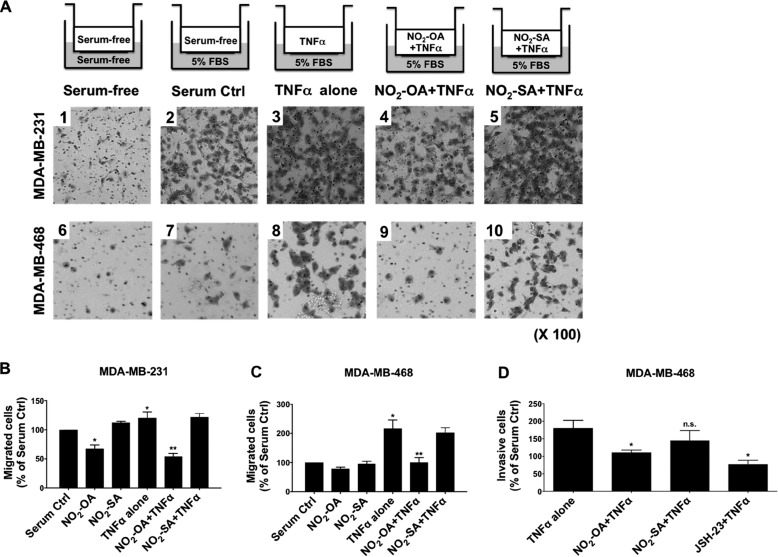
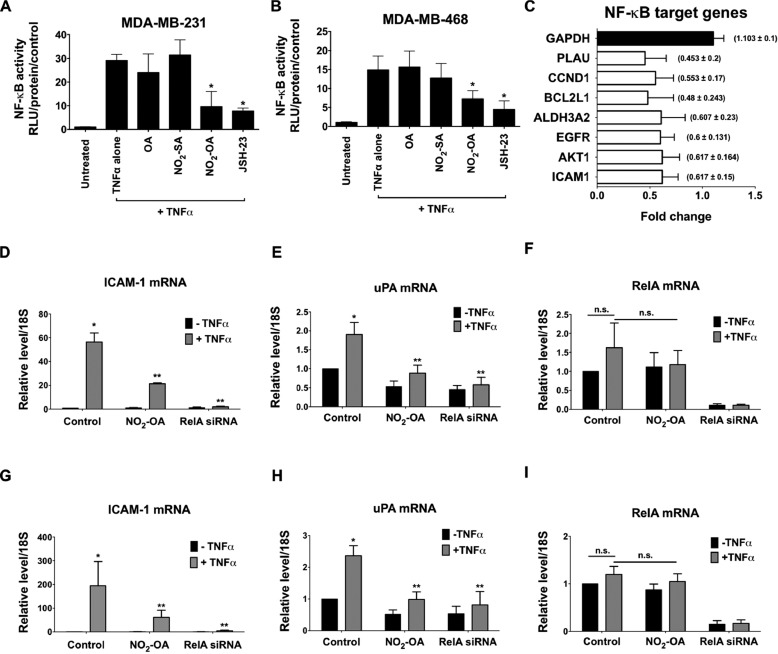
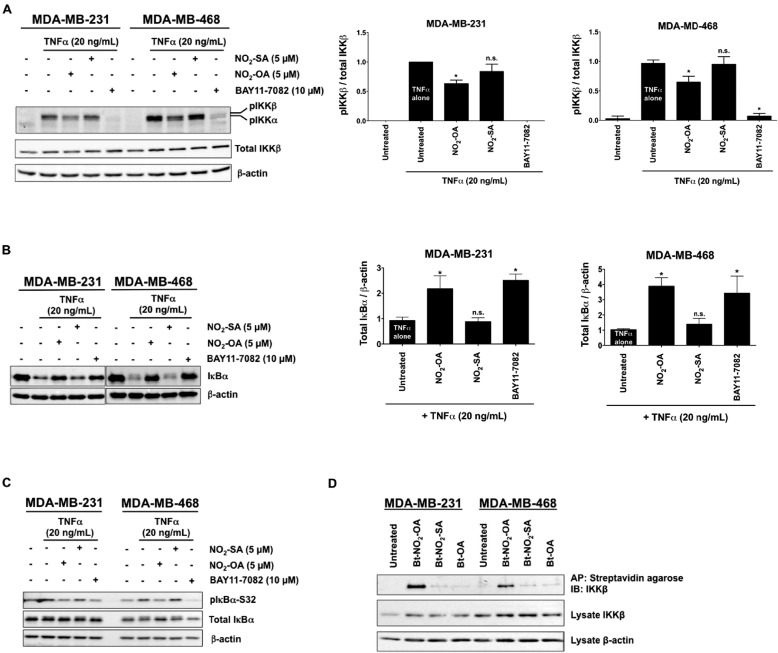
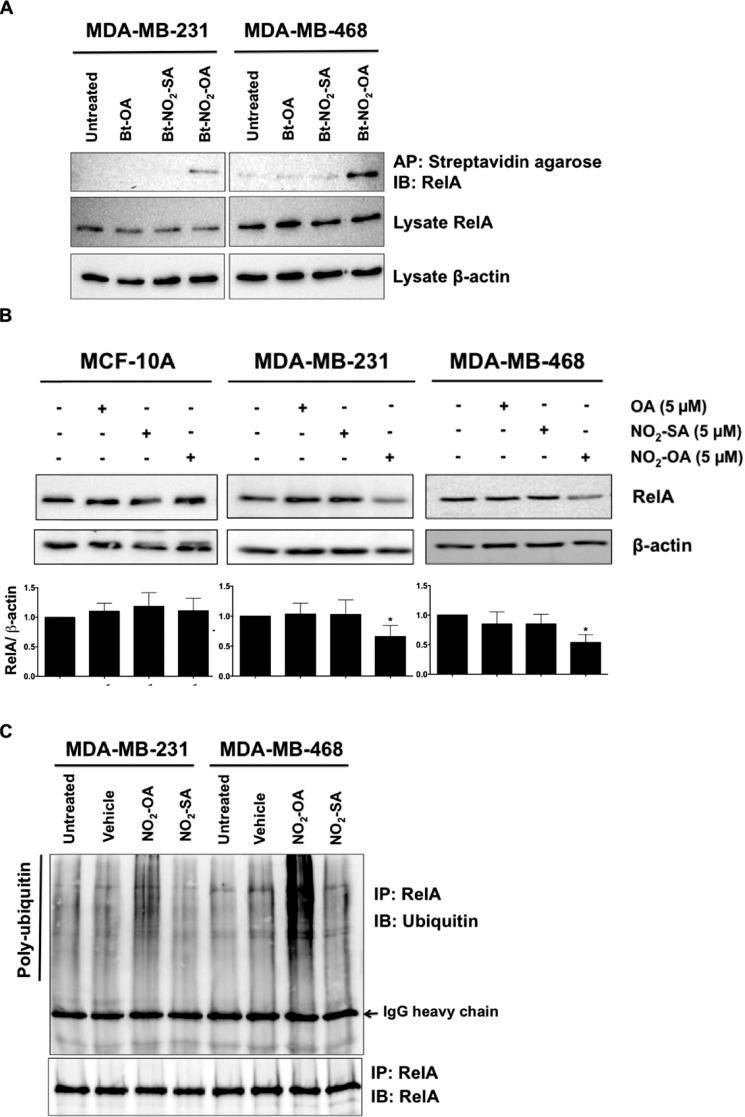
Triple-negative breast cancer (TNBC) comprises ∼20% of all breast cancers and is the most aggressive mammary cancer subtype. Devoid of the estrogen and progesterone receptors, along with the receptor tyrosine kinase ERB2 (HER2), that define most mammary cancers, there are no targeted therapies for patients with TNBC. This, combined with a high metastatic rate and a lower 5-year survival rate than for other breast cancer phenotypes, means there is significant unmet need for new therapeutic strategies. Herein, the anti-neoplastic effects of the electrophilic fatty acid nitroalkene derivative, 10-nitro-octadec-9-enoic acid (nitro-oleic acid, NO2-OA), were investigated in multiple preclinical models of TNBC. NO2-OA reduced TNBC cell growth and viability in vitro, attenuated TNFα-induced TNBC cell migration and invasion, and inhibited the tumor growth of MDA-MB-231 TNBC cell xenografts in the mammary fat pads of female nude mice. The up-regulation of these aggressive tumor cell growth, migration, and invasion phenotypes is mediated in part by the constitutive activation of pro-inflammatory nuclear factor κB (NF-κB) signaling in TNBC. NO2-OA inhibited TNFα-induced NF-κB transcriptional activity in human TNBC cells and suppressed downstream NF-κB target gene expression, including the metastasis-related proteins intercellular adhesion molecule-1 and urokinase-type plasminogen activator. The mechanisms accounting for NF-κB signaling inhibition by NO2-OA in TNBC cells were multifaceted, as NO2-OA (a) inhibited the inhibitor of NF-κB subunit kinase β phosphorylation and downstream inhibitor of NF-κB degradation, (b) alkylated the NF-κB RelA protein to prevent DNA binding, and (c) promoted RelA polyubiquitination and proteasomal degradation. Comparisons with non-tumorigenic human breast epithelial MCF-10A and MCF7 cells revealed that NO2-OA more selectively inhibited TNBC function. This was attributed to more facile mechanisms for maintaining redox homeostasis in normal breast epithelium, including a more favorable thiol/disulfide balance, greater extents of multidrug resistance protein-1 (MRP1) expression, and greater MRP1-mediated efflux of NO2-OA-glutathione conjugates. These observations reveal that electrophilic fatty acid nitroalkenes react with more alkylation-sensitive targets in TNBC cells to inhibit growth and viability.

Keywords: NF-kappaB; breast cancer; cancer chemoprevention; drug action; proliferation; reactive nitrogen species (RNS); reactive oxygen species (ROS); signaling; tumor immunology; tumor necrosis factor (TNF).


Conflict of interest statement

B. A. F., S. G. W., S. R. W., and C. C. W. acknowledge interest in Complexa, Inc. No potential conflicts of interest were disclosed by other authors

Figures

Figure 1.
Figure 1.
NO2-OA inhibits TNBC cell growth in vitro and in vivo. A, chemical structures of NO2-OA and the non-electrophilic NO2-SA and OA. *, electrophilic carbon (35). The effect of NO2-OA on the growth of MDA-MB-231 (B), MDA-MB-468 (C), and MCF7 (D) was compared with the effect on MCF-10A cells. Data are shown as a percentage of untreated control cells (mean ± S.D. (error bars)). *, p < 0.05 indicates significant difference between two cell types within each treatment. Three independent experiments were performed (n = 5 each). E, IC50 values of NO2-OA in each breast cancer cell line. F, effect of NO2-OA (7.5 mg/kg daily) on MDA-MB-231 xenograft tumor growth (mean ± S.E. (error bars)). *, p < 0.05 versus vehicle group within treatment time. Significance was determined by two-way analysis of variance followed by Tukey's post hoc test.
Figure 2.
Figure 2.
NO2-OA promotes cell cycle arrest and apoptosis in TNBC cells. Percentages of the cell population in each phase of the cell cycle (G0/G1, S, and G2/M) are shown for MDA-MB-231 (A), MDA-MB-468 (B), and MCF-10A cells (C) treated with NO2-OA (5 μm) for 24 h. Cells were harvested and analyzed by fluorescence-activated cell sorting. Significance was determined by one-way analysis of variance followed by Tukey post hoc test. Data are mean ± S.D. (error bars) (n = 3). *, p < 0.05 versus control. D, immunoblot analysis of cyclin D1 and p21 in MCF-10A, MDA-MB-231, and MDA-MB-468 cells that were treated with OA (7.5 μm), NO2-SA (7.5 μm), or NO2-OA (5 μm) for 24 h. E, immunoblot analysis of PARP-1 cleavage in MCF-10A, MDA-MB-231, and MDA-MB-468 cells treated with OA (7.5 μm), NO2-SA (7.5 μm), or NO2-OA (5 μm) for 24 h. F, immunoblot analysis of caspase-8 and caspase-9 cleavage in MDA-MB-231 and MDA-MB-468 cells treated with or without NO2-OA (5 μm) for 24 h. β-actin was used as loading control. Data in D–F are representative of three independent experiments.
Figure 3.
Figure 3.
MRP1 influences NO2-OA trafficking and signaling in TNBC cells. A, the export of NO2-OA-SG by MCF-10A, MDA-MB-231, and MDA-MB-468 cells was measured by LC-MS/MS analysis. The relative extent of NO2-OA-SG export is reported as a ratio of NO2-OA-SG to an externally added 15NO2-d4-OA-SG standard. *, p < 0.05 versus MCF-10A, n = 4 (Mann–Whitney U test). B, representative immunoblot of endogenous MRP1 protein expression in MCF-10A, MDA-MB-231, and MDA-MB-468 cells. Suppression of MRP1 activity (C) and MRP1 expression (D) increased intracellular NO2-OA-SG adduct concentrations in MCF-10A cells. The relative amount represents the relative abundance of NO2-OA-SG to 15NO2-d4-OA-SG standard, normalized to protein concentrations from each NO2-OA–treated sample divided by the abundance of control (Ctrl) or scrambled sample. *, p < 0.05 versus control (n = 6) or scrambled (n = 9) was determined by Mann–Whitney U test. The siRNA knockdown efficiency of MRP1 was evaluated by real-time qPCR (n = 4). E, the effect of probenecid on NO2-OA growth inhibition of MCF-10A cells. Cells were pretreated with or without probenecid (0.25 mm) for 1 h and then combined with 0–25 μm NO2-OA for 48 h. A FluoReporter dsDNA stain assay was performed to measure cell numbers. Data are shown as percentage of untreated control cells (n = 3); *, p < 0.05 (0 mm versus 0.25 mm probenecid between treatments, two-way analysis of variance followed by Tukey post test). F, the average IC50 values of NO2-OA in MCF-10A cells treated with or without probenecid. *, p < 0.05, n = 3 (unpaired Student's t test). G, immunoblot analysis of cyclin D1 and p21 in MCF-10A cells treated with NO2-OA (5 μm) in the presence or absence of probenecid (1 mm used for this 24-h incubation). H, immunoblot analysis of caspase-3 and PARP-1 cleavage in MCF-10A cells treated with NO2-OA (5 μm) in the presence or absence of probenecid (1 mm) for 24 h. The full-length (FL) and cleaved (C) forms of PARP-1 and pro-caspase-3 protein level are shown. All data are mean ± S.D. (error bars). All immunoblots are representative of three independent experiments.
Figure 4.
Figure 4.
NO2-OA depletes GSH levels and enhances GSSG formation in TNBC cells. The response of cellular GSH (A) and GSSG (B) to NO2-OA in MCF-10A (black bars), MDA-MB-231 (gray bars), and MDA-MB-468 (white bars) cells is shown. Cells were treated with NO2-OA (5 μm) for the indicated times (h). GSH and GSSG were extracted from cells (3 × 10⁶ cells/ml) and quantitated by LC-MS/MS. *, p < 0.05 versus 0 h via unpaired two-tailed Student's t test. Data are presented as mean ± S.D. (error bars) (n = 5).
Figure 5.
Figure 5.
NO2-OA inhibits TNFα-induced TNBC cell migration and invasion. A, experimental schemes and representative images of crystal violet-stained migrating MDA-MB-231 or MDA-MB-468 cells. Cells (1 × 10⁵) were placed in the upper chamber with serum-free medium under the indicated treatment conditions. Migrating cells were photographed using a light microscope at ×100. B and C, quantitation of migrated cells from Fig. 4A was performed by solubilization of crystal violet and spectrophotometric analysis at A573 nm. The percentage of migrating cells in each treatment group was compared with numbers of migrating cells in the absence of TNFα stimulation (Serum Ctrl). *, p < 0.05 versus in the absence of TNFα stimulation; **, p < 0.05 versus TNFα alone. D, to test the impact of NO2-OA on TNBC cell invasion, MDA-MB-468 cells were incubated in serum-free medium containing 20 ng/ml TNFα combined with NO2-OA (5 μm), NO2-SA (5 μm), or JSH-23 (10 μm), and then invasion was determined by the extents of cell migration through the Matrigel matrix toward a 5% FBS chemoattractant for 24 h. The percentage of invading cells in each treatment was relative to the number of migrating cells in the absence of TNFα stimulation. *, p < 0.05 versus TNFα alone n.s., not significant. Significance was determined by one-way analysis of variance followed by Tukey post hoc test. All data are mean ± S.D. (error bars).
Figure 6.
Figure 6.
NO2-OA inhibits TNFα-induced NF-κB transcriptional activity in TNBC cells. The effect of NO2-OA on TNFα-induced activation of NF-κB–dependent reporter gene transcription was measured in NF-κB-luciferase reporter–transfected MDA-MB-231 (A) or MDA-MB-468 (B) cells. *, p < 0.05 versus TNFα alone (n = 3). Significance was determined by Kruskal–Wallis test followed by Dunn's post test with Bonferroni corrections for multiple comparisons. C, determination of NF-κB target genes down-regulated by NO2-OA in MDA-MB-468 cells using a human NF-κB target PCR array. Histograms represent the fraction of mRNA expression in NO2-OA–treated versus untreated cells. GAPDH was used as an internal control (black bar). Shown is the effect of NO2-OA on expression of ICAM-1 (D), uPA (E), or RelA (F) genes in TNFα-induced MDA-MB-231 cells. Similarly, the effect of NO2-OA on expression of ICAM-1 (G), uPA (H), or RelA (I) genes in TNFα-induced MDA-MB-468 cells is shown. The -fold increase relative to untreated controls is presented. *, p < 0.05 versus untreated control; **, p < 0.05 versus TNFα alone. n.s., not significant. Significance was determined by one-way analysis of variance followed by Tukey post test. All data are presented as mean ± S.D. (error bars) (n = 5).
Figure 7.
Figure 7.
NO2-OA inhibits TNFα-induced IKKβ phosphorylation and IκBα degradation and covalently adducts IKKβ. MDA-MB-231 and MDA-MB-468 cells were used in all studies. A, representative immunoblot of IKKβ (Ser-180) phosphorylation, total IKKβ levels, and relative phosphorylated IKKβ levels. Then all phosphorylated IKKβ levels normalized to total IKKβ were quantified. B, representative immunoblot of IκBα protein levels is shown, and the relative total IκBα levels (normalized to total β-actin) are quantified in response to NO2-SA, NO2-OA, and the NF-κB inhibitor BAY11-7082. C, representative immunoblots of IκBα (Ser-32) phosphorylation and total IκBα are shown in response to NO2-SA, NO2-OA, and the NF-κB inhibitor BAY11-7082. D, NO2-OA alkylates TNBC IKKβ protein. Biotinylated NO2-OA, NO2-SA, and OA and adducted proteins were affinity-purified by streptavidin-agarose beads from cell lysates. Pulled-down IKKβ protein was then detected by immunoblotting. IKKβ and control β-actin immunoblots from the same input lysates used for affinity purification are shown below the panel. *, p < 0.05 versus TNFα alone. n.s., not significant. Significance was determined by one-way analysis of variance followed by Tukey post test.
Figure 8.
Figure 8.
NO2-OA alkylates and destabilizes NF-κB RelA protein in TNBC cells. A, MDA-MB-231 or MDA-MB-468 cells were treated with 5 μm Bt-NO2-OA, Bt-NO2-SA, or Bt-OA for 2 h. After cell lysis, biotinylated NO2-FAs with adducts were affinity-purified (AP) using streptavidin-agarose beads. Pulled-down RelA protein was then detected by immunoblotting (IB). RelA and control β-actin immunoblots from the same input lysates used for affinity purification are shown below the panel. B, endogenous RelA protein levels were detected by immunoblotting probed with anti-RelA antibody using β-actin as a loading control. The relative total RelA levels (normalized by total β-actin) compared with untreated controls were quantified. *, p < 0.05 versus untreated control. Significance was determined by one-way analysis of variance followed by Tukey post test. C, MDA-MB-231 or MDA-MB-468 cells were treated with vehicle (methanol), NO2-OA (5 μm), or NO2-SA (5 μm) for 6 h, and then cell lysates were harvested and immunoprecipitated (IP) by anti-RelA antibody followed by immunoblotting. Pulldown level of immunoprecipitated RelA proteins is shown below the panel.

References

    1. Alexander R. L., Bates D. J., Wright M. W., King S. B., and Morrow C. S. (2006) Modulation of nitrated lipid signaling by multidrug resistance protein 1 (MRP1): glutathione conjugation and MRP1-mediated efflux inhibit nitrolinoleic acid-induced, PPARγ-dependent transcription activation. Biochemistry 45, 7889–7896 10.1021/bi0605639 - DOI - PubMed
    1. Brenton J. D., Carey L. A., Ahmed A. A., and Caldas C. (2005) Molecular classification and molecular forecasting of breast cancer: ready for clinical application? J. Clin. Oncol. 23, 7350–7360 10.1200/JCO.2005.03.3845 - DOI - PubMed
    1. Bauer K. R., Brown M., Cress R. D., Parise C. A., and Caggiano V. (2007) Descriptive analysis of estrogen receptor (ER)-negative, progesterone receptor (PR)-negative, and HER2-negative invasive breast cancer, the so-called triple-negative phenotype. Cancer 109, 1721–1728 10.1002/cncr.22618 - DOI - PubMed
    1. Smith C., Mitchinson M. J., Aruoma O. I., and Halliwell B. (1992) Stimulation of lipid peroxidation and hydroxyl-radical generation by the contents of human atherosclerotic lesions. Biochem. J. 286, 901–905 10.1042/bj2860901 - DOI - PMC - PubMed
    1. Dent R., Trudeau M., Pritchard K. I., Hanna W. M., Kahn H. K., Sawka C. A., Lickley L. A., Rawlinson E., Sun P., and Narod S. A. (2007) Triple-negative breast cancer: clinical features and patterns of recurrence. Clin. Cancer Res. 13, 4429–4434 10.1158/1078-0432.CCR-06-3045 - DOI - PubMed

Publication types