. 2018 Jan;176(1):611-633.
doi: 10.1104/pp.17.01462. Epub 2017 Nov 20.

Vessel-Specific Reintroduction of CINNAMOYL-COA REDUCTASE1 (CCR1) in Dwarfed ccr1 Mutants Restores Vessel and Xylary Fiber Integrity and Increases Biomass

Affiliations

Vessel-Specific Reintroduction of CINNAMOYL-COA REDUCTASE1 (CCR1) in Dwarfed ccr1 Mutants Restores Vessel and Xylary Fiber Integrity and Increases Biomass

Barbara De Meester et al. Plant Physiol. 2018 Jan.

Abstract

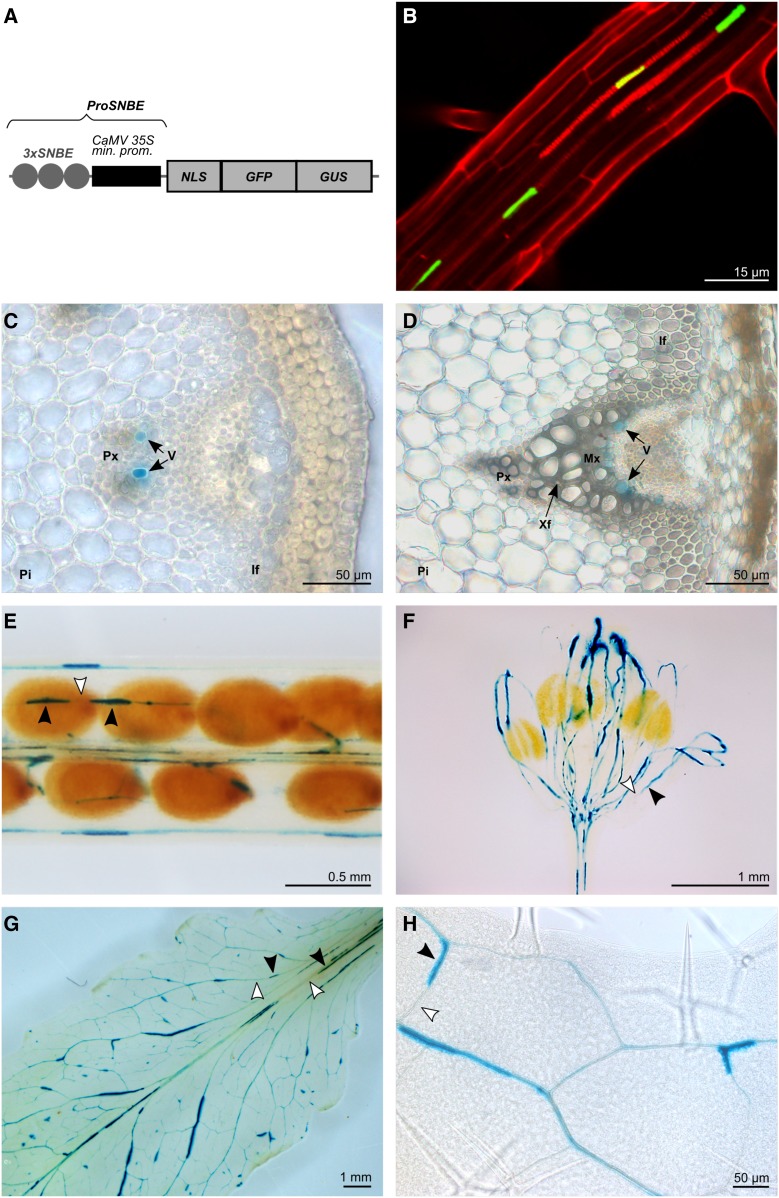
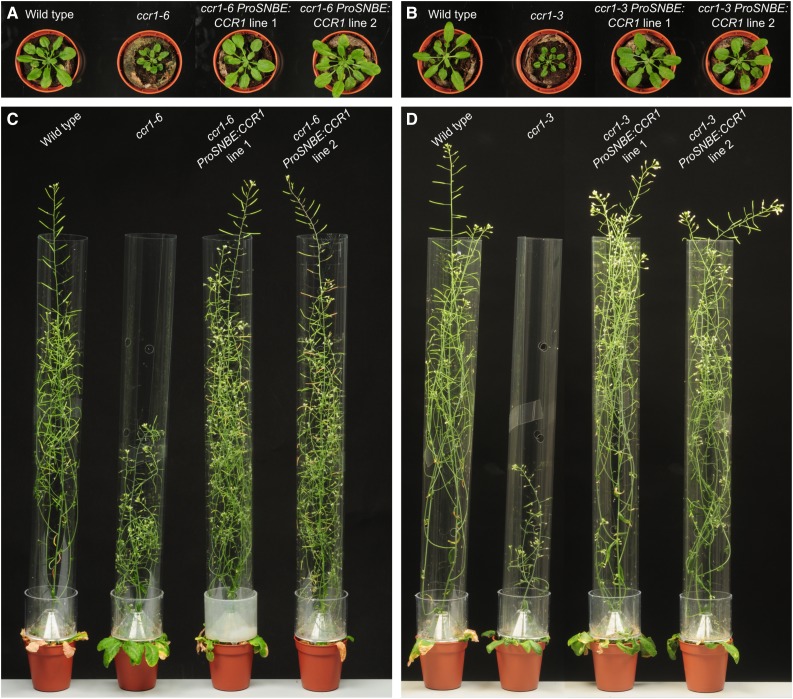
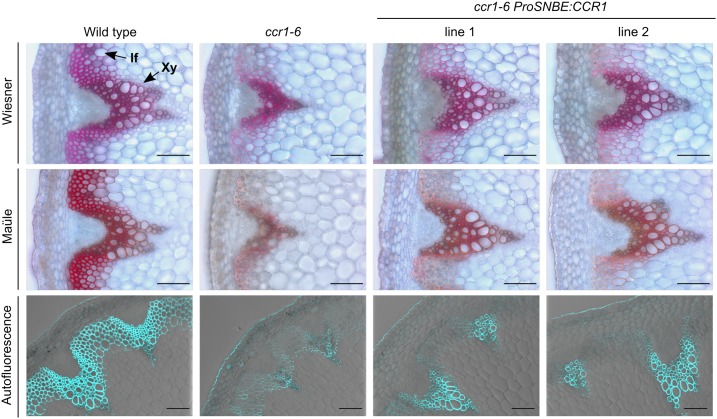
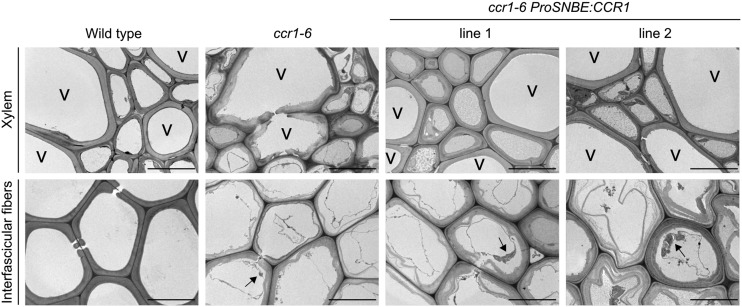
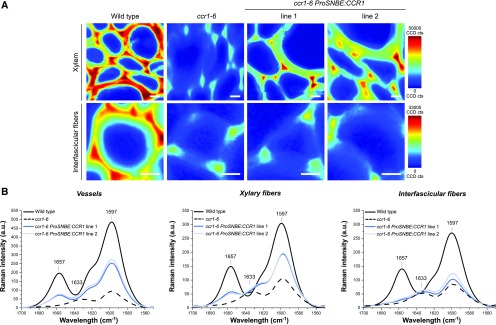
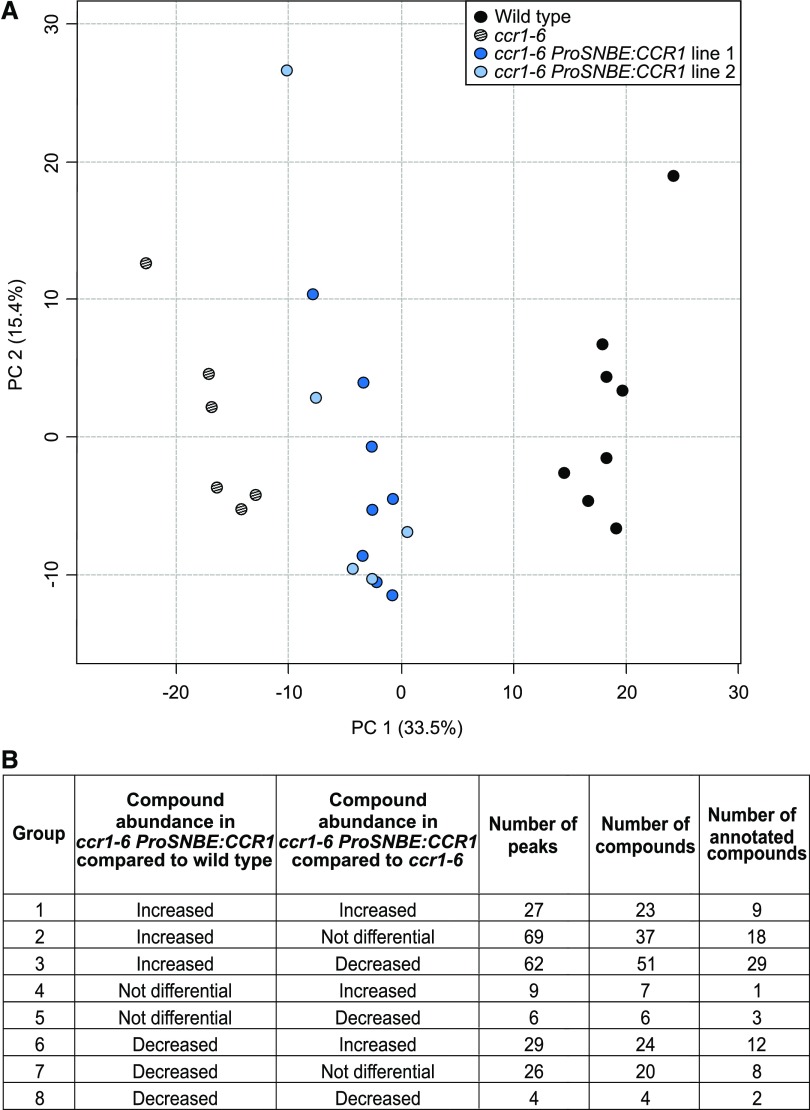
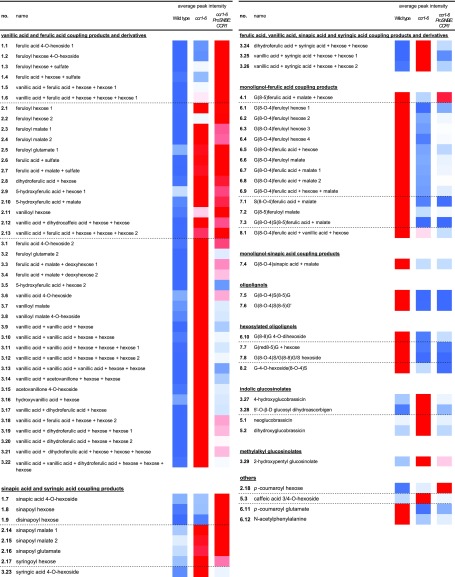
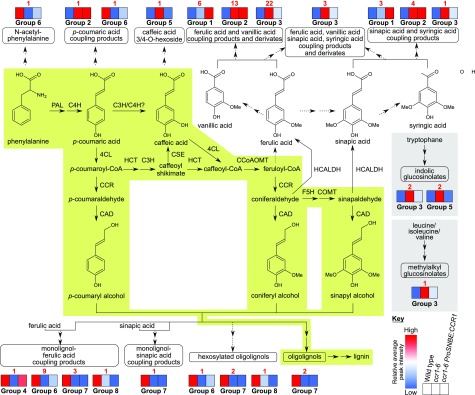
Lignocellulosic biomass is recalcitrant toward deconstruction into simple sugars due to the presence of lignin. To render lignocellulosic biomass a suitable feedstock for the bio-based economy, plants can be engineered to have decreased amounts of lignin. However, engineered plants with the lowest amounts of lignin exhibit collapsed vessels and yield penalties. Previous efforts were not able to fully overcome this phenotype without settling in sugar yield upon saccharification. Here, we reintroduced CINNAMOYL-COENZYME A REDUCTASE1 (CCR1) expression specifically in the protoxylem and metaxylem vessel cells of Arabidopsis (Arabidopsis thaliana) ccr1 mutants. The resulting ccr1 ProSNBE:CCR1 lines had overcome the vascular collapse and had a total stem biomass yield that was increased up to 59% as compared with the wild type. Raman analysis showed that monolignols synthesized in the vessels also contribute to the lignification of neighboring xylary fibers. The cell wall composition and metabolome of ccr1 ProSNBE:CCR1 still exhibited many similarities to those of ccr1 mutants, regardless of their yield increase. In contrast to a recent report, the yield penalty of ccr1 mutants was not caused by ferulic acid accumulation but was (largely) the consequence of collapsed vessels. Finally, ccr1 ProSNBE:CCR1 plants had a 4-fold increase in total sugar yield when compared with wild-type plants.


Figures

Figure 1.
Figure 1.
Expression pattern conferred by ProSNBE. A, Diagram of the ProSNBE:GFP:GUS construct: GFP and GUS reporter genes are driven by three copies of the XCP1-SNBE sequence fused to the CaMV minimal 35S promoter (ProSNBE). NLS, Nuclear localization signal. B, Expression analysis in roots showing GFP in xylary vessels. Propidium iodide was used to counterstain the cell wall. C, Cross section of an elongating internode of the primary inflorescence stem showing GUS staining in developing vessels of the protoxylem. D, Cross section of a nonelongating internode of the primary inflorescence stem showing GUS staining in developing vessels of the metaxylem but not in xylary or interfascicular fibers. E to H, GUS expression analysis in siliques (E), flowers (F), and rosette leaves (G and H), showing reporter gene expression in the vasculature. Black arrowheads indicate cells with GUS staining, and white arrowheads indicate cells lacking GUS staining. For B, transgenic ProSNBE:GFP:GUS seedlings were grown for 20 d in a long-day photoperiod. For C to H, transgenic ProSNBE:GFP:GUS plants were grown for 6 weeks in a short-day photoperiod followed by 5 weeks in a long-day photoperiod. If, Interfascicular fibers; Mx, metaxylem; Pi, pith; Px, protoxylem; V, vessel; Xf, xylary fiber.
Figure 2.
Figure 2.
Phenotype of ccr1 ProSNBE:CCR1 lines. Wild-type, ccr1, and ccr1 ProSNBE:CCR1 plants are shown after cultivation for 6 weeks in a short-day photoperiod followed by 1.5 weeks (A and B) or 5 weeks (C and D) in a long-day photoperiod.
Figure 3.
Figure 3.
Lignin deposition in inflorescence stems of ccr1-6 ProSNBE:CCR1 lines. Transverse stem sections are shown for the wild type, ccr1-6, and ccr1-6 ProSNBE:CCR1 lines. Wiesner and Mäule staining and lignin autofluorescence are shown. If, Interfascicular fibers; Xy, xylem. Bars = 100 µm.
Figure 4.
Figure 4.
Morphology of cell walls of wild-type, ccr1-6, and ccr1-6 ProSNBE:CCR1 stems. Transmission electron microscopy demonstrates the ultrastructure of the interfascicular fibers and xylem regions. Arrows indicate residual cellular content. V, Xylary vessel. Bars = 10 µm.
Figure 5.
Figure 5.
Raman microscopy analysis of cell walls of wild-type, ccr1-6, and ccr1-6 ProSNBE:CCR1 plants. A, Examples of Raman mapping images taken from the xylem and interfascicular fiber region of the wild type, ccr1-6, and ccr1-6 ProSNBE:CCR1 lines by integrating the aromatic stretching vibration from 1,650 to 1,550 cm−1. CCD cts, Charged Coupled Device counts. Bars = 10 µm. B, Extracted average spectra in the lignin aromatic region between 1,700 and 1,550 cm−1 obtained by a region-of-interest study in vessels, xylary fibers, and interfascicular fibers (n = 18: 3 biological replicates × 2 mappings × 3 regions of interest). The marked bands represent 1,657 cm−1 (C=C stretching of coniferyl alcohol plus C=O stretching of coniferaldehyde), 1,633 cm−1 (C=C stretching from the propenoic acid side chain of ferulic acid), and 1,597 cm−1 (aromatic ring stretching of lignin). a.u., arbitrary units.
Figure 6.
Figure 6.
Summary of metabolite profiling of primary inflorescence stems of the wild type, ccr1-6, and ccr1-6 ProSNBE:CCR1. A total of 9,746 peaks were detected over the different samples (wild type, n = 8; ccr1-6, n = 6; and ccr1-6 ProSNBE:CCR1, n = 13). After applying stringent filters, 554 peaks were selected for PCA and statistical analysis. A, PCA of the selected peaks revealed that the first principal component (PC 1; 33.5% of variation) explained mainly the difference between genotypes. The second principal component (PC 2; 15.4% of the variation) reflects the variation within the genotypes. B, Further statistical analysis revealed that the peak intensities of 232 compounds were significantly different in ccr1-6 ProSNBE:CCR1 when compared with the wild type and when compared with ccr1-6. The differentially accumulating metabolites were classified into eight groups. Per group, the number of peaks, corresponding compounds, and annotated compounds are given.
Figure 7.
Figure 7.
List of putatively structurally characterized metabolites with a different abundance in inflorescence stems of ccr1-6 ProSNBE:CCR1 plants as compared with the wild type or ccr1-6 mutants. Eighty-two compounds were characterized, of which the abundance was significantly different between ccr1-6 ProSNBE:CCR1 and the wild type, on the one hand, and/or ccr1-6 ProSNBE:CCR1 and ccr1-6, on the other hand. The differentially accumulating metabolites were classified into eight different groups (Fig. 6B). Each putatively structurally characterized metabolite has a unique number that represents (1) the group that the metabolite belongs to and (2) the ranking within this group. The metabolites are listed per metabolic class, and the dashed lines separate the different groups present in a specific metabolic class. The average peak intensities are represented by a heat map, ranging from low values represented in blue to high values represented in red (wild type, n = 8; ccr1-6, n = 6; and ccr1-6 ProSNBE:CCR1, n = 13).
Figure 8.
Figure 8.
Metabolic map of phenolic and glucosinolate metabolism in the primary inflorescence stems of the wild type, ccr1-6, and ccr1-6 ProSNBE:CCR1 lines. The green highlighted part of the pathway is considered to be the major route for lignin biosynthesis. The gray highlighted part depicts glucosinolate biosynthesis. Dashed arrows represent suggested pathways. Metabolites were classified into one of eight specific groups, based on their abundance in the wild type, ccr1-6, and ccr1-6 ProSNBE:CCR1 (Figs. 6B and 7; Supplemental Table S3). In each group, different metabolite classes are represented (Fig. 7). In the pathway, these different metabolite classes are indicated by round-angled boxes. Per metabolite class, the respective group(s) containing this specific class is (are) indicated, accompanied by heat maps. These heat maps represent the average peak intensities of all characterized metabolites belonging to a specific group for the wild type (first block), ccr1-6 (second block), and ccr1-6 ProSNBE:CCR1 (third block), indicated by a range from blue (lowest values) to red (highest values; see key at bottom). The red number indicates the number of metabolites belonging to this group in a specific metabolic class. Terms not defined in the text are as follows: F5H, FERULATE 5-HYDROXYLASE; COMT, CAFFEIC ACID O-METHYLTRANSFERASE; CAD, CINNAMYL ALCOHOL DEHYDROGENASE; HCALH, HYDROXYCINNAMALDEHYDE DEHYDROGENASE (Vanholme et al., 2012; Vanholme et al., 2013b). C3H/C4H?: Interaction between C3H and C4H has been shown for both Arabidopsis and poplar, but activity of the C3H/C4H heterodimer for the conversion of p-coumaric acid to caffeic acid has only been shown for poplar (Bassard et al., 2012; Chen et al., 2011).
Figure 9.
Figure 9.
Nuclear ploidy levels of wild-type, ccr1-6, and ccr1-6 ProSNBE:CCR1 cells. Flow cytometry analysis is shown for the first leaves at 15 and 25 d post stratification (15 d, n = 4; 25 d, n = 5). Error bars indicate sd. Different letters represent significant differences at the 0.05 significance level (Dunnett-Hsu adjusted Student’s t test).
Figure 10.
Figure 10.
Saccharification efficiency of ccr1-6 ProSNBE:CCR1 plants. A, Cellulose-to-glucose conversions after 192 h of saccharification of senesced inflorescence stems of the wild type, ccr1-6, and ccr1-6 ProSNBE:CCR1. B, Glucose release after 192 h of saccharification per total stem biomass. Samples were saccharified using no pretreatment, acid pretreatment (1 m HCl), or alkaline pretreatment (62.5 mm NaOH). Error bars indicate se; n = 6. Different letters represent significant differences at the 0.01 significance level (Dunnett-Hsu adjusted Student’s t test) per pretreatment.

References

    1. Agarwal UP, Atalla RH (1990) Formation and identification of cis/trans ferulic acid in photoyellowed white spruce mechanical pulp. J Wood Chem Technol 10: 169–190
    1. Agarwal UP, McSweeny JD, Ralph SA (2011) FT-Raman investigation of milled-wood lignins: softwood, hardwood, and chemically modified black spruce lignins. J Wood Chem Technol 31: 324–344
    1. Agarwal UP, Ralph SA, Atalla RH (1997) FT Raman spectroscopic study of softwood lignin. In 9th International Symposium on Wood and Pulping Chemistry: Proceedings, Montréal, Québec, 1997.
    1. Anderson NA, Bonawitz ND, Nyffeler K, Chapple C (2015) Loss of FERULATE 5-HYDROXYLASE leads to mediator-dependent inhibition of soluble phenylpropanoid biosynthesis in Arabidopsis. Plant Physiol 169: 1557–1567 - PMC - PubMed
    1. Bassard JE, Richert L, Geerinck J, Renault H, Duval F, Ullmann P, Schmitt M, Meyer E, Mutterer J, Boerjan W, De Jaeger G, Mely Y, Goossens A, Werck-Reichhart D (2012) Protein-protein and protein-membrane associations in the lignin pathway. Plant Cell 24: 4465–4482 - PMC - PubMed

Publication types

MeSH terms