. 2018 Jan;176(1):910-929.
doi: 10.1104/pp.17.01321. Epub 2017 Nov 20.

Ethylene Receptors Signal via a Noncanonical Pathway to Regulate Abscisic Acid Responses

Affiliations

Ethylene Receptors Signal via a Noncanonical Pathway to Regulate Abscisic Acid Responses

Arkadipta Bakshi et al. Plant Physiol. 2018 Jan.

Abstract

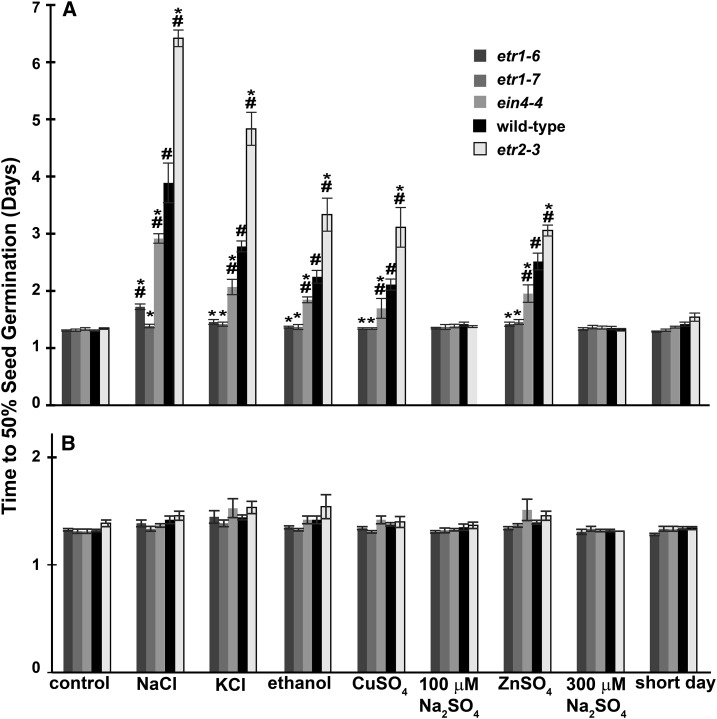
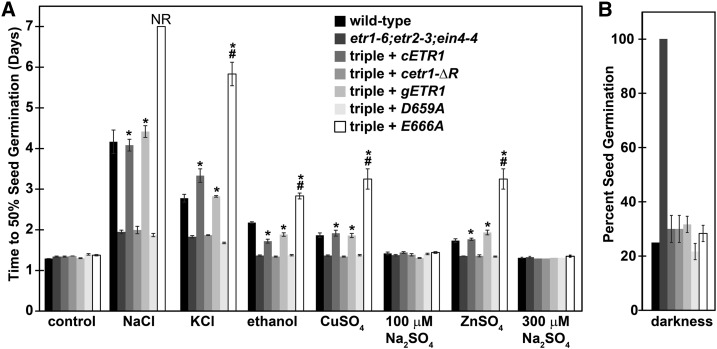
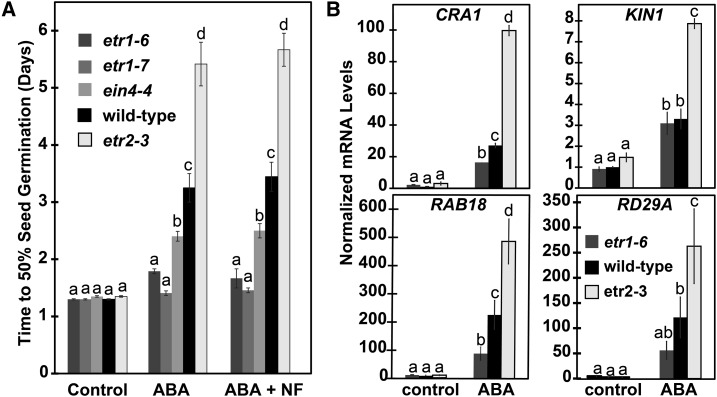
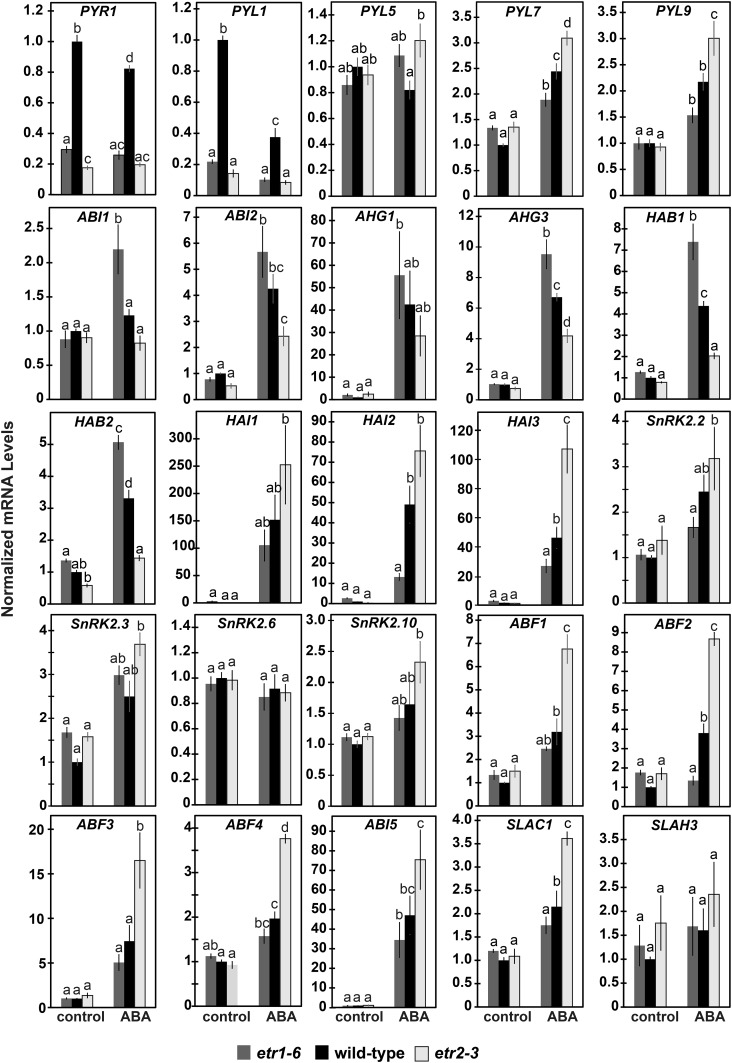
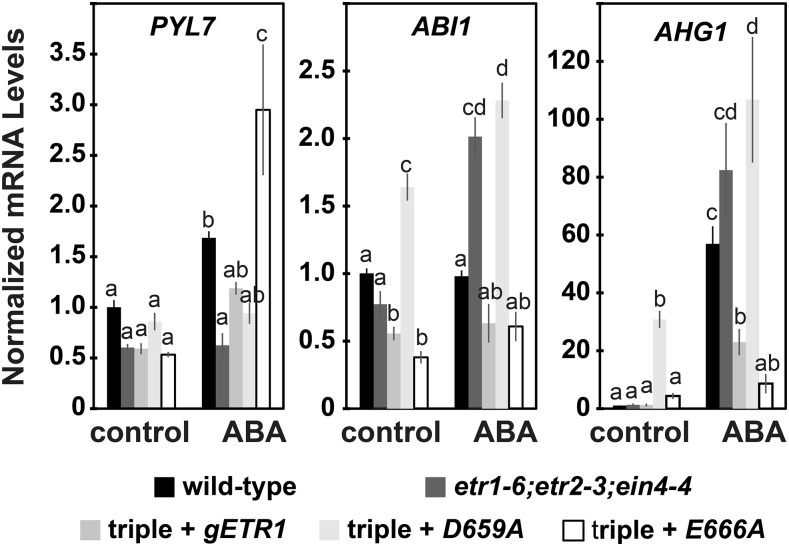
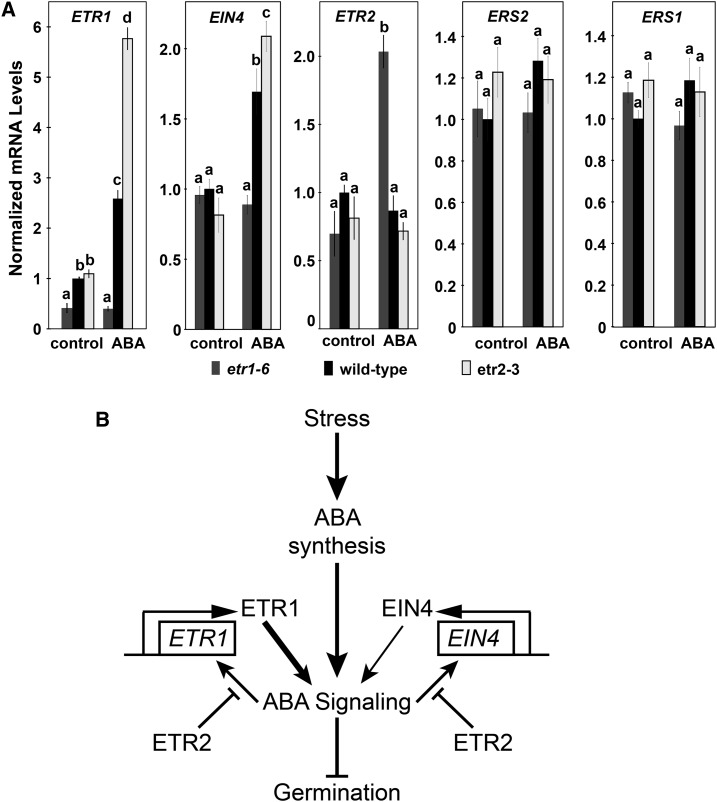
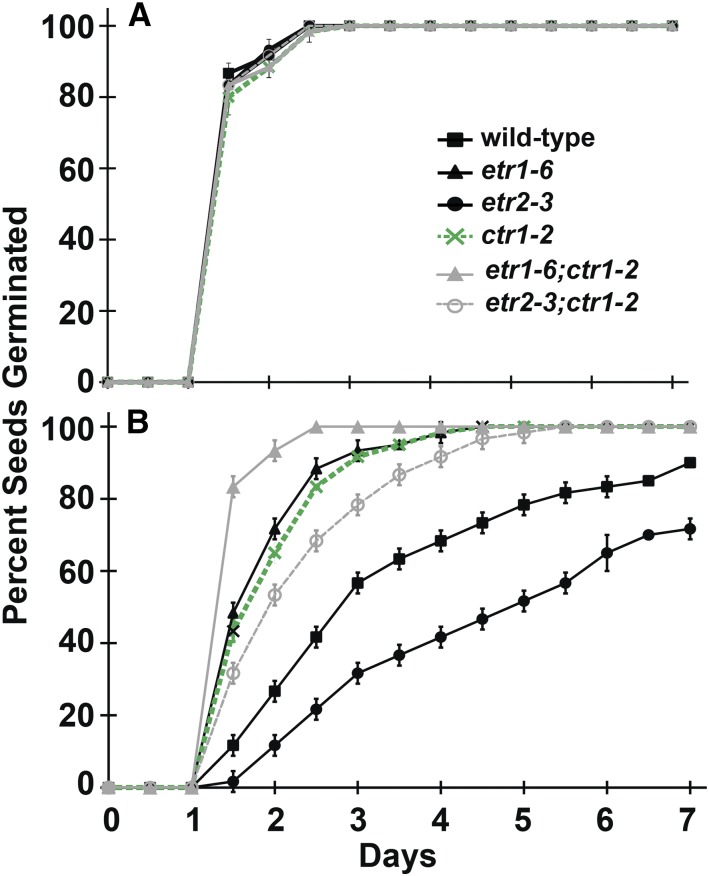
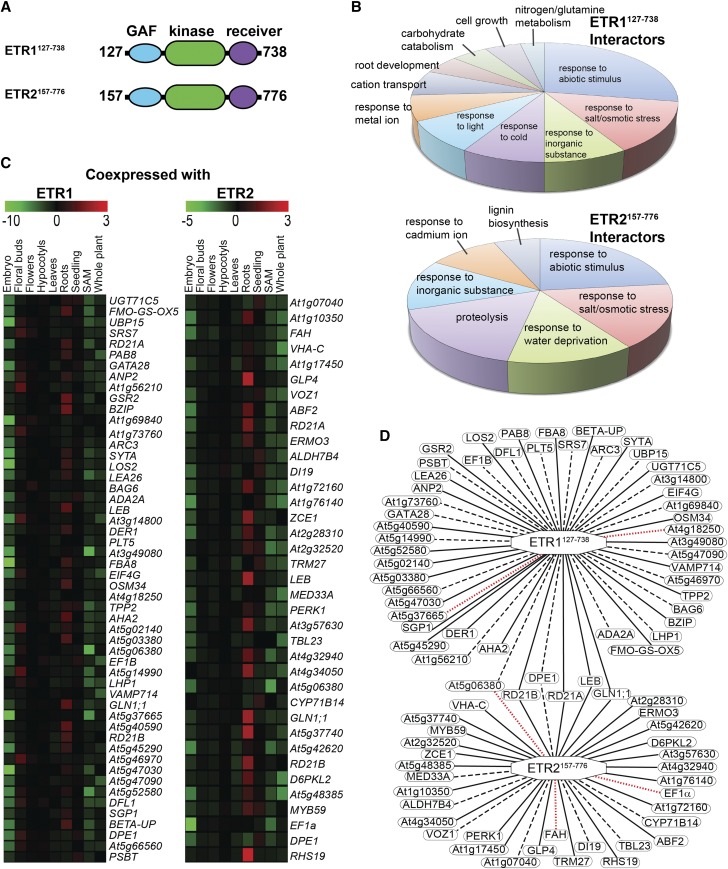
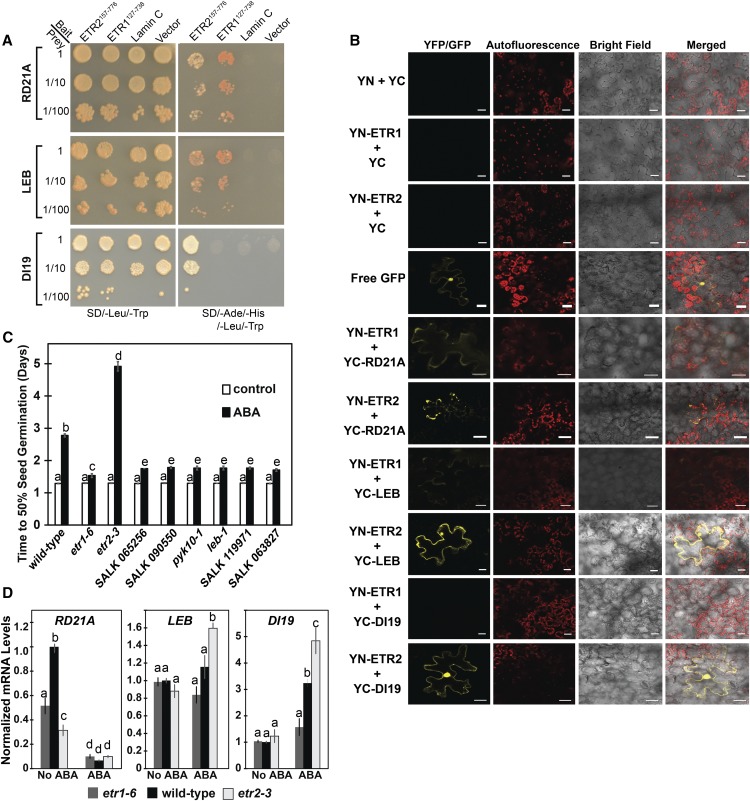
Ethylene is a gaseous plant hormone perceived by a family of receptors in Arabidopsis (Arabidopsis thaliana) including ETHYLENE RESPONSE1 (ETR1) and ETR2. Previously we showed that etr1-6 loss-of-function plants germinate better and etr2-3 loss-of-function plants germinate worse than wild-type under NaCl stress and in response to abscisic acid (ABA). In this study, we expanded these results by showing that ETR1 and ETR2 have contrasting roles in the control of germination under a variety of inhibitory conditions for seed germination such as treatment with KCl, CuSO4, ZnSO4, and ethanol. Pharmacological and molecular biology results support a model where ETR1 and ETR2 are indirectly affecting the expression of genes encoding ABA signaling proteins to affect ABA sensitivity. The receiver domain of ETR1 is involved in this function in germination under these conditions and controlling the expression of genes encoding ABA signaling proteins. Epistasis analysis demonstrated that these contrasting roles of ETR1 and ETR2 do not require the canonical ethylene signaling pathway. To explore the importance of receptor-protein interactions, we conducted yeast two-hybrid screens using the cytosolic domains of ETR1 and ETR2 as bait. Unique interacting partners with either ETR1 or ETR2 were identified. We focused on three of these proteins and confirmed the interactions with receptors. Loss of these proteins led to faster germination in response to ABA, showing that they are involved in ABA responses. Thus, ETR1 and ETR2 have both ethylene-dependent and -independent roles in plant cells that affect responses to ABA.


Figures

Figure 1.
Figure 1.
ETR1 and ETR2 have contrasting roles on seed germination under a range of inhibitory conditions. Germination time-courses for wild-type, etr1-6, etr1-7, ein4-4, and etr2-3 seeds were conducted as described in the “Materials and Methods” and the times for 50% of seeds to germinate were calculated. Germination experiments were conducted in the (A) absence or (B) presence of 100 μM NF to inhibit ABA biosynthesis. Conditions used were: control (using standard conditions described in the “Materials and Methods”), 150 mm NaCl, 150 mm KCl, 100 mm ethanol, 100 μM CuSO4, 100 μM NaSO4, 300 μM ZnSO4, 300 NaSO4, and short days (8-h light:16-h dark). Data represents the average ± sd. Data were analyzed using two-way ANOVA and Tukey’s multiple comparisons test. (*) Statistically different from wild type in that condition. (#) Statistically different from untreated seeds of that seed line (P < 0.05).
Figure 2.
Figure 2.
The rapid germination of etr1;etr2;ein4 triple mutant plants under various inhibitory conditions is differentially rescued by truncated and etr1 receiver domain mutants. A, Germination time-courses were determined for etr1-6;etr2-3;ein4-4 triple mutant plants and these triple mutants were transformed with a cDNA for full-length ETR1 (cETR1) or a truncated ETR1 lacking the receiver domain (cetr1R) or genomic DNA for full-length wild-type ETR1 (gETR1), a D659A mutant, or an E666A mutant. The times for 50% germination were then calculated. Conditions used were control (using standard conditions described in the “Materials and Methods”), 150 mm NaCl, 150 mm KCl, 100 mm ethanol, 100 μM CuSO4, 100 μM NaSO4, 300 μM ZnSO4, and 300 μM NaSO4. B, Percent seed germination of seeds kept in darkness 7 d after planting. For both panels, data are the average ± sd. Data were analyzed using two-way ANOVA and Tukey’s multiple comparisons test. NR, never reached 50% germination in the time-course of the experiment. (*) Denotes the etr1-6;etr2-3;ein4-4 triple mutant transformed with the indicated transgene is statistically different from the triple mutant. (#) The transformant is statistically slower than triple mutant transformed with full-length ETR1 transgene (P < 0.05).
Figure 3.
Figure 3.
ETR1 and EIN4 affect responses to ABA oppositely from ETR2. A, Germination time-courses of wild-type, etr1-6, etr1-7, ein4-4, and etr2-3 seeds in response to 1 μM ABA and 1 μM ABA plus 100 μM NF to block ABA biosynthesis were conducted and the times for 50% seed germination were determined. Data represents the average ± sd. B, The transcript abundance of RAB18, CRA1, KIN1, and RD29A were measured in wild-type, etr1-6, and etr2-3 seeds using real-time qRT-PCR. Seeds were germinated for 2 d in the presence or absence of 1 μM ABA and mRNA extracted. Data were normalized to the levels of At3g12210 in each seed line to calculate the relative transcript level for each gene. These were then normalized to levels of the transcript in untreated wild-type seeds. The average ± se for two biological replicates with three technical replicates each is shown. For both panels, 0.01% (v/v) ethanol was used as a solvent control. Data were analyzed using a two-way ANOVA and Tukey’s multiple comparisons test. In each panel, the different letters indicate significant difference (P < 0.05).
Figure 4.
Figure 4.
ETR1 and ETR2 oppositely affect the transcript abundance of many genes encoding for ABA signaling proteins. The transcript levels of genes in germinating seeds encoding for proteins in the ABA signal transduction pathway were analyzed with real-time qRT-PCR as described in Figure 3. The average ± se for two to three biological replicates with three technical replicates each is shown. In all panels, 0.01% (v/v) ethanol was used as a solvent control. Data were analyzed using a two-way ANOVA and Tukey’s multiple comparisons test. In each panel, different letters indicate significant difference (P < 0.05).
Figure 5.
Figure 5.
The D659A and E666A mutant transgenes oppositely affect the transcript abundance of genes encoding for ABA signaling proteins. The transcript levels of selected genes encoding for ABA signaling proteins were determined for etr1-6;etr2-3;ein4-4 triple mutant plants and these triple mutants transformed with genomic DNA for full-length wild-type ETR1 (gETR1), a D659A mutant, or an E666A mutant. For comparison, data for wild-type seeds are shown. The transcript levels of genes in germinating seeds encoding for proteins in the ABA signal transduction pathway were analyzed with real-time qRT-PCR as described in Figure 3. The average ± se for two biological replicates with three technical replicates each is shown. Data were analyzed using a two-way ANOVA and Tukey’s multiple comparisons test. In each panel, different letters indicate significant difference (P < 0.05).
Figure 6.
Figure 6.
ETR1 and ETR2 affect ABA-induced changes in ETR1, EIN4, and ETR2, but not ERS1 and ERS2 transcripts. A, The transcript levels of the five ethylene receptor isoforms in germinating seeds were analyzed with real-time qRT-PCR as described in Figure 3. The average ± se for two to three biological replicates with three technical replicates each is shown. In all panels, 0.01% (v/v) ethanol was used as a solvent control. Data were analyzed using the two-way ANOVA and Tukey’s multiple comparisons test, and in each panel the different letters indicate significant difference (P < 0.05). B, Model of roles of ETR1, EIN4, and ETR2 in the control of ABA signaling during seed germination. In this model, it is proposed that various stresses increase ABA levels. Previous epistasis indicates that in the presence of ABA, ETR2 inhibits ETR1 and EIN4, which act in parallel to enhance ABA signaling (Wilson et al., 2014a, 2014b). Results here indicate that ETR2 inhibits ETR1 and EIN4 by reducing, but not eliminating, ABA-induced increases in ETR1 and EIN4 transcription. Not shown here, we also found that ETR1 suppresses ABA-induced changes in ETR2 transcript abundance. It is possible that in the presence of ABA, EIN4 is also affecting transcript abundance of ETR2, but this has not yet been studied. The width of the arrows from ETR1 and EIN4 denote the relative signaling strength affecting ABA signaling. It is unknown whether these are direct effects on ABA signaling or happening via intermediaries.
Figure 7.
Figure 7.
ETR1 and ETR2 function independently of the canonical ethylene signaling pathway to alter response to ABA. Double etr1-6;ctr1-2 and etr2-3;ctr1-2 mutant plants were generated and physiologically evaluated. For comparison, wild-type and etr1-6, etr2-3, and ctr1-2 single mutant plants were included. Seed germination time-courses were conducted in the (A) absence and (B) presence of 1 μM ABA.
Figure 8.
Figure 8.
Yeast two-hybrid screen using the cytosolic domains of ETR1 and ETR2 reveals putative overlapping and nonoverlapping interaction partners. A yeast two-hybrid screen was carried out using the cytosolic portion of ETR1 (ETR1127-738) or ETR2 (ETR2157-776) as described in the “Materials and Methods”. A, Diagram of cytosolic portions of ETR1 and ETR2 used for yeast two-hybrid screen. Numbers represent the amino acids included in these constructs. B, GO categorization of proteins identified in this screen as interacting with ETR1127-738 or ETR2157-776. GO enrichment analysis was carried out using DAVID (https://david.ncifcrf.gov/). Only GO categories with a false discovery rate value < 0.05 were included. C, Heatmap showing coexpression patterns for ETR1 and ETR2 interacting proteins. Red indicates the protein has highly correlated gene coexpression with the receptor and green represents highly anticorrelated coexpression. D, Gene coexpression map of the ETR1 and ETR2 interacting partners. Solid edges represent proteins with significantly correlated expression profiles with the receptor in roots. Dashed edges represent proteins with significantly correlated coexpression profiles in at least one tissue, but not roots. Dotted red edges represent no significant correlation in the coexpression profile between the receptor and the gene in question.
Figure 9.
Figure 9.
Three interaction partners affect seed germination in response to ABA. A, Cotransformation analysis was carried out as described in the “Materials and Methods”. Yeast strain AH109 was cotransformed with full-length coding sequences of the selected interacting partners cloned in the prey vector (pGADT7) and C-terminal coding sequences of ETR1 (ETR1127-738) or ETR2 (ETR2157-776) cloned in the bait vector (pGBKT7). Protein-protein interactions were visualized by differential growth on the nonselective synthetic drop-out medium (SD/-Leu/-Trp; left) and on the selective medium (SD/- Leu/-Trp/-His/-Ade; right). B, BiFC in N. benthamiana was carried out with the full-length clones of ETR1 or ETR2 fused to YN and the full-length clones of the indicated proteins fused to the YC as described in the “Materials and Methods”. RD21A, LEB, and DI19 were labeled at their N terminus with YC. ETR1 and ETR2 were labeled at their N terminus (YN-ETR1 and YN-ETR2, respectively) for interaction studies with LEB and RD21A and at their C terminus (ETR1-YN, ETR2-YN) for experiments with DI19. YN+YC, YN-ETR1+YC, and YN-ETR2+YC were included as negative controls and free GFP as a positive control. YFP or GFP fluorescence, chlorophyll autofluorescence, and bright field images were acquired and merged. Scale bar is 25 μm. C, Time for 50% germination of mutants for RD21A (SALK 065256, SALK 090550), LEB (pyk10-1, leb-1), and DI19 (SALK 119971, SALK 063827). Seeds were germinated in the absence or presence of 1 μM ABA as indicated, and the percent germination was determined every 12 h for 7 d and the time for 50% seed germination was calculated. For comparison, the germination of wild-type, etr1-6, and etr2-3 seeds is shown. Data represents the average ± sd. D, The transcript levels of the RD21A, LEB, and DI19 in germinating seeds were analyzed with real-time qRT-PCR as described in Figure 3. The average ± se for two to three biological replicates with three technical replicates each is shown. In (C) and (D), days were analyzed using a two-way ANOVA and Tukey’s multiple comparisons test. Different letters indicate significant difference (P < 0.05).

References

    1. Abeles F, Morgan P, Saltveit MJ (1992) Ethylene in Plant Biology, 2nd Ed. Academic Press, San Diego, CA
    1. Alonso JM, Hirayama T, Roman G, Nourizadeh S, Ecker JR (1999) EIN2, a bifunctional transducer of ethylene and stress responses in Arabidopsis. Science 284: 2148–2152 - PubMed
    1. Antoni R, Gonzalez-Guzman M, Rodriguez L, Rodrigues A, Pizzio GA, Rodriguez PL (2012) Selective inhibition of clade A phosphatases type 2C by PYR/PYL/RCAR abscisic acid receptors. Plant Physiol 158: 970–980 - PMC - PubMed
    1. Bakshi A, Wilson RL, Lacey RF, Kim H, Wuppalapati SK, Binder BM (2015) Identification of regions in the receiver domain of the ETHYLENE RESPONSE1 ethylene receptor of Arabidopsis important for functional divergence. Plant Physiol 169: 219–232 - PMC - PubMed
    1. Beaudoin N, Serizet C, Gosti F, Giraudat J (2000) Interactions between abscisic acid and ethylene signaling cascades. Plant Cell 12: 1103–1115 - PMC - PubMed

Publication types

MeSH terms

LinkOut - more resources