. 2018 Jan;208(1):399-417.
doi: 10.1534/genetics.117.300536. Epub 2017 Nov 20.

Improving Metabolic Health Through Precision Dietetics in Mice

Affiliations

Improving Metabolic Health Through Precision Dietetics in Mice

William T Barrington et al. Genetics. 2018 Jan.

Abstract

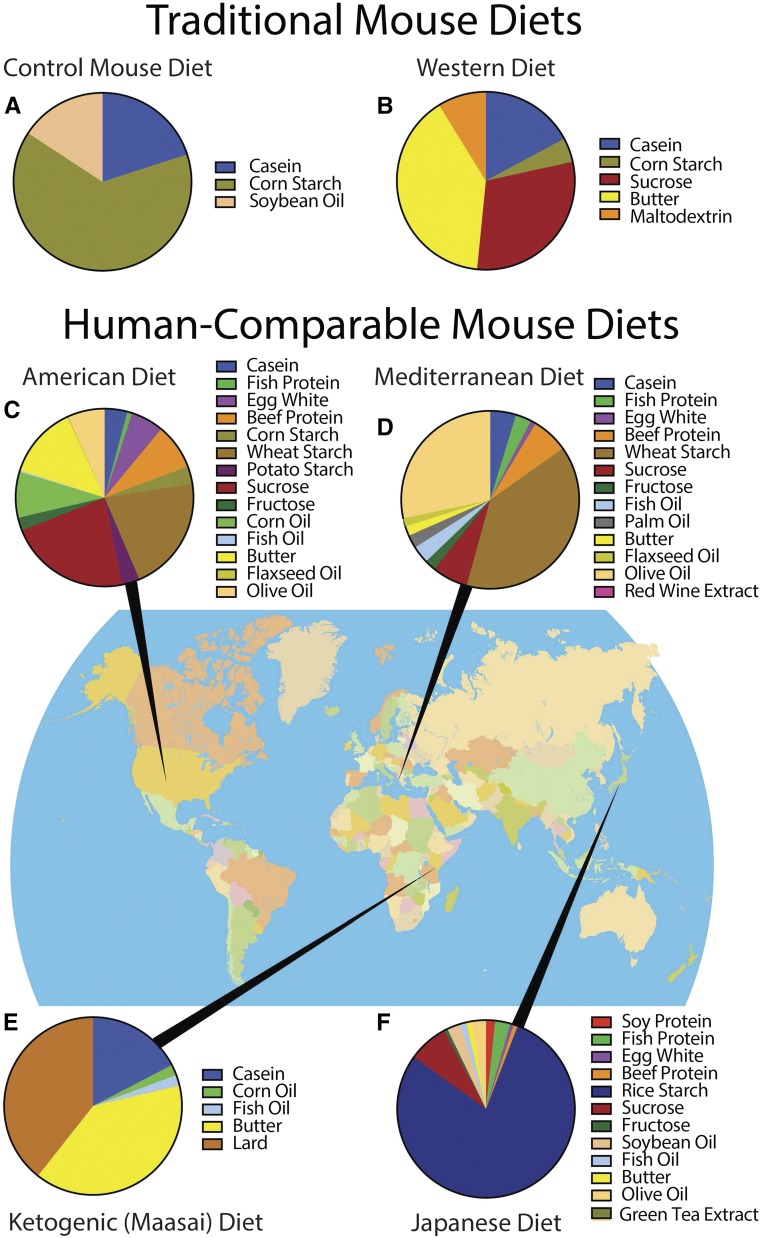
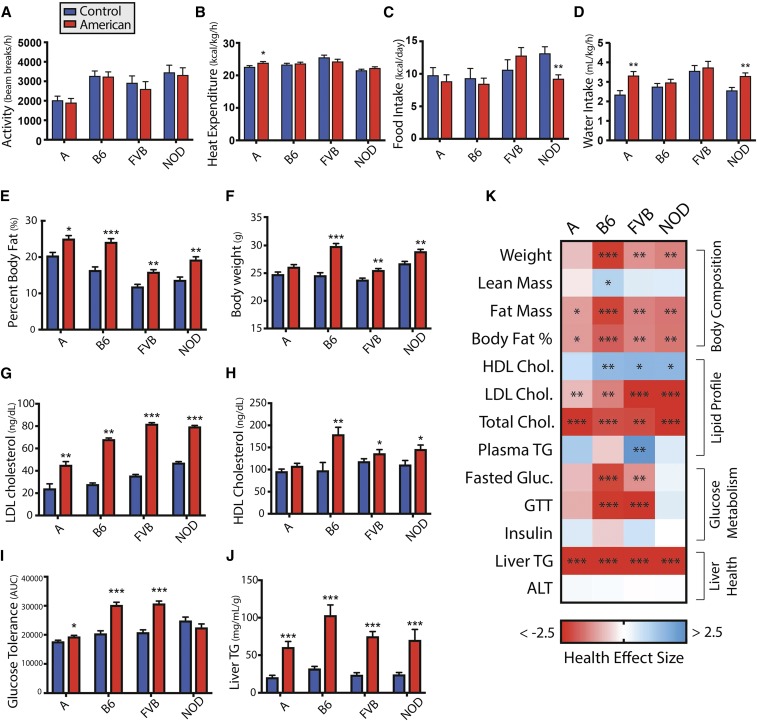
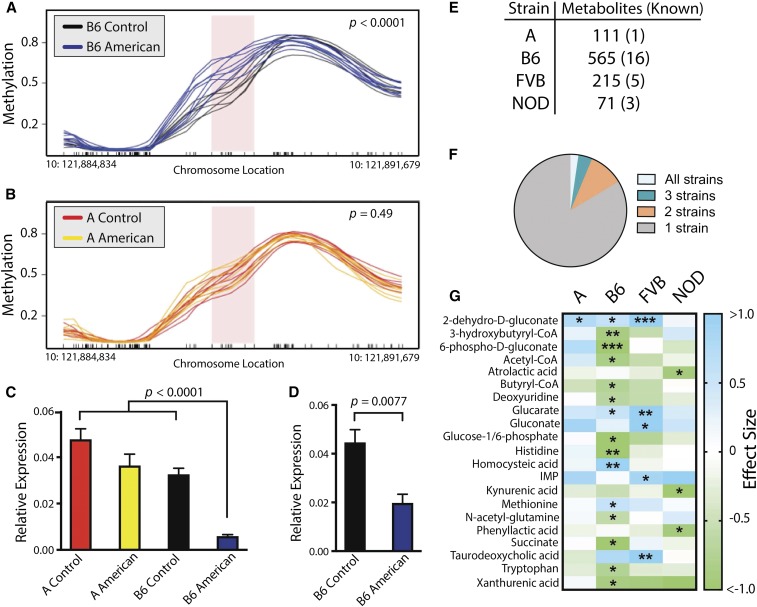
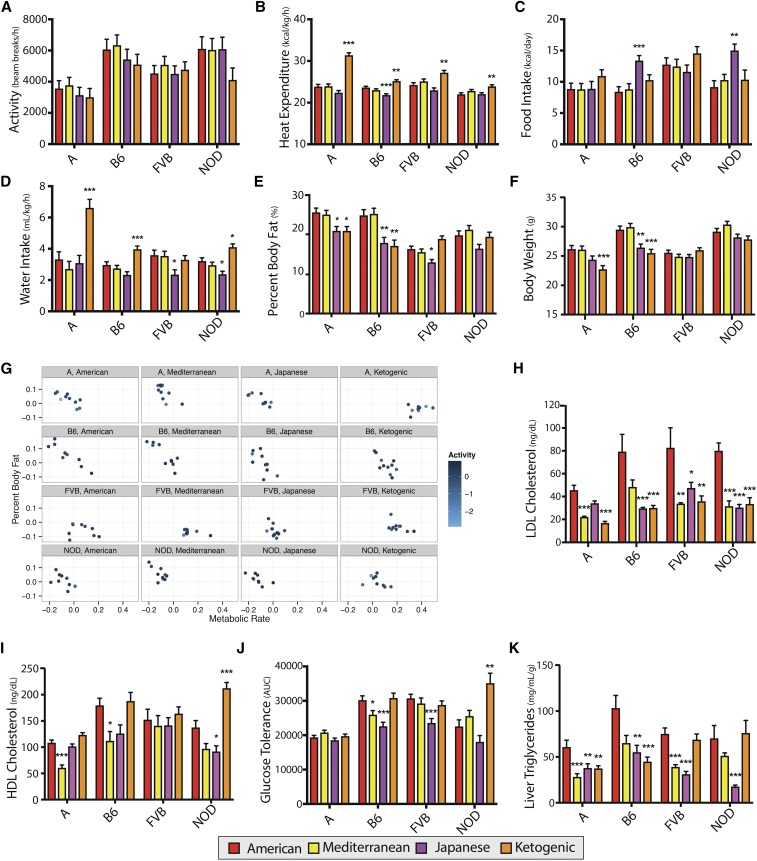
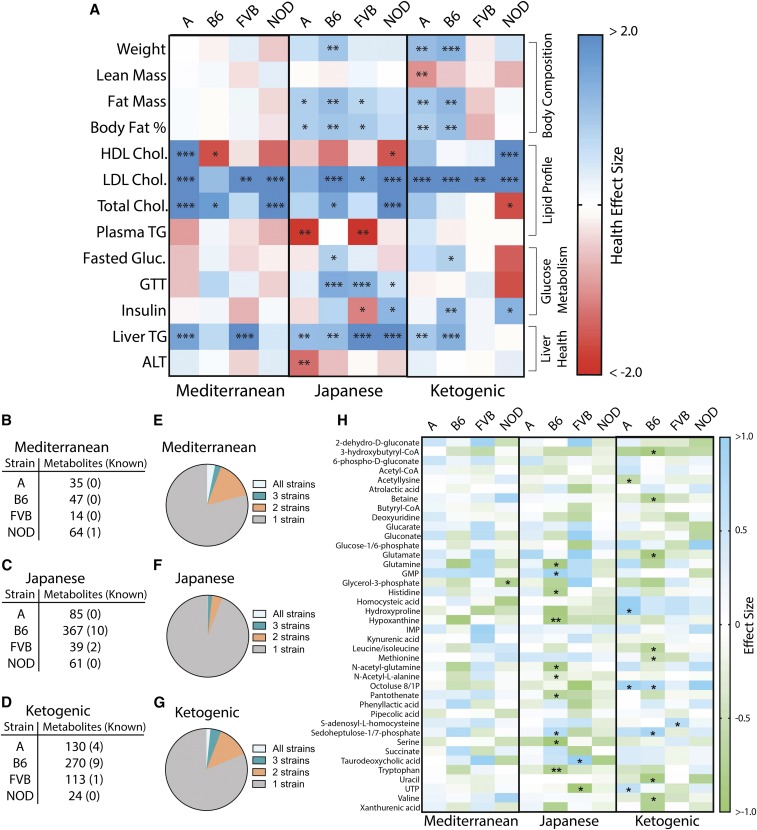
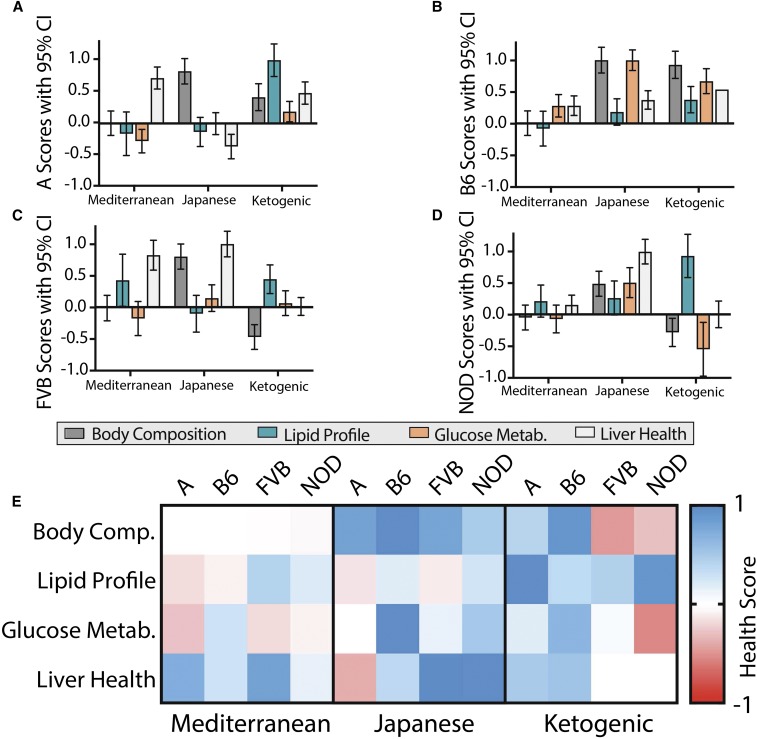
The incidence of diet-induced metabolic disease has soared over the last half-century, despite national efforts to improve health through universal dietary recommendations. Studies comparing dietary patterns of populations with health outcomes have historically provided the basis for healthy diet recommendations. However, evidence that population-level diet responses are reliable indicators of responses across individuals is lacking. This study investigated how genetic differences influence health responses to several popular diets in mice, which are similar to humans in genetic composition and the propensity to develop metabolic disease, but enable precise genetic and environmental control. We designed four human-comparable mouse diets that are representative of those eaten by historical human populations. Across four genetically distinct inbred mouse strains, we compared the American diet's impact on metabolic health to three alternative diets (Mediterranean, Japanese, and Maasai/ketogenic). Furthermore, we investigated metabolomic and epigenetic alterations associated with diet response. Health effects of the diets were highly dependent on genetic background, demonstrating that individualized diet strategies improve health outcomes in mice. If similar genetic-dependent diet responses exist in humans, then a personalized, or "precision dietetics," approach to dietary recommendations may yield better health outcomes than the traditional one-size-fits-all approach.

Keywords: diet; metabolic syndrome; mouse.


Figures

Figure 1
Figure 1
Diet ingredient profiles and geographic origins. (a) The purified control mouse diet, used for comparison to the American diet in our study, is typical of those used in mouse research. (b) Previous studies have evaluated metabolic effects using Western or high-fat diets. Instead, we designed human-comparable diets representative of the dietary patterns in human populations including: (c) a contemporary American diet, (d) a traditional Mediterranean diet, (e) a ketogenic diet analogous to the Maasai diet, and (f) a traditional Japanese diet.
Figure 2
Figure 2
Comparison of metabolic phenotypes in each strain for mice fed the American diet relative to the control mouse diet. Effect of American diet relative to the control mouse diet in each strain for (a) activity (n = 9–10), (b) heat expenditure (n = 9–10), (c) food intake (n = 4–10), (d) water intake (n = 7–10), (e) body weight (n = 19–20), (f) percent body fat (n = 19–20), (g) HDL cholesterol (n = 4–10), (h) LDL cholesterol (n = 4–10), (i) GTT [n = 12–20, except NOD American (n = 4)], and (j) liver triglyceride concentration (n = 13–20). (k) Heatmap of health effect size (Cohen’s d, with higher value indicating improved health and lower value indicating diminished health) for metabolic phenotypes across strains. Data are mean ± SE. * P < 0.05, ** P < 0.01, and *** P < 0.001 by ANOVA between means. A, A/J strain mice; ALT, alanine aminotransferase; AUC, area under the curve; B6, C57BL/6J strain mice; FVB, FVB/NJ strain mice; GTT, glucose tolerance test; HDL high-density lipoprotein; LDL, low-density lipoprotein; NOD, NOD/ShiLtJ strain mice; TG, triglyceride.
Figure 3
Figure 3
Genetic-by-diet interactions in the methylation status of the Avpr1a locus and liver metabolome alterations. (a) B6 mice fed the American diet are hypermethylated relative to those fed the control mouse diet at the Avpr1a locus (n = 8), P < 0.0001 by Student’s t-test. (b) American diet feeding did not alter methylation status in the A strain (n = 7–8), P = 0.49 by Student’s t-test. (c) Transcript expression of Avpr1a was reduced by 84% in B6 mice fed the American diet relative to other strain-diet groups in mice fed diets for 6 months (n = 4–5), P < 0.0001 by ANOVA. (d) Transcript expression of Avpr1a is reduced by 54% in B6 mice fed the American diet for 2 weeks (n = 4), P = 0.0077 by Student’s t-test. (e) Number of liver metabolites, including both known and unknown, significantly altered by the American diet relative to the control mouse diet. (f) Proportion of metabolites significantly changed in all four strains (2%), three strains (4%), two strains (10%), or unique to one strain (84%). (g) Heatmap of effect sizes (Cohen’s d) for known metabolites significantly altered by the American diet relative to the control mouse diet across strains. * P < 0.05, ** P < 0.01, and *** P < 0.001 by ANOVA between means with Benjamin–Hochberg correction factor. A, A/J strain mice; B6, C57BL/6J strain mice; FVB, FVB/NJ strain mice; NOD, NOD/ShiLtJ strain mice.
Figure 4
Figure 4
Comparison of metabolic phenotypes in each strain for mice fed Mediterranean, Japanese, or ketogenic diets relative to the American diet. Effects of Mediterranean, Japanese, and ketogenic diets relative to the American diet in each strain are shown for (a) activity (n = 8–10), (b) heat expenditure (n = 8–10), (c) food intake (n = 4–10), (d) water intake (n = 7–10), (e) body weight (n = 17–20), and (f) percent body fat (n = 17–20). The influence of activity and metabolic rate on percent body fat varies by strain and diet, as shown for mice in which metabolic rate and activity was measured (g). Effects of Mediterranean, Japanese, and ketogenic diets relative to the American diet in each strain are shown for (h) HDL cholesterol (n = 4–10), (i) LDL cholesterol (n = 4–10), (j) glucose tolerance test (n = 9–20), and (k) liver triglyceride concentration (n = 11–20). Data are mean ± SE. * P < 0.05, ** P < 0.01, and *** P < 0.001 by ANOVA between means, with Dunnett’s correction to the American diet within each strain. A, A/J strain mice; B6, C57BL/6J strain mice; FVB, FVB/NJ strain mice; HDL high-density lipoprotein; LDL, low-density lipoprotein; NOD, NOD/ShiLtJ strain mice.
Figure 5
Figure 5
Comparison of metabolic phenotypes and liver metabolites in mice fed Mediterranean, Japanese, or ketogenic diets relative to the American diet. (a) Heatmap of health effect size (Cohen’s d, with higher value indicating improved health and lower value indicating diminished health) for metabolic phenotypes across strains. * P < 0.05, ** P < 0.01, and *** P < 0.001 by ANOVA between means, with Dunnett’s correction to the American diet within each strain. Number of known and unknown liver metabolites significantly altered compared to the American diet for (b) Mediterranean diet, (c) Japanese diet, and (d) ketogenic diet. Proportion of metabolites significantly changed in all four strains, three strains, two strains, or unique to one strain for (e) Mediterranean, (f) Japanese, and (g) ketogenic diets. (h) Heatmap of effect sizes (Cohen’s d) of known metabolites significantly altered relative to the American diet across strains, including metabolites that differed between American and control mouse diets (Figure 3g). * P < 0.05, ** P < 0.01, and *** P < 0.001 by ANOVA between means with Benjamin–Hochberg correction factor. A, A/J strain mice; ALT, alanine aminotransferase; B6, C57BL/6J strain mice; FVB, FVB/NJ strain mice; GTT, glucose tolerance test; HDL high-density lipoprotein; LDL, low-density lipoprotein; NOD, NOD/ShiLtJ strain mice; TG, triglyceride.
Figure 6
Figure 6
Scores of four health categories for alternative diets relative to the American diet in each strain. Health scores indicate cumulative health effects of alternative diets relative to the American diet for four categories: body composition (lean mass, fat mass, and percent body fat), lipid profile (HDL, LDL, and plasma triglycerides), glucose metabolism (fasted glucose, fasted insulin, and GTT), and liver health (liver triglycerides, ALT). A positive score represents improved health and a negative score represents diminished health. Scores and 95% C.I.s are shown for (a) A, (b) B6, (c) FVB, and (d) NOD . (e) The data are also represented in a heat map for comparison, with red showing improved health scores relative to the American diet. A, A/J strain mice; ALT, alanine aminotransferase; B6, C57BL/6J strain mice; FVB, FVB/NJ strain mice; GTT, glucose tolerance test; HDL high-density lipoprotein; LDL, low-density lipoprotein; NOD, NOD/ShiLtJ strain mice.
Figure 7
Figure 7
Mean Health Scores for comparison of overall metabolic health of mice fed alternative diets relative to the American diet in each strain. The four health category scores (Figure 6) were averaged to provide a measure of overall metabolic health for each alternative diet relative to the American diet. A positive score represents improved health and a negative score represents diminished health. (a) Scores were calculated with body composition included and are shown with 95% C.I. or (b) are represented by a heat map. (c) Scores were also calculated without the body composition parameter and are shown with 95% C.I. or (d) are represented by a heat map. A, A/J strain mice; B6, C57BL/6J strain mice; FVB, FVB/NJ strain mice; NOD, NOD/ShiLtJ strain mice.

References

    1. Accurso A., Bernstein R. K., Dahlqvist A., Draznin B., Feinman R. D., et al. , 2008. Dietary carbohydrate restriction in type 2 diabetes mellitus and metabolic syndrome: time for a critical appraisal. Nutr. Metab. (Lond.) 5: 9. - PMC - PubMed
    1. Almind K., Kahn C. R., 2004. Genetic determinants of energy expenditure and insulin resistance in diet-induced obesity in mice. Diabetes 53: 3274–3285. - PubMed
    1. Aoyagi T., Birumachi J., Hiroyama M., Fujiwara Y., Sanbe A., et al. , 2007. Alteration of glucose homeostasis in V1a vasopressin receptor-deficient mice. Endocrinology 148: 2075–2084. - PubMed
    1. Arnold A. P., Cassis L. A., Eghbali M., Reue K., Sandberg K., 2017. Sex hormones and sex chromosomes cause sex differences in the development of cardiovascular diseases. Arterioscler. Thromb. Vasc. Biol. 37: 746–756. - PMC - PubMed
    1. Backhed F., Ding H., Wang T., Hooper L. V., Koh G. Y., et al. , 2004. The gut microbiota as an environmental factor that regulates fat storage. Proc. Natl. Acad. Sci. USA 101: 15718–15723. - PMC - PubMed

Publication types