. 2017 Nov 21;8(1):1640.
doi: 10.1038/s41467-017-01601-5.

UNC93B1 interacts with the calcium sensor STIM1 for efficient antigen cross-presentation in dendritic cells

Affiliations

UNC93B1 interacts with the calcium sensor STIM1 for efficient antigen cross-presentation in dendritic cells

Sophia Maschalidi et al. Nat Commun. .

Abstract

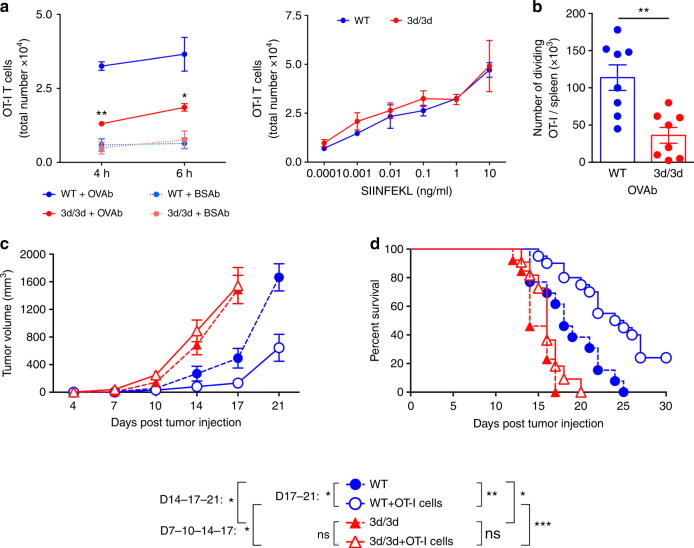
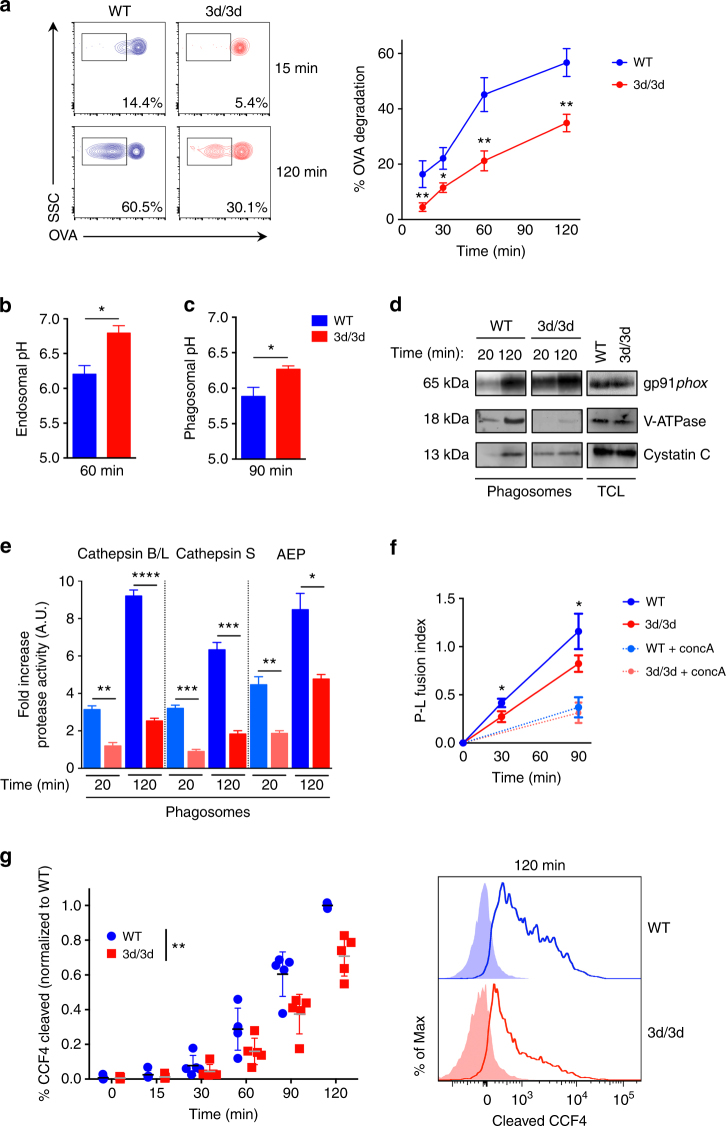
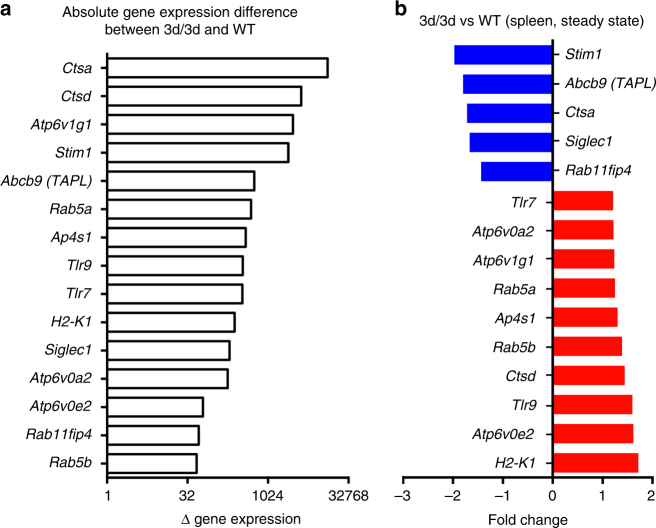
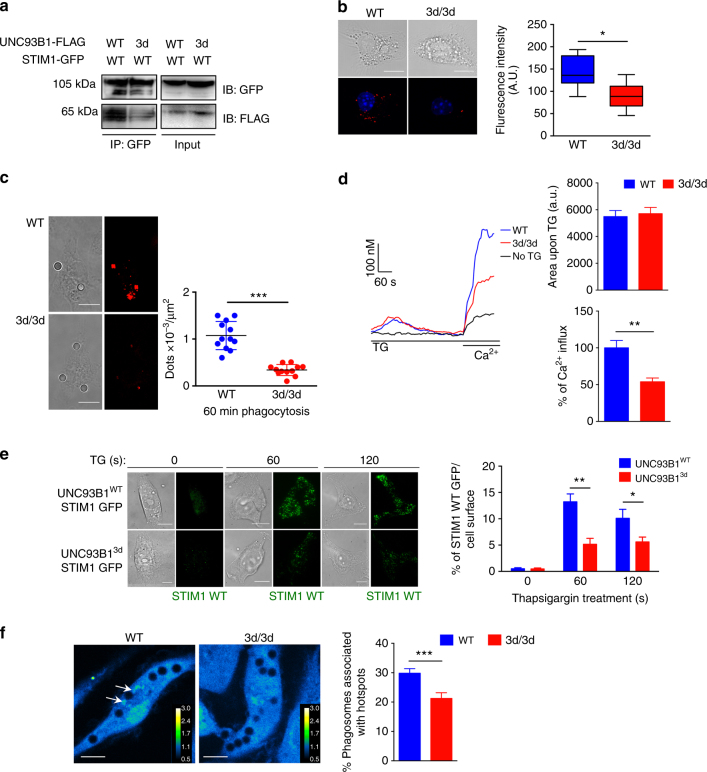
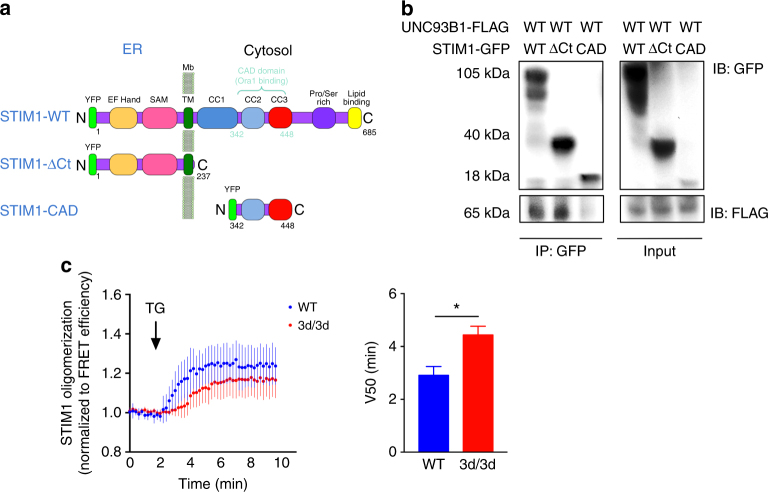
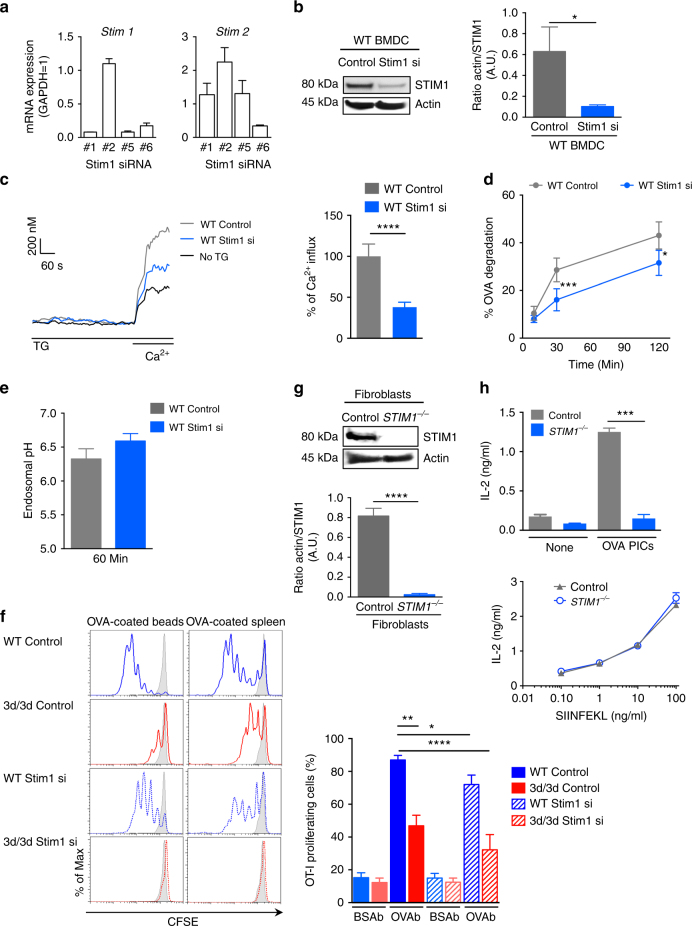
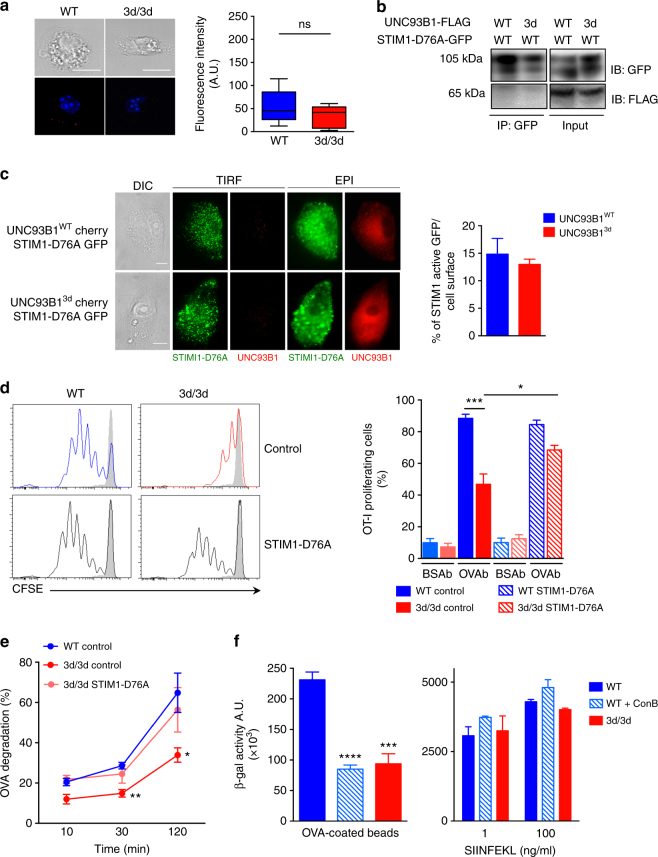
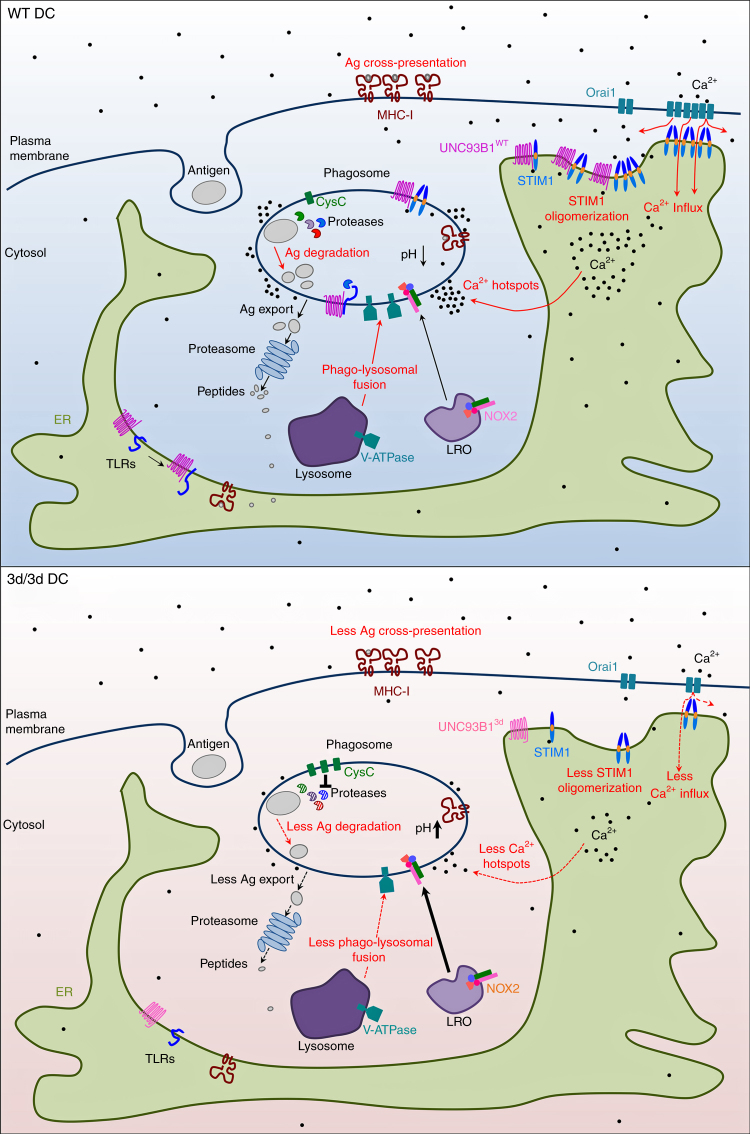
Dendritic cells (DC) have the unique ability to present exogenous antigens via the major histocompatibility complex class I pathway to stimulate naive CD8+ T cells. In DCs with a non-functional mutation in Unc93b1 (3d mutation), endosomal acidification, phagosomal maturation, antigen degradation, antigen export to the cytosol and the function of the store-operated-Ca2+-entry regulator STIM1 are impaired. These defects result in compromised antigen cross-presentation and anti-tumor responses in 3d-mutated mice. Here, we show that UNC93B1 interacts with the calcium sensor STIM1 in the endoplasmic reticulum, a critical step for STIM1 oligomerization and activation. Expression of a constitutively active STIM1 mutant, which no longer binds UNC93B1, restores antigen degradation and cross-presentation in 3d-mutated DCs. Furthermore, ablation of STIM1 in mouse and human cells leads to a decrease in cross-presentation. Our data indicate that the UNC93B1 and STIM1 cooperation is important for calcium flux and antigen cross-presentation in DCs.


Conflict of interest statement

The authors declare no competing financial interests.

Figures

Fig. 1
Fig. 1
The UNC93B1 mutation 3d impairs antigen cross-presentation and tumor response. a CD11c+CD8+ cDCs purified from WT and 3d/3d mice were incubated with different concentrations of OVA beads (OVAb) or OVA peptide (SIINFEKL) for 4 or 6 h before co-cultured with CD8+ OT-I T cells for 72 h. T cell activation was monitored by evaluation of the total number of T cells. Graphs show mean ± S.E.M. (n = 3). Statistical significance was determined by unpaired t-test. *P < 0.05, **P < 0.01. b WT and 3d/3d mice were intravenously injected with CFSE-labeled OT-I T cells and 16 h later immunized with OVAb. T cell proliferation was monitored by CFSE dilution 72 h later. Graph shows the number of dividing OT-I T cells per spleen of immunized mice (n = 8 mice for WT or 3d/3d; **P < 0.01 via unpaired t-test; mean ± S.E.M.). c, d UNC93B1 sufficient (WT, circle) and deficient (3d/3d, triangles) mice were injected with B16-OVA cells (2 × 105, s.c.) on day 0. When indicated, mice were adoptively transferred with OT-I T cells (2.5 × 106, i.v. open symbols, plain lines) on day 1. Tumor size was measured every 2–4 days and survival was monitored daily. Data are illustrated as: c tumor volume (mean ± S.E.M.), d percentage of mice survival, and were pooled from three independent experiments (11–15 mice/group). Statistical analyses were done by Log-Rank (right, survival curves) and multiple t-tests (left, tumor volume); *P < 0.05; **P < 0.001, ***P < 0.001, ns for not significant
Fig. 2
Fig. 2
Phagosomal acidification and proteolysis are compromised in 3d/3d DCs. a BM-DCs were incubated with OVAb for 15 min (pulse), and cargo fate (OVA Alexa-488 staining) was monitored by flow cytometry on phagosomes for the indicated chase points. The data displayed on the left panel are representative of one experiment and on the right panel is the quantification of percentage of OVA degradation (mean ± S.E.M., n = 4; *P < 0.05; **P < 0.01 using unpaired t-test). b For endosomal pH measurement, WT and 3d/3d DCs were pulsed for 10 min with FITC and Alexa-647-coupled dextrans (40 kDa) and chased for 50 min. Graph shows mean ± S.E.M. (n = 3) *P < 0.05 by unpaired t-test. c Phagosomal pH (90 min) was measured using ratiometric imaging by exposing cells to FITC-coupled OVA-coated zymosan (mean ± S.E.M., n = 3, *P < 0.05 via unpaired t-test). d Phagosomes from WT or 3d/3d DC were purified after 20 min or 2 h of particle internalization. Protein expression of gp91phox, V-ATPase and Cystatin C was detected either in total lysate (TCL, 50 μg) or in phagosomes (5 μg). Data are representative of three experiments. e Proteases’ activity in early (20 min) or late (120 min) phagosomes from WT (blue histogram) and 3d/3d (red histogram) DCs were measured with specific fluorescent substrates. Graphs show mean ± S.E.M., n = 3, *P < 0.05, **P < 0.01, ***P < 0.001, ****P < 0.0001 using unpaired t-test. f Phago-lysosome fusion (P-L) was measured by exposing cells loaded with lysosomal FRET acceptor Alexa-594-HA to donor Alexa-488 OVAb (n = 4). Cells were treated or not with ConcA as a negative control(n = 2) (*P < 0.05, unpaired t-test mean ± S.D.). g Percentages of β-lactamase transport to the cytosol were measured by loading WT and 3d/3d DCs with CCF4 dye followed by incubation with β-lactamase for the indicated time points (left panel, each dot corresponds to one experiment, n = 5). Representative histogram (right panel) of CCF4 cleaved product at 120 min in WT (blue solid line) and 3d/3d (red solid line). DCs incubated with CCF4 alone are shown in dashed lines **P < 0.01 by two-way ANOVA comparing all time points
Fig. 3
Fig. 3
Expression of Stim1 mRNA is downregulated in 3d/3d spleen cells. Histograms show a the absolute gene expression difference between 3d/3d and WT mice for proteins involved in endolysosomal maturation and antigen presentation and b the relative fold changes in gene expression in 3d/3d vs. WT splenocytes (genes upregulated are shown in red and downregulated in blue)
Fig. 4
Fig. 4
Reduced Unc93b13d-STIM1 association compromises STIM1 function. a Fibroblasts expressing STIM1-WT-GFP-tagged and UNC93B1WT or UNC93B13d-FLAG-tagged, plasmids were lysed and STIM1 was immunoprecipitated with GFP beads and immunoblotted with anti-GFP and anti-FLAG antibodies. b In WT and 3d/3d DCs transfected with STIM1-WT-GFP-plasmid, STIM1–UNC93B1 interaction was detected using Duolink proximity ligation assay with anti-GFP and anti-UNC93B1-specific antibodies. Cells are seen in brightfield (top panel). PLA signals are shown in red and nuclei in blue (bottom panel) and quantified with Image J (n = 11 cells; *P < 0.05). Bars = 10 μm. c Representative figures and quantification of PLA signals (dots/μm2) after 60 min of phagocytosis of 3 μm beads by WT and 3d/3d DCs transfected with STIM1-WT-GFP cDNA (n = 12 cells; ***P < 0.001). Bars = 10 μm. d Averaged Ca2+ signals in WT and 3d/3d DCs loaded with fluo4-AM as described in Methods section. Cells were stimulated with 1 μM TG (thapsigargin) in Ca2+-free medium before addition of 2 mM Ca2+ for the time periods indicated by the horizontal bars. One representative experiment is presented. Histograms summarize five separate experiments (triplicates) showing the area of the fluorescence signal under TG-induced response in the absence of external Ca2+ and percentage of influx following addition of 2 mM Ca2+ (mean ± S.E.M.; **P < 0.01). e Fibroblasts were co-transduced with STIM1-WT-GFP- and UNC93B1WT or UNC93B13d-Cherry-tagged plasmids followed by treatment with TG in Ca2+-free Ringer’s solution for the time points indicated or left untreated. Representative TIRF images of STIM1-WT-GFP (left panel) and quantification of percentage of fluorescence intensity per cell area using Image J (n = 15 cells; *P < 0.05; **P < 0.01). Bars = 10 μm. f Localized Ca2+ traces near phagosomes (green dots, white arrow) were measured in WT and 3d/3d DC loaded with 4 μM Fluo-8 beads for 30 min uptake and 2.5 μM BAPTA. The color-coded ratio images represent Fluo-8 fluorescence divided by the average cytosolic Fluo-8 fluorescence (left panels) and quantification shows percentage of periphagosomal Ca2+ hotspots (n = 4 experiments/462–660 phagosomes for WT and 136–200 phagosomes for 3d/3d DCs) (right panel; mean ± S.E.M.; ***P < 0.001). Bars = 10 μm. For a, b, c, e one experiment out of three is shown. Statistics are performed via unpaired t-test
Fig. 5
Fig. 5
UNC93B1 association with STIM1 ER-luminal is required for STIM1 oligomerization. a Schematic representation of STIM1 full-length protein (WT) and STIM1 mutants (STIM1-ΔCt and STIM1-CAD) used in this study. b Fibroblasts expressing GFP-tagged STIM1- WT, −ΔCT and −CAD and UNC93B1WT-FLAG-tagged plasmids were immunoprecipitated with GFP beads and immunoblotted with anti-GFP and anti-FLAG antibodies. One experiment representative out of two is shown. c STIM1 oligomerization was followed in HeLa cells in the presence of either Cherry-tagged WT or 3d-mutated UNC93B1 by measuring the increase in the FRET efficiency of YFP-tagged and CFP-tagged STIM1 upon stimulation with 1 μM TG over time. The V50 parameter is reported as the time-to-half–maximum FRET efficiency. Graph shows mean ± S.E.M. (n = 3 experiments); *P < 0.05 by paired t-test
Fig. 6
Fig. 6
Impaired antigen degradation and cross-presentation in cells with STIM1 ablation. a Quantitative PCR analysis of Stim1 and Stim2 gene expression in DCs nucleofected with Stim1-specific siRNA (mean ± S.E.M.; n = 3 experiments). b Immunoblot of STIM1 and actin expression in WT (control siRNA) and Stim1-silenced (siRNA #5) DCs and quantification of actin/STIM1 ratio of three independent experiments (**P < 0.01 via unpaired t-test). c Averaged Ca2+ signals in control and STIM1-silenced DCs loaded with fluo-4AM and stimulated with TG in Ca2+-free solution before adding 2 mM Ca2+. One representative experiment is shown (left panel) (n = 3 × 105 cells) and graph shows Ca2+ influx (right) from three independent experiments normalized to siRNA control cells (****P < 0.0001 via paired t-test). d Proteolysis was measured by quantifying the degradation of OVA in control and STIM1-silenced phagosomes for the indicated time points (n = 3 experiments; mean ± S.E.M.; *P < 0.05, ***P < 0.001 via paired t-test). e Endosomal pH in control and STIM1-silenced DCs pulsed for 10 min with FITC-coupled and Alexa-647-coupled dextrans and chased for 50 min (n = 3; mean ± S.E.M.). f DCs knocked down for STIM1 or not from WT and 3d/3d mice were challenged with BSAb, OVAb, or OVA-transfected splenocytes as sources of exogenous antigen before co-culture with CFSE-labeled OT-I T cells. T cell proliferation was monitored by flow cytometry 3 days later. Representative histogram plots are shown (left). Quantification (right) of OT-I cell division is shown as mean percentage of proliferating cells (n = 3; mean ± S.E.M.; *P < 0.05; **P < 0.01; ****P < 0.0001 using unpaired t-test). g Immunoblot analysis of STIM1 and actin protein expression in control human fibroblasts and fibroblasts from a patient with STIM1 deficiency and quantification of actin/STIM1 ratio. ****P < 0.01; n = 3 (unpaired t-test). h Control and STIM1-deficient FcγRIIA-EGFP-Kb-transduced human fibroblasts were stimulated with precipitated OVA immunocomplexes (OVA pICs) or BSA pICs (none) as control (upper panel) or SIINFEKL peptide (lower panel) before co-culture with B3Z hybridoma. IL-2 secretion was measured by ELISA (n = 3; mean ± S.E.M.; ***P < 0.001 via unpaired t-test)
Fig. 7
Fig. 7
Active STIM1 restores antigen proteolysis and cross-presentation in 3d/3d DCs. a Detection of STIM1 active (STIM1-D76A) and UNC93B1 interaction using Duolink proximity ligation assay (PLA) with anti-GFP (STIM1-D76A) and anti-UNC93B1-specific antibodies in WT or 3d/3d DCs. Quantification of mean fluorescence using ImageJ software (n = 12 cells; mean ± S.E.M.; ns for non-significant). One experiment out of three is shown. Bars = 10 μm. b Fibroblasts expressing GFP-tagged STIM1-D76A and WT or 3d-mutated UNC93B1-FLAG-tagged plasmids were immunoprecipitated with GFP beads (STIM1-D76A) and immunoblotted with anti-GFP and anti-FLAG antibodies. One experiment representative out of two is shown. c Fibroblasts were transiently co-transduced with STIM1-D76A-GFP and WT or 3d-mutated UNC93B1-Cherry-tagged plasmids. Representative TIRF and EPI images of STIM1 active and UNC93B1 (left panel) and quantification of percentage of GFP fluorescence intensity per cell area using ImageJ software (n = 15 cells). One experiment out of two is shown. Bars = 10 μm. d DCs from WT and 3d/3d mice, transfected with STIM1-D76A-GFP or control GFP plasmids, were challenged with OVAb for 6 h before co-culture with CFSE-labeled OT-I T cells. T cell proliferation was monitored by flow cytometry 3 days later (n = 3; mean ± S.E.M.; *P < 0.05, ***P < 0.001 via unpaired t-test). e Phagosomal OVA degradation was measured at different time points in WT and 3d/3d DCs transfected with control GFP or with STIM1-D76A-GFP plasmids (n = 3 experiments; mean ± S.E.M.; *P < 0.05, **P < 0.01 via unpaired t-test). f WT and 3d/3d DCs were treated with ConB (20 nM) 10 min prior addition of OVAb (left panel) or SIINFEKL peptide (right panel) for 6 h. Cells were then extensively washed and co-cultured with B3Z CD8+ T cell hybridoma. T cell activation was monitored by measuring β-galactosidase activity (n = 3 experiments; mean ± S.E.M.; ***P < 0.001, ****P < 0.0001 via unpaired t-test)
Fig. 8
Fig. 8
Function of UNC93B1 and STIM1 in Ca2+ influx and antigen cross-presentation in DCs. In WT DCs, UNC93B1 associates with STIM1 through their ER-facing domains resulting in STIM1 oligomerization and activation. In DCs carrying the 3d mutation, UNC93B1-STIM1 association is compromised leading to decreased STIM1 oligomerization and activation, and to reduced SOCE and periphagosomal Ca2+ signaling. UNC93B1 participates to events critical for efficient cross-presentation either STIM1 dependent (antigen degradation, phago-lysosomal fusion, phagosomal Ca2+ hotspots, in red in the scheme) or STIM1 independent (endosomal/phagosomal pH, NOX2 recruitment and ROS production, cathepsins activity and antigen export to the cytosol, TLR folding and transport, highlighted in black). In 3d/3d cells, all these parameters are severely impaired resulting in inefficient antigen cross-presentation. In summary, UNC93B1, together with STIM1, are important regulators of antigen cross-presentation by modulating phagosomal homeostasis and calcium physiology in DCs. Ag: antigen, CysC: cystatin C, LRO: lysosome-related organelle

Similar articles

Cited by

References

    1. Joffre OP, Segura E, Savina A, Amigorena S. Cross-presentation by dendritic cells. Nat. Rev. Immunol. 2012;12:557–569. doi: 10.1038/nri3254. - DOI - PubMed
    1. van Endert P. Intracellular recycling and cross-presentation by MHC class I molecules. Immunol. Rev. 2016;272:80–96. doi: 10.1111/imr.12424. - DOI - PubMed
    1. Hildner K, et al. Batf3 deficiency reveals a critical role for CD8alpha+ dendritic cells in cytotoxic T cell immunity. Science. 2008;322:1097–1100. doi: 10.1126/science.1164206. - DOI - PMC - PubMed
    1. Savina A, et al. The small GTPase Rac2 controls phagosomal alkalinization and antigen crosspresentation selectively in CD8(+) dendritic cells. Immunity. 2009;30:544–555. doi: 10.1016/j.immuni.2009.01.013. - DOI - PubMed
    1. Delamarre L, Pack M, Chang H, Mellman I, Trombetta ES. Differential lysosomal proteolysis in antigen-presenting cells determines antigen fate. Science. 2005;307:1630–1634. doi: 10.1126/science.1108003. - DOI - PubMed

Publication types

MeSH terms

LinkOut - more resources