. 2018 Apr;32(4):1003-1015.
doi: 10.1038/leu.2017.336. Epub 2017 Nov 21.

MiR-29b antagonizes the pro-inflammatory tumor-promoting activity of multiple myeloma-educated dendritic cells

Affiliations

MiR-29b antagonizes the pro-inflammatory tumor-promoting activity of multiple myeloma-educated dendritic cells

C Botta et al. Leukemia. 2018 Apr.

Abstract

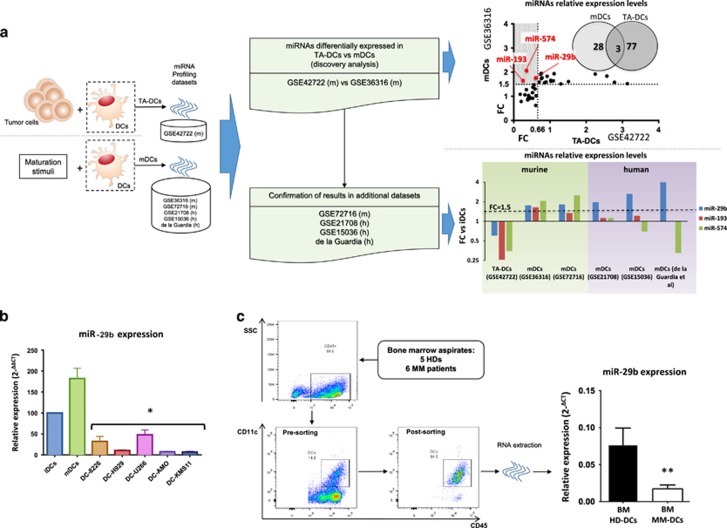
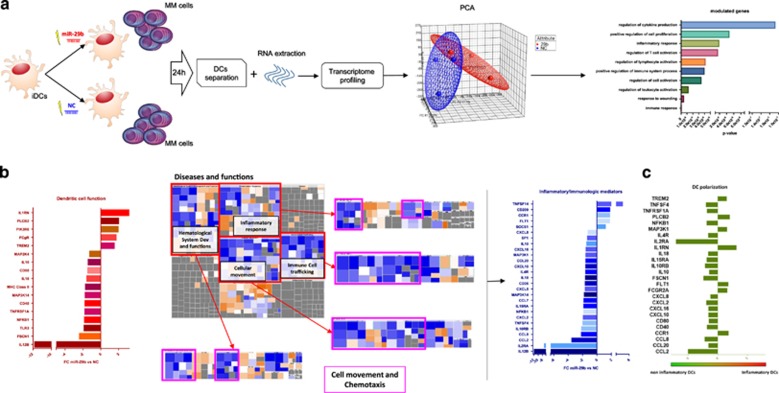
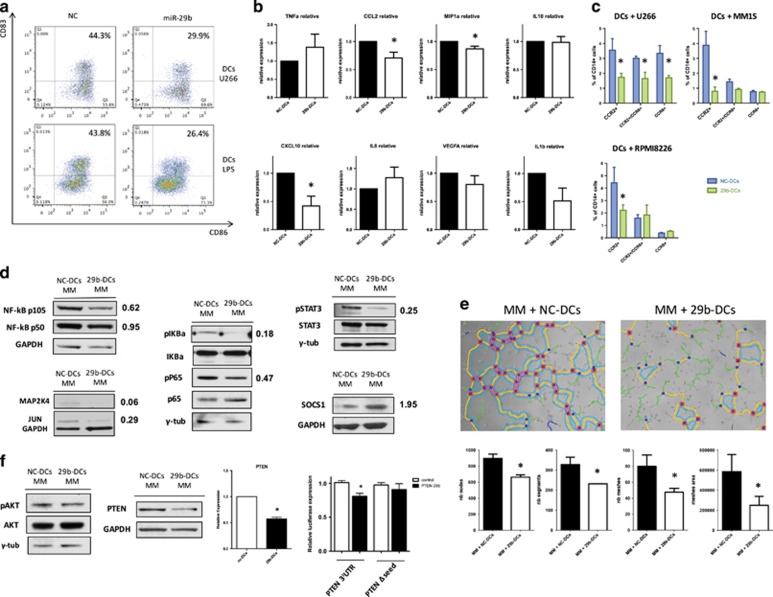
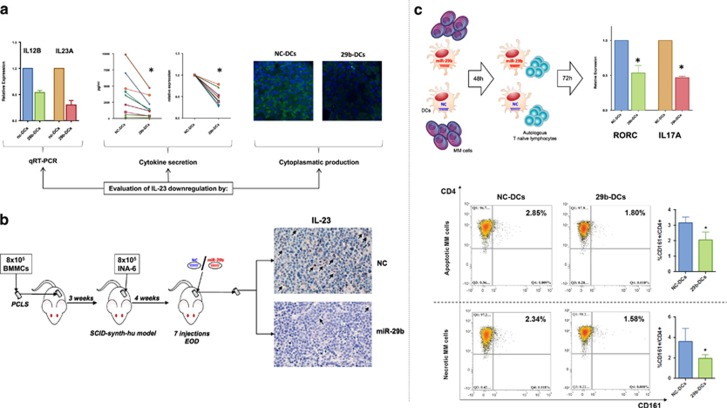
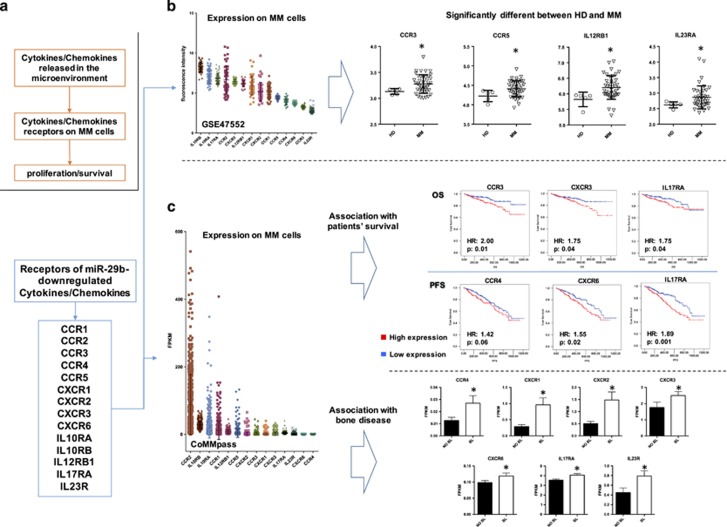
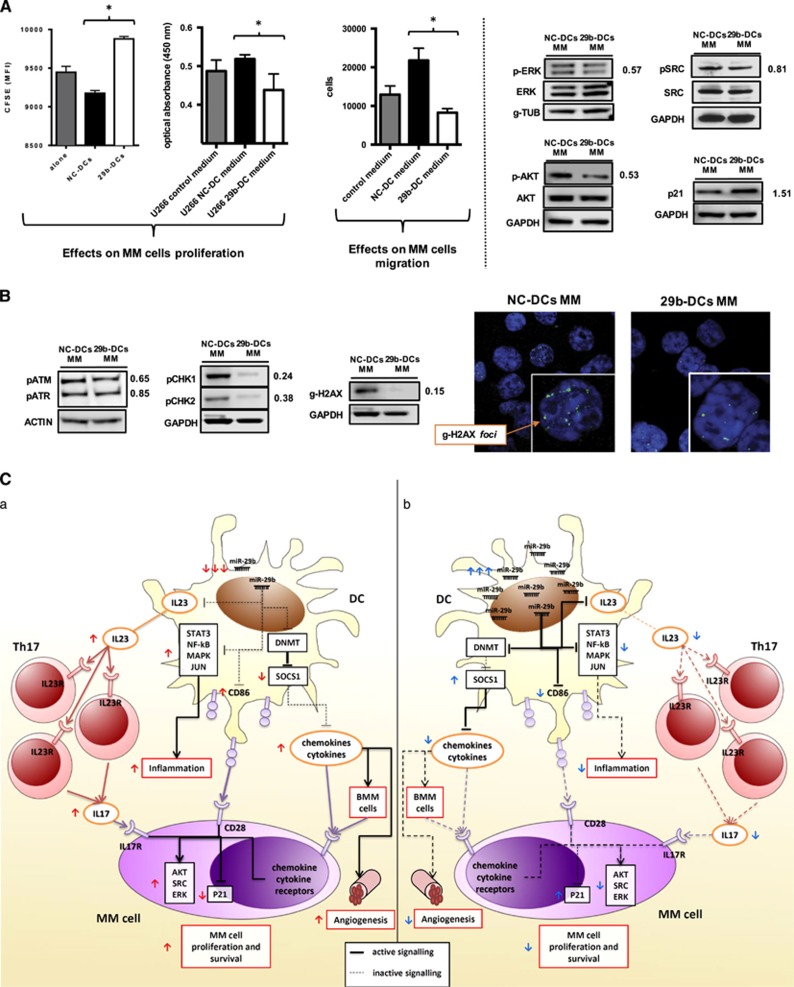
Dendritic cells (DCs) have a key role in regulating tumor immunity, tumor cell growth and drug resistance. We hypothesized that multiple myeloma (MM) cells might recruit and reprogram DCs to a tumor-permissive phenotype by changes within their microRNA (miRNA) network. By analyzing six different miRNA-profiling data sets, miR-29b was identified as the only miRNA upregulated in normal mature DCs and significantly downregulated in tumor-associated DCs. This finding was validated in primary DCs co-cultured in vitro with MM cell lines and in primary bone marrow DCs from MM patients. In DCs co-cultured with MM cells, enforced expression of miR-29b counteracted pro-inflammatory pathways, including signal transducer and activator of transcription 3 and nuclear factor-κB, and cytokine/chemokine signaling networks, which correlated with patients' adverse prognosis and development of bone disease. Moreover, miR-29b downregulated interleukin-23 in vitro and in the SCID-synth-hu in vivo model, and antagonized a Th17 inflammatory response. All together, these effects translated into strong anti-proliferative activity and reduction of genomic instability of MM cells. Our study demonstrates that MM reprograms the DCs functional phenotype by downregulating miR-29b whose reconstitution impairs DCs ability to sustain MM cell growth and survival. These results underscore miR-29b as an innovative and attractive candidate for miRNA-based immune therapy of MM.


Conflict of interest statement

The authors declare no conflict of interest.

Figures

Figure 1
Figure 1
(a) Workflow to identify miRNAs differentially expressed in TA-DCs as compared with mDCs. We adopted a two-step approach: in the discovery analysis we compared miRNAs differentially expressed in murine mDCs (data set GSE36316) with murine TA-DCs (data set GSE42722). The shadowed portion of the picture (at the end of the first step) evidences that only three miRNAs are upregulated at least 1.5 times in mDCs and downregulated at least 1.5 times (ratio=0.66) in TA-DCs, among the differentially expressed miRNAs. In the second step we confirmed these results in further four data sets. The results regarding the modulation (with their respective fold changes) of the three miRNAs selected in the ‘discovery’ step in all murine and human data sets evaluated are reported. A line representing the 1.5FC cutoff clearly demonstrated miR-29b as the only miRNA upregulated across all mDCs data sets. (b) Relative expression of miR-29b in iDCs, mDCs and DCs co-cultured with five different MM cell lines. All experiments have been repeated at least three times. *P<0.05. (c) A representative dot-plot highlighting the gating strategy used to sort DCs from BM aspirates of HDs (BM HD-DCs) or MM patients (MM HD-DCs) and the relative expression of miR-29b in these cells. **P<0.01.
Figure 2
Figure 2
(a) Workflow, the results of the principal component analysis (PCA) performed on gene expression data obtained from DCs (from three different donors) transfected with NC or miR-29b and co-cultured with MM cells for 24 h, and the top 10 pathways perturbed by miR-29b enforced expression according to DAVID gene functional annotation tool. (b) (i) the magnitude of the modulation of genes belonging to the ‘Dendritic cell function’ canonical pathway affected by miR-29b enforced expression in DCs; (ii) the cellular functions most significantly affected by miR-29b overexpression (purple squares surround cell movement and chemotaxis pathways whose genes are mostly downregulated (blue shift) by miR-29b enforced expression); and (iii) ‘inflammatory/immunologic’ mediators network obtained by merging genes included in those functions and enriched by regulator genes, found to be modulated by miR-29b, with their respective fold changes. All these analyses have been performed through ingenuity pathways analysis software (IPA). (c) Anti-inflammatory switch of DCs according to the significant inflammatory/immune genes differentially expressed after miR-29b transfection as compared with inflammatory DCs from GSE40484 data set.
Figure 3
Figure 3
(a) Representative flow cytometry analysis of CD86 and CD83 expression on DCs after miR-29b transient transfection and 48 h co-culture with U266 cell lines or with maturation stimuli (lipopolysaccharide). In both cases the percentage of mature DCs is decreased by the enforced expression of miR-29b. (b) Evaluation of cytokines production and secretion in the supernatant of DCs after miR-29b or NC transfection and 48 h co-culture with MM cells. Plots represent mean and s.d. of six different experiments. *P<0.05. (c) Migration assay to evaluate changes in the capability to attract CCR2+ and/or CCR6+ inflammatory cell populations from PBMCs, between supernatant of 29b-DCs and NC-DCs co-cultured for 48 h with three different MM cell lines (U266, RPMI8226 and MM1S). Plots represent mean and s.d. of three different experiments. *P<0.05. (d) Western blot evaluation of the main signaling pathways involved in inflammatory response (NFκB, STAT3, mitogen-activated protein kinase, JUN and suppressor of cytokine signaling 1 (SOCS1)) in DCs after miR-29b transfection and 48 h co-culture with MM cells. (e) Results from tubulogenic assay performed in the presence of supernatant from 29b-DCs or NC-DCs co-cultured with RPMI8226 MM cells. Images have been analyzed with ImageJ software and Angiogenesis analyzer plugin. The histograms under the pictures represents the estimation of tubulogenic potential obtained by analyzing the number of nodes (pixels with at least three neighboring elements corresponding to a bifurcation), segments (elements delimited by two junctions), meshes (areas enclosed by segments or master segments, made by tube-like-structures) number and total area. Legend: red points surrounded by blue, nodes surrounded by junctions symbol; red surrounded by yellow, extremities; green, branches (elements constituted by a junction and one extremity); magenta, segments; orange, master segments (segments where none of the two junctions is implicated with one branch); blue sky, meshes; junctions surrounded by red, master junctions (junctions linking at least three master segments); blue and cyan, isolated elements. *P<0.05. (f) Evaluation of the AKT signaling (pAKT, AKT and phosphatase and tensin homolog (PTEN)) through western blotting, accompanied by the demonstration of PTEN downregulation at the mRNA level and validation of PTEN as a miR-29b target through luciferase reporter assay. *P<0.05.
Figure 4
Figure 4
(a) Evaluation of the modulation of IL23 in DCs after miR-29b transfection and 48 h co-culture with MM cells, by qRT–PCR, cytokine production and secretion in the supernatant, and intracellular production through confocal microscopy. *P<0.05. (b) Overview of the in vivo synth-SCID-hu MM model and immunohistochemistry for the detection of DC-like cells (arrows) stained with anti human IL-23. (c) In the top part of the picture: workflow and qRT–PCR of RORC and IL17A (the major markers of Th17 polarization) performed on RNA extracted from autologous lymphocytes (naïve Th) after 72 h co-culture with 29b-DCs or NC-DCs previously co-cultured for 48 h with MM cells. *P<0.05. In the bottom part of the picture: representative dot-plots of Th17 (CD4+/CD161+) modulation after miR-29b enforced expression in DCs in the presence or absence of either apoptotic or necrotic U266 MM cell lines. The histograms represent the average of three independent experiments. *P<0.05.
Figure 5
Figure 5
(a) Description of the rationale for investigation of expression of the receptors of all cytokines modulated miR-29b in MM cells. (b) Evaluation of the expression of the receptors of the main miR-29b modulated chemokines and cytokines on MM cells according to data set GSE47552 (general scatter plots and plots of receptors that significantly differ between HDs (HD) and MM patients). *P<0.05. (c) Scatter plots and Kaplan–Meier curves with log-rank test results of the chemokine/cytokine receptors able to significantly discriminate PFS, overall survival (OS) and patients presenting bone disease (BL) as compared with patients that do not present lytic lesions (No BL) in the coMMpass trial. For survival analysis, patients were grouped into high and low expression groups according to the median value of receptor expression (FPKM). *P<0.05.
Figure 6
Figure 6
(A) The left and center histograms report the results of the proliferation assays performed on MM cells (U266) stained with Carboxyfluorescein succinimidyl ester and co-cultured with NC-DCs or 29b-DCs, or cultured in the presence of conditioned medium obtained from MM/NC-DCs and MM/29b-DCs co-cultures, respectively. The right histogram represents the number of MM cells attracted by the conditioned medium obtained from MM/NC-DCs and MM/29b-DCs co-cultures (migration assay). The blots on the right side of the panel represent the main survival and proliferation signaling (ERK, AKT, SRC and p21) in MM cells evaluated after 48 h co-culture with NC-DCs or 29b-DCs by western blotting. *P<0.05. (B) Left, evaluation of DNA damage response activation in MM cells (U266) co-cultured with either NC-DCs or 29b-DCs in western blotting; right, evaluation of g-H2AX nuclear foci (DNA double-strand break markers) in confocal microscopy in MM cells (U266) co-cultured with either NC-DCs or 29b-DCs. (C) This cartoon shows the main molecular and functional changes induced by miR-29b enforced expression in DCs in the context of MM microenvironment. (a) The ‘normal’ pathologic status, in which MM cells induce a downregulation of miR-29b in DCs thus promoting an inflammatory microenvironment that leads to a survival advantage. (b) The changes that we demonstrated occuring after miR-29b transfection in DCs.

Similar articles

Cited by

References

    1. Botta C, Ciliberto D, Rossi M, Staropoli N, Cucè M, Galeano T et al. Network meta-analysis of randomized trials in multiple myeloma: efficacy and safety in relapsed/refractory patients. Blood Adv 2017; 1: 455–466. - PMC - PubMed
    1. Rossi M, Botta C, Correale P, Tassone P, Tagliaferri P. Immunologic microenvironment and personalized treatment in multiple myeloma. Expert Opin Biol Ther 2013; 13 (Suppl 1): S83–93. - PubMed
    1. Prabhala RH, Fulciniti M, Pelluru D, Rashid N, Nigroiu A, Nanjappa P et al. Targeting IL-17A in multiple myeloma: a potential novel therapeutic approach in myeloma. Leukemia 2016; 30: 379–389. - PMC - PubMed
    1. Murray ME, Gavile CM, Nair JR, Koorella C, Carlson LM, Buac D et al. CD28-mediated pro-survival signaling induces chemotherapeutic resistance in multiple myeloma. Blood 2014; 123: 3770–3779. - PMC - PubMed
    1. Gorgun GT, Whitehill G, Anderson JL, Hideshima T, Maguire C, Laubach J et al. Tumor-promoting immune-suppressive myeloid-derived suppressor cells in the multiple myeloma microenvironment in humans. Blood 2013; 121: 2975–2987. - PMC - PubMed

Publication types