. 2018 Feb;3(2):220-233.
doi: 10.1038/s41564-017-0063-9. Epub 2017 Nov 20.

Deep sequencing of HIV-1 reverse transcripts reveals the multifaceted antiviral functions of APOBEC3G

Affiliations

Deep sequencing of HIV-1 reverse transcripts reveals the multifaceted antiviral functions of APOBEC3G

Darja Pollpeter et al. Nat Microbiol. 2018 Feb.

Abstract

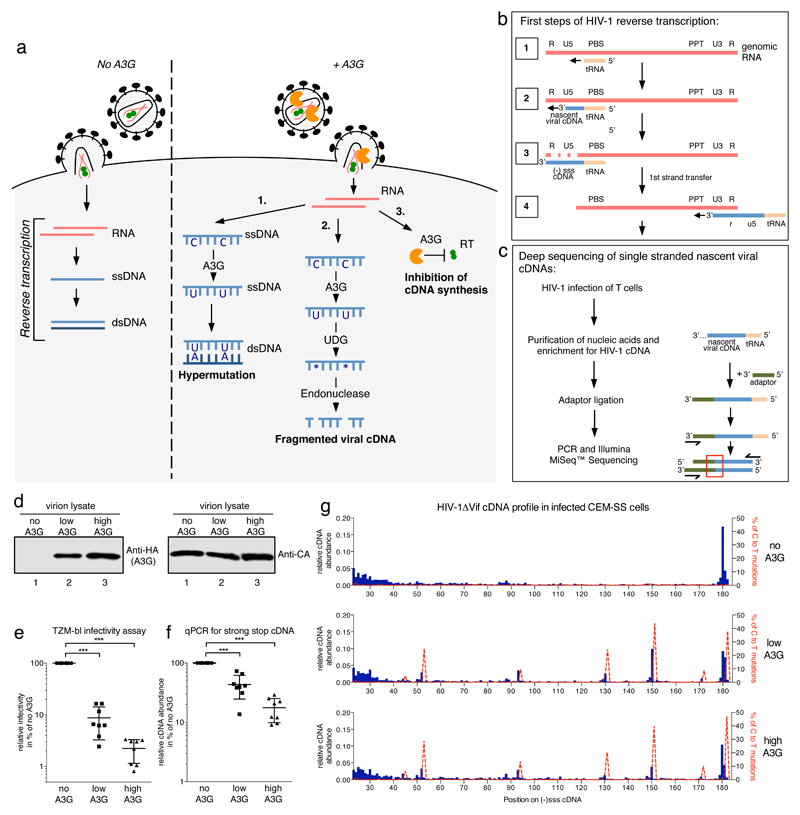
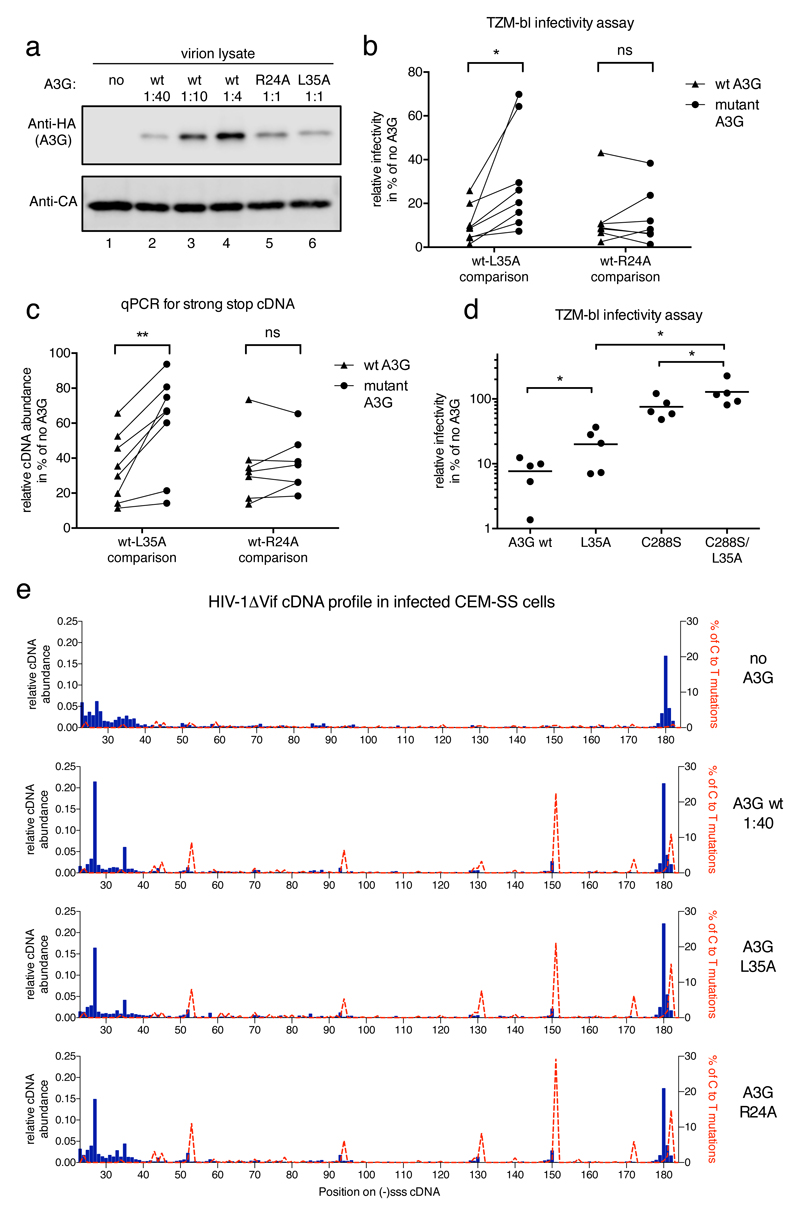
Following cell entry, the RNA genome of HIV-1 is reverse transcribed into double-stranded DNA that ultimately integrates into the host-cell genome to establish the provirus. These early phases of infection are notably vulnerable to suppression by a collection of cellular antiviral effectors, called restriction or resistance factors. The host antiviral protein APOBEC3G (A3G) antagonizes the early steps of HIV-1 infection through the combined effects of inhibiting viral cDNA production and cytidine-to-uridine-driven hypermutation of this cDNA. In seeking to address the underlying molecular mechanism for inhibited cDNA synthesis, we developed a deep sequencing strategy to characterize nascent reverse transcription products and their precise 3'-termini in HIV-1 infected T cells. Our results demonstrate site- and sequence-independent interference with reverse transcription, which requires the specific interaction of A3G with reverse transcriptase itself. This approach also established, contrary to current ideas, that cellular uracil base excision repair (UBER) enzymes target and cleave A3G-edited uridine-containing viral cDNA. Together, these findings yield further insights into the regulatory interplay between reverse transcriptase, A3G and cellular DNA repair machinery, and identify the suppression of HIV-1 reverse transcriptase by a directly interacting host protein as a new cell-mediated antiviral mechanism.


Conflict of interest statement

Competing financial interest:

The authors have no conflict of financial interest.

Figures

Figure 1
Figure 1. Effects of A3G on profiles of nascent HIV-1 cDNA products in infected T cells.
a) Early steps of the HIV-1 life cycle illustrating three proposed anti-retroviral mechanisms for A3G that are deaminase-dependent (pathways 1 and 2) or -independent (pathway 3). b) Diagram of HIV-1 reverse transcription. The first full intermediate, (-)sss cDNA, is completed in step 3. PBS: primer binding site, PPT: polypurine tract. c) Basic steps of sequencing library preparation. During infection, HIV-1 produces nascent viral cDNAs of increasing length (see step 2 in b). Sequencing reads reveal precise 3’-termini at the points of adaptor-viral DNA ligation (red box). d) Immunoblot analysis of HIV-1 virion lysates from one of six independent virus preparations. ‘Low’ or ‘High’ A3G refers to producer cell transfection ratios of 1:10 or 1:4, respectively (A3G expression plasmid to NL4.3/ΔVif). e) Single-cycle virion infectivity measured by β-galactosidase activity in challenged TZM-bl reporter cells. f) Quantitative PCR measuring cDNA abundance in CEM-SS cells at 4 h post-infection. For e) and f) the individual data points with their mean and standard deviation of eight independent infections from six virus preparations are shown. *** indicates p-value of <0.0001 in an unpaired, two-tailed t-test with Welch’s correction performed in GraphPad Prism®. g) Numbers of unique sequencing reads ending at each nt of the HIV-1NL4.3 (-)sss cDNA were divided by the total read number (Supplementary Figure 4b) within each sample to show the relative abundance of cDNAs for each length between nt positions 23 and 182. Shown in dashed red lines are the percentages of reads carrying C to T/U mutations at that position (scale on the right y-axis). See Method section for analysis details. One representative experiment out of three independent repeats is shown.
Figure 2
Figure 2. Consequences of UDG inhibition on A3G antiviral phenotype and cDNA profiles
a) Immunoblot analysis of HIV-1 virion lysates showing increasing amounts of packaged A3G_HA at constant CA levels for virions produced in the presence or absence of a codon optimized (humanized) uracil-DNA glycosylase inhibitor (hUGI). ‘Low’ or ‘High’ A3G refers to a producer cell transfection ratios of 1:10 or 1:1, respectively (A3G expression plasmid to NL4.3/ΔVif). One of three independent sets of virus preparations used for b) and c) is shown. b) Virion infectivity was evaluated by challenging TZM-bl cells and measurement of β-galactosidase activity. c) The abundance of (-)sss containing cDNA in CEM-SS cells at 4 h post-infection was measured by quantitative PCR. For b) and c) each viral preparation was used to infect TZM-bl or CEM-SS target cells with or without hUGI, black dots and grey squares respectively. The individual data points with their mean and standard deviation for three independent viral preparations and infections are shown. d) Sequencing reads from a MiSeq™ library run were analyzed and presented as in Figure 1g. The labeling to the right indicates whether the HEK293T producer cells (Prod) and/or the CEM-SS target (Target) cells expressed hUGI. No A3G indicates the absence of A3G in producer cells and high A3G refers to relative A3G content in the producer cells. Sequencing data are derived from one representative experiment out of two independent repeats.
Figure 3
Figure 3. Interaction of A3G with HIV-1 reverse transcriptase.
Co-immunoprecipiation analysis of A3G_HA binding to FLAG tagged HIV-1 RT. Transfected HEK293T cell lysates were subjected to anti-FLAG immunoprecipiation, recovered proteins were detected with anti-HA (for A3G), anti-RT or anti-FLAG antibodies. CD8_FLAG served as an irrelevant protein control. One representative experiment of three repeats is shown. *HC: immunoglobulin heavy chain b) RNase resistance of the A3G-RT complex. Shown are anti-FLAG immunoprecipitations after the bead bound proteins had been subjected to RNase A or RNase Mix treatment, at the indicated concentrations, followed by washing and immunoblotting. One representative experiment of three repeats is shown. Samples without RT_FLAG carry CD8_FLAG as an irrelevant tagged protein control. c) Surface plasmon resonance analysis of purified A3G and p51 on a Biacore T-200 instrument. Association and dissociation curves of p51_FLAG to immobilized A3G_6xHis at the indicated concentrations are shown. The sensorgram indicates specific binding between the two components, and the responses gave good fits to a single interaction binding model with a Kd of ~1.6 μM. d)-f) Measurements of FRET efficiency using FLIM in HeLa cells expressing GFP and mCherry fusion proteins. Representative images with GFP fluorescence from multiphoton laser scanning microscopy (left panel) and corresponding wide field CCD camera images of mCherry fluorescence (right panels (e only)) are shown. The center panels represent pseudo-colored images of GFP lifetime (τ) (blue/green, normal/longer GFP lifetime; yellow/red, shorter GFP lifetime indicating FRET). d)Control images demonstrating normal GFP lifetime in the absence of mCherry acceptor. White scale bars represent 10 μm. e) Co-expression of indicated GFP and mCherry fusion proteins and the fluorescence lifetime according to the scale in d) indicating the presence or absence of FRET. f) Dot plot of FRET efficiencies with their mean and standard deviation from n=7 cells each.
Figure 4
Figure 4. A3G interaction with HIV-1 RT in virions
Suspensions of HIV-1 virions with packaged A3G_GFP, GFP_Vpr, GFP_CYPA or A3G_GFP and A3G_mCherry were immobilized on coverslips, fixed and stained with Cy3 labeled anti-RT or anti-CA Fab fragments. a) and b) Representative images show clusters of HIV-1 virions immobilized on fibronectin streaks with green fluorescence (left panel), red fluorescence (Cy3 or mCherry as indicated, right panel) and GFP lifetime as pseudo-colored images according to the indicated scale (as in Figure 3). White scale bars represent 10 μm. a) A3G_GFP demonstrates normal lifetime when packaged into HIV-1 virions. b) FRET is detected for the positive control of A3G_GFP and A3G_mCherry (upper left panel) and between A3G_GFP and Cy3 stained RT (lower right panel), but not between Vpr and RT, CYPA and RT, or A3G and CA (upper right panels). The absence of a signal for red fluorescence with HIV-1ΔRT virions confirmed the specificity of the anti-RT Fab fragments (lower left panel). c) Quantification of FRET efficiencies for n=5 areas. Individual measurements with their mean and standard deviation are shown.
Figure 5
Figure 5. Mapping of A3G-RT interaction sites on A3G protein
a) Anti FLAG immunoprecipitation of p51_FLAG and p66_FLAG co-expressed with GST or GST_A3G fusion proteins, recovered proteins were detected with anti-GST (for A3G) or anti-FLAG antibodies as indicated. A3G truncations are indicated and numbers refer to amino acid positions in A3G. b) Co-immunoprecipitation analysis of wild type or mutant A3G with HIV-1 p51_FLAG and p66_FLAG, recovered proteins were detected with anti-HA (for A3G) or anti-FLAG antibodies. One representative out of three experiments is shown. c) FRET-FLIM analysis of wild type or mutant A3G with the p66 subunit of HIV-1 RT. Representative images show green fluorescence (GFP, left panel) and red fluorescence (mCherry, right panel) and GFP lifetime as pseudo-colored images according to the indicated scale (as in Fig 5). White scale bars represent 10 μm. d) Dot plots showing individual FRET efficiencies with their mean and one standard deviation from n=12 cells each. *** indicates p-value of <0.0001 in an unpaired, two-tailed t-test performed in GraphPad Prism®.
Figure 6
Figure 6. Phenotypes of packaged L35A and R24A A3G mutant proteins on viral infectivity and cDNA profiles
a) Immunoblot analysis of HIV-1 virions showing relative amounts of packaged wild type or mutant A3G_HA at constant CA levels. Ratios refer to the amounts of transfected A3G expression plasmid to proviral plasmid during virus production. b) A3G-L35A, but not A3G-R24A, displays diminished HIV-1 inhibitory activity. A3G packaging was quantified by immunoblot density measurements and the different wild type A3G packaging levels were plotted over measured infectivity. The extent of infection inhibition exerted by the wild type protein at the empirically determined level of packaged mutant protein was then extrapolated (see Supplementary Fig 10). Inhibition levels, in % relative to the no A3G control, of wild type A3G (triangles) and L35A or R24A (circles) in eight (L35A) or seven (R24A) independent experiments are shown. A paired, two tailed student t test was performed in GraphPad Prism® and * indicates p<0.05 (p=0.0223), ns: not significant c) As in b), but with (-)sss cDNA abundance measured by qPCR in cells 4 h post-infection for virions carrying wild type or mutant A3G. ** indicates p<0.005 (p=0.0028). d) Relative infectivity of n=5 independent virus preparations carrying the indicated wild type or mutant A3G at equal, ‘high’ levels as shown in the representative immunoblot in Supplementary Fig 10g. A paired, two tailed student t test was performed in GraphPad Prism®. * indicates p<0.05 (p=0.0397 for A3G wt – L35A; p=0.0297 for C288S – C288S/L35A and p=0.0137 for L35A – C288S/L35A). e) Sequencing reads from a MiSeq™ library run were analyzed and presented as in Fig 1g. Labels to the right indicate the presence or absence of A3G proteins in virions.

Comment in

  • A multimodal antiretroviral protein.
    Bieniasz PD. Bieniasz PD. Nat Microbiol. 2018 Feb;3(2):122-123. doi: 10.1038/s41564-017-0104-4. Nat Microbiol. 2018. PMID: 29358682 No abstract available.

References

    1. Doyle T, Goujon C, Malim MH. HIV-1 and interferons: who's interfering with whom? Nat Rev Microbiol. 2015;13:403–13. - PMC - PubMed
    1. Simon V, Bloch N, Landau NR. Intrinsic host restrictions to HIV-1 and mechanisms of viral escape. Nat Immunol. 2015;16:546–53. - PMC - PubMed
    1. Desimmie BA, et al. Multiple APOBEC3 restriction factors for HIV-1 and one Vif to rule them all. J Mol Biol. 2014;426:1220–45. - PMC - PubMed
    1. Harris RS, Dudley JP. APOBECs and virus restriction. Virology. 2015;479–480:131–45. - PMC - PubMed
    1. Bishop KN, et al. Cytidine deamination of retroviral DNA by diverse APOBEC proteins. Curr Biol. 2004;14:1392–6. - PubMed

Publication types

LinkOut - more resources