. 2017 Oct;23(4):851-863.
doi: 10.1007/s12298-017-0469-0. Epub 2017 Sep 18.

Aluminum exclusion from root zone and maintenance of nutrient uptake are principal mechanisms of Al tolerance in Pisum sativum L

Affiliations

Aluminum exclusion from root zone and maintenance of nutrient uptake are principal mechanisms of Al tolerance in Pisum sativum L

Natalia E Kichigina et al. Physiol Mol Biol Plants. 2017 Oct.

Abstract

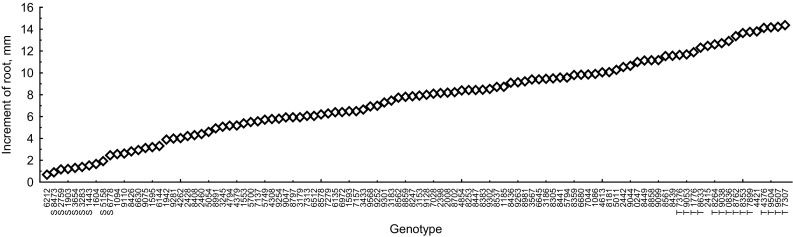
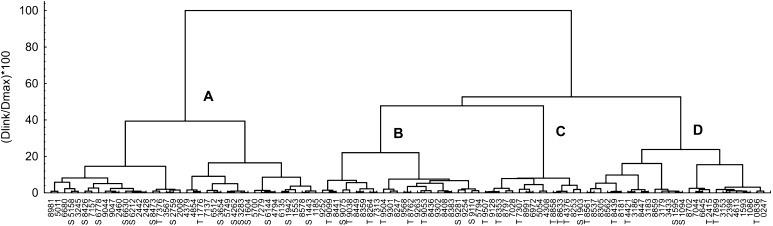
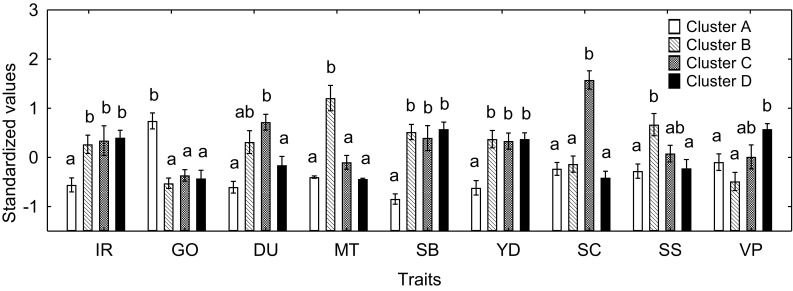
Our study aimed to evaluate intraspecific variability of pea (Pisum sativum L.) in Al tolerance and to reveal mechanisms underlying genotypic differences in this trait. At the first stage, 106 pea genotypes were screened for Al tolerance using root re-elongation assay based on staining with eriochrome cyanine R. The root re-elongation zone varied from 0.5 mm to 14 mm and relationships between Al tolerance and provenance or phenotypic traits of genotypes were found. Tolerance index (TI), calculated as a biomass ratio of Al-treated and non-treated contrasting genotypes grown in hydroponics for 10 days, varied from 30% to 92% for roots and from 38% to 90% for shoots. TI did not correlate with root or shoot Al content, but correlated positively with increasing pH and negatively with residual Al concentration in nutrient solution in the end of experiments. Root exudation of organic acid anions (mostly acetate, citrate, lactate, pyroglutamate, pyruvate and succinate) significantly increased in several Al-treated genotypes, but did not correlate with TI. Al-treatment decreased Ca, Co, Cu, K, Mg, Mn, Mo, Ni, S and Zn contents in roots and/or shoots, whereas contents of several elements (P, B, Fe and Mo in roots and B and Fe in shoots) increased, suggesting that Al toxicity induced substantial disturbances in uptake and translocation of nutrients. Nutritional disturbances were more pronounced in Al sensitive genotypes. In conclusion, pea has a high intraspecific variability in Al tolerance and this trait is associated with provenance and phenotypic properties of plants. Transformation of Al to unavailable (insoluble) forms in the root zone and the ability to maintain nutrient uptake are considered to be important mechanisms of Al tolerance in this plant species.

Keywords: Aluminium; Biodiversity; Nutrient uptake; Organic acids; Pea; Rhizosphere.


Figures

Fig. 1
Fig. 1
Root re-elongation (increment of root) of 106 pea genotypes. Seedlings were treated with 110 µM AlCl3 for 1 day, transferred to fresh nutrient solution without aluminum and incubated for 2 days. Standard errors are less then symbol size (n varied from 10 to 30 depending on genotype). The most Al-tolerant or the most Al-sensitive genotypes chosen for further experiments are marked by T or S, respectively
Fig. 2
Fig. 2
Dendrogram showing relationships among the studied pea varieties based on cluster analysis of the data for phenotypic and economic traits (see “Materials and methods” section for details). Ward’s method for linkage rules, 1-Pearson-r distance measure. Capital letters indicate numbers of clusters. The 20 most Al-tolerant or 20 most Al-sensitive genotypes (accordingly to the data shown in Fig. 1) are marked by T or S, respectively. The properties used for cluster analysis are presented in supplemental Table 1
Fig. 3
Fig. 3
Means for the clusters combining pea genotypes according to the dendrogram shown in Fig. 2. Traits: increment of root (IR), geographic origin (GO), direction of use (DU), morphotype (MT), individual seed biomass (SB), seed yield (YD), seed color (SC), seed surface (SF), vegetation period (VP). Note that IR was not included into the cluster analysis. Vertical bars indicate standard errors (n = 40, 24, 15 and 27 for clusters 1, 2, 3 and 4, respectively). Different lowercase letters indicate significant differences between clusters for each trait (LSD test, P ≤ 0.05)
Fig. 4
Fig. 4
Effect of aluminium on biomass of root (a) and shoot (b) and tolerance index (c) of the selected pea genotypes. Vertical bars indicate standard errors (n = 15). Asterisks indicate significant differences between untreated (control) and Al-treated (80 µM Al) plants for each genotype (LSD test, P ≤ 0.05). Genotypes are shown in order of increasing root tolerance index from left to right
Fig. 5
Fig. 5
Aluminium content in root (a) and shoot (b) of the selected pea genotypes and final solution Al concentration (c) and pH (d) in the end of experiments with Al-treated plants. Vertical bars indicate standard errors (for Al in plants n = 5; for solution Al and pH n = 3). Different lowercase letters indicate significant differences between means (LSD test, P ≤ 0.05). Genotypes are shown in order of increasing root tolerance index from left to right and the arrow differentiates Al sensitive from Al resistant genotypes
Fig. 6
Fig. 6
Exudation of organic acid anions by roots of the selected pea genotypes. The plants were incubated in nutrient solution for 5 days. White and black columns indicate untreated control and Al-treated plants, respectively. Vertical bars indicate standard errors (n = 3). Asterisks show not detected. Different lowercase letters indicate significant differences between means (LSD test, P ≤ 0.05). Genotypes are shown in order of increasing root tolerance index from left to right and the arrow differentiates Al sensitive from Al resistant genotypes
Fig. 7
Fig. 7
Correlations between Al tolerance index of roots and effects of Al on nutrient element contents. Pea genotypes: 1—3654; 2—8473; 3—2759; 4—1903; 5—8762; 6—9507; 7—8633; 8—6778; 9—7307; 10—0836; 11—8353. Genotypes are listed in order of increasing root tolerance index. Dashed line shows linear regression. Element symbol, correlation coefficient (r) and probability (P) are shown in each part of the figure (n = 11)

References

    1. Akhter A, Wagatsuma T, Khan MSH, Tawaraya K. Comparative studies on aluminum tolerance screening techniques for sorghum, soybean and maize in simple solution culture. Am J Plant Physiol. 2009;4:1–8. doi: 10.3923/ajpp.2009.1.8. - DOI
    1. Anas A, Yoshida T. Heritability and genetic correlation of Al-tolerance with several agronomic characters in sorghum assessed by hematoxylin staining. Plant Prod Sci. 2004;7:280–282. doi: 10.1626/pps.7.280. - DOI
    1. Aniol A, Gustafson P. Chromosome location of genes controlling aluminum tolerance in wheat, rye and triticale. Can J Genet Cytol. 1984;26:701–705. doi: 10.1139/g84-111. - DOI
    1. Baligar VC, Wright RJ, Kinraide TB, Foy CD, Elgin JH. Aluminum effects on growth, mineral uptake, and efficiency ratios in red clover cultivars. Agron J. 1987;79:1038–1044. doi: 10.2134/agronj1987.00021962007900060018x. - DOI
    1. Belimov AA, Safronova VI, Tsyganov VE, Borisov AY, Kozhemyakov AP, Stepanok VV, Martenson AM, Gianinazzi-Pearson V, Tikhonovich IA. Genetic variability in tolerance to cadmium and accumulation of heavy metals in pea (Pisum sativum L.) Euphytica. 2003;131:25–35. doi: 10.1023/A:1023048408148. - DOI

LinkOut - more resources