

Gray matter atrophy patterns in multiple sclerosis: A 10-year source-based morphometry study
- PMID: 29159057
- PMCID: PMC5684496
- DOI: 10.1016/j.nicl.2017.11.002
Gray matter atrophy patterns in multiple sclerosis: A 10-year source-based morphometry study
Abstract
Objectives: To investigate spatial patterns of gray matter (GM) atrophy and their association with disability progression in patients with early relapsing-remitting multiple sclerosis (MS) in a longitudinal setting.
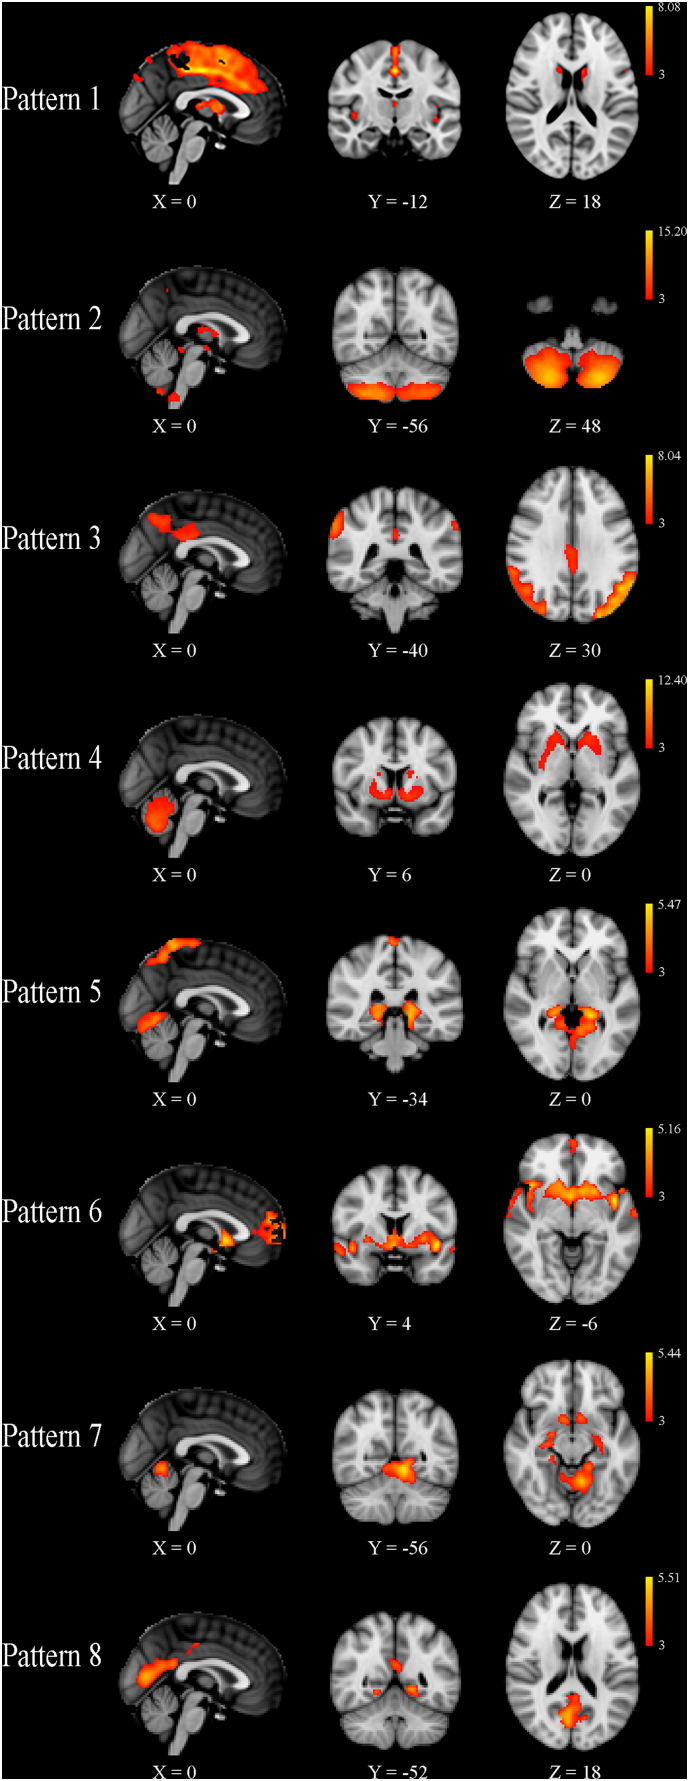
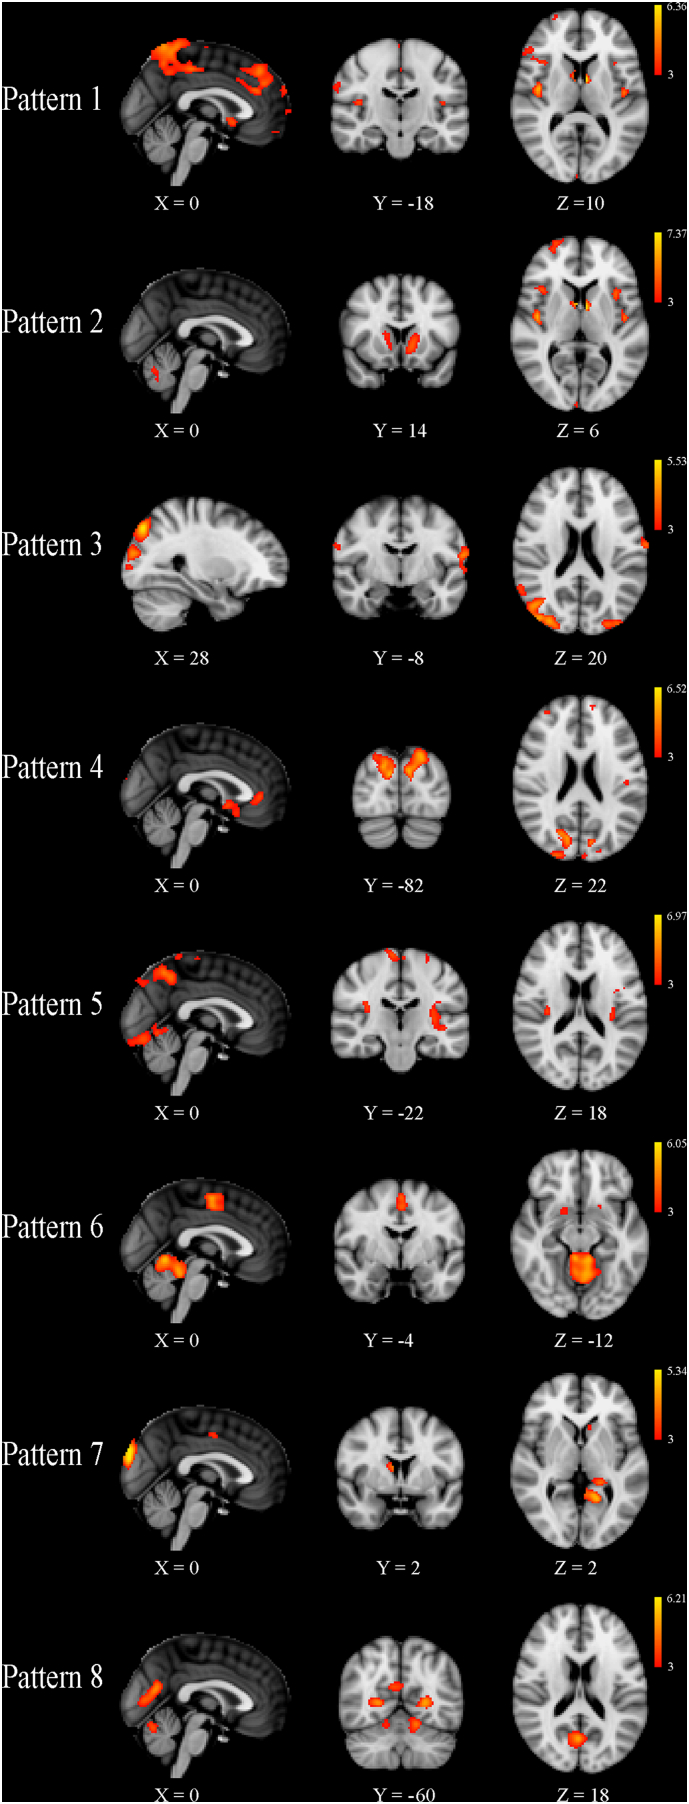
Methods: Brain MRI and clinical neurological assessments were obtained in 152 MS patients at baseline and after 10 years of follow-up. Patients were classified into those with confirmed disability progression (CDP) (n = 85) and those without CDP (n = 67) at the end of the study. An optimized, longitudinal source-based morphometry (SBM) pipeline, which utilizes independent component analysis, was used to identify eight spatial patterns of common GM volume co-variation in a data-driven manner. GM volume at baseline and rates of change were compared between patients with CDP and those without CDP.
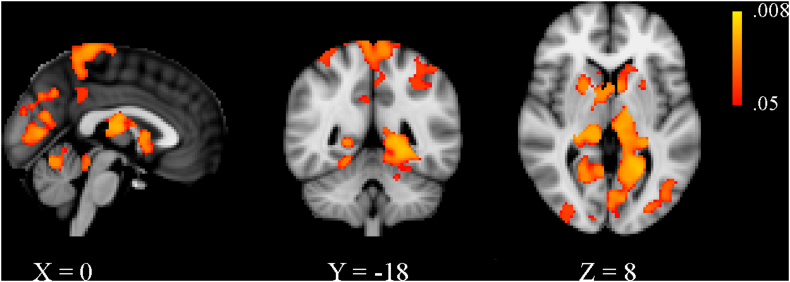
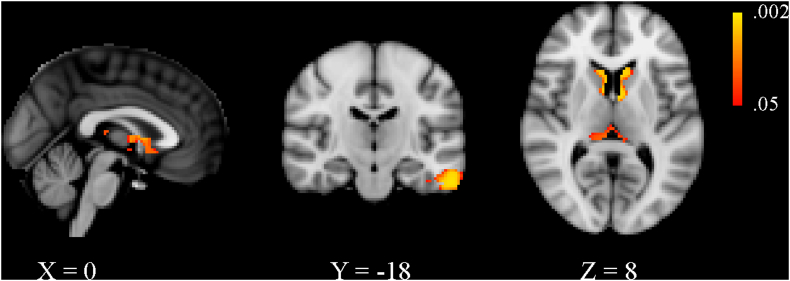
Results: The identified patterns generally included structurally or functionally related GM regions. No significant differences were detected at baseline GM volume between the sub-groups. Over the follow-up, patients with CDP experienced a significantly greater rate of GM atrophy within two of the eight patterns, after correction for multiple comparisons (corrected p-values of 0.001 and 0.007). The patterns of GM atrophy associated with the development of CDP included areas involved in motor functioning and cognitive domains such as learning and memory.
Conclusion: SBM analysis offers a novel way to study the temporal evolution of regional GM atrophy. Over 10 years of follow-up, disability progression in MS is related to GM atrophy in areas associated with motor and cognitive functioning.
Keywords: Atrophy; Disability; Gray matter; MRI; Multiple sclerosis.
Figures
Comment in
-
Multiple sclerosis: 10-year study shines a light on grey matter atrophy in MS.Nat Rev Neurol. 2018 Jan;14(1):2-3. doi: 10.1038/nrneurol.2017.167. Epub 2017 Nov 24. Nat Rev Neurol. 2018. PMID: 29170502 No abstract available.
References
-
- Beckmann C.F., Smith S.M. Probabilistic independent component analysis for functional magnetic resonance imaging. IEEE Trans. Med. Imaging. 2004;23:137–152. - PubMed
-
- Benjamini Y., Drai D., Elmer G., Kafkafi N., Golani I. Controlling the false discovery rate in behavior genetics research. Behav. Brain Res. 2001;125:279–284. - PubMed
-
- Bergsland N., Horakova D., Dwyer M.G., Dolezal O., Seidl Z.K., Vaneckova M., Krasensky J., Havrdova E., Zivadinov R. Subcortical and cortical gray matter atrophy in a large sample of patients with clinically isolated syndrome and early relapsing-remitting multiple sclerosis. AJNR Am. J. Neuroradiol. 2012;33:1573–1578. - PMC - PubMed
-
- Bergsland N., Zivadinov R., Dwyer M.G., Weinstock-Guttman B., Benedict R.H. Localized atrophy of the thalamus and slowed cognitive processing speed in MS patients. Mult. Scler. 2016;22:1327–1336. - PubMed
MeSH terms
LinkOut - more resources
Full Text Sources
Other Literature Sources
