. 2018 Mar;86 Suppl 1(Suppl 1):321-334.
doi: 10.1002/prot.25425. Epub 2017 Dec 4.

Evaluation of the template-based modeling in CASP12

Affiliations

Evaluation of the template-based modeling in CASP12

Andriy Kryshtafovych et al. Proteins. 2018 Mar.

Abstract

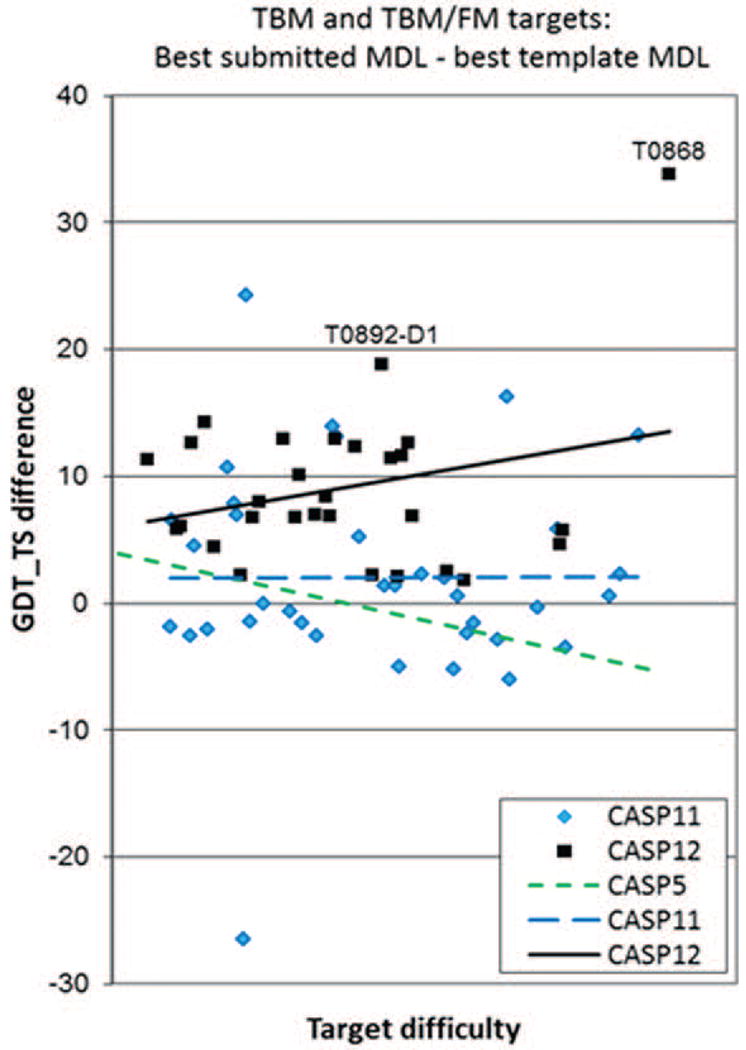
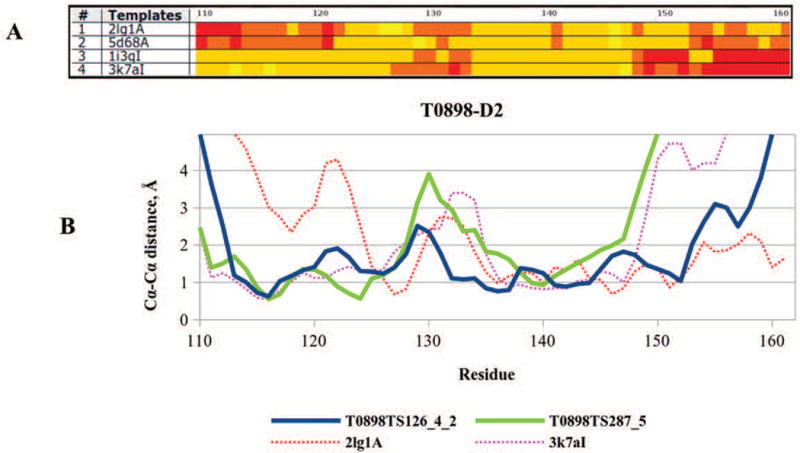
The article describes results of numerical evaluation of CASP12 models submitted on targets for which structural templates could be identified and for which servers produced models of relatively high accuracy. The emphasis is on analysis of details of models, and how well the models compete with experimental structures. Performance of contributing research groups is measured in terms of backbone accuracy, all-atom local geometry, and the ability to estimate local errors in models. Separate analyses for all participating groups and automatic servers were carried out. Compared with the last CASP, two years ago, there have been significant improvements in a number of areas, particularly the accuracy of protein backbone atoms, accuracy of sequence alignment between models and available structures, increased accuracy over that which can be obtained from simple copying of a closest template, and accuracy of modeling of sub-structures not present in the closest template. These advancements are likely associated with more effective strategies to build non-template regions of the targets ab initio, better algorithms to combine information from multiple templates, enhanced refinement methods, and better methods for estimating model accuracy.

Keywords: CASP; high accuracy models; numerical evaluation measures; protein structure prediction; template-based protein modeling.


Figures

Figure 1
Figure 1
GDT_TS scores of the best and median models submitted on the template-based modeling targets (including TBM and TBM/FM domains) in CASP5 and CASPs11-12. Points represent best models for each target in CASP11 and CASP12. Data are for the all-group targets in the CASPs 11 and 12 CASPs and for all targets in CASP5. Apparently, the high outlier for target T0868 is pulling the CASP12 trend line (solid black line) up at the hard difficulty end, but even without this outstanding target, the CASP12 trend line (dotted and dashed black line) stays above the CASP5 and CASP11 lines. Specifics of the labeled in the graph targets are discussed in a separate section below.
Figure 2
Figure 2
Difference in GDT_TS score between the best submitted model for each target and the corresponding naïve model built by simple copying of the backbone atoms for the aligned residues of the best single template. Values greater than zero indicate added value in the best model. In contrast to CASP11, value was added for every target in CASP12, and in general the increase is greater than in CASP11. Targets T0868 and T0892-D1 are examples, where the best models were significantly better than the models built on a single best template, due to combining of multiple templates.
Figure 3
Figure 3
(A) Percentage of correctly predicted non-template residues, and (B) difference between the percentages of correctly predicted non-template residues and incorrectly predicted template residues. The data are provided for targets with at least 15 residues missing in the best template. A residue is considered as correctly aligned/predicted in the template/model if its Cα error is less than 3.8Å in the optimal LGA superposition. Values greater than zero in panel (B) indicate net gain in the modeling (i.e., more correctly predicted residues from those missing in the template than incorrectly predicted residues from those available in the template). The best model for target T0868 (the highest positive outlier marked in panel B) includes substantial portion of the structure that was not available from the best templates and was modeled ab initio.
Figure 4
Figure 4
Percentage of correctly aligned residues (AL0) for the best models submitted on the template-based modeling targets (including TBM and TBM/FM domains) in CASP5 and CASPs11-12, and the maximum percentage of residues that could be aligned using the single best template (i.e., maximum alignability) on CASP12 targets as functions of target difficulty. A model residue is considered correctly aligned if the Cα atom falls within 3.8Å of the corresponding atom in an optimal model-target superposition, and there is no other experimental structure Cα atom nearer. A template residue is considered alignable if there is at least one experimental residue that is within 3.8Å (in terms of the Cα-Cα distance) in an optimal template-target superposition. The maximum alignability is the percentage of aligned residues in the longest alignment between the best template and the experimental structure built with the dynamic programming procedure in such a way that no alignable residue is taken twice and all residues in the alignment are in the order of the sequence. The data in the graph are provided for the all-group targets in the latest two CASPs and for all targets in CASP5. The maximum alignability line (dotted black line) shows that CASP12 predictions (solid black line) on harder template-based targets exceeded the alignability limit for single templates. The detailed analysis shows that such result is a consequence of presence of extraordinary well modeled target T0868 in the dataset. While this target has maximum alignability of only 63% (marked on the graph), 90% of its residues were correctly aligned in the best model due to ab initio modeling of non-template regions and successful refinement (as discussed below). Removing T0868 from the target set brings the alignment line for CASP12 models (dotted and dashed black line) about 5% below the maximum single-template alignability line in the whole range of target difficulty.
Figure 5
Figure 5
Target T0868 (panel A) with its models (panels B,C), templates (panels D-F), and alignment plots (panels G,H). (A) The native structure of target T0868 rainbow-colored from N-terminal (blue) to C-terminal (red). (B-F) Structural alignment of the target (cyan, Cα trace) and: (B) the best server model TS005_1 (Baker-Rosettaserver, green cartoon); (C) the best overall model TS330_2 (Laufer-seed, blue); (D) the most often used by the CASP12 predictors evolutionary related template (4g6u, red); (E) the highest scoring HHsearch sequence template (2ghz, magenta); (F) the highest scoring LGA structural template (2cw6, yellow). (G) Cα-Cα distances between the target residues and the aligned residues in the best evolutionary related template (red dotted line), best server model (green), and the overall best model (blue). Lower values indicate closer residues, and thus better modeling. The secondary structure diagram of the target is provided at the bottom of the panel, with the regions shown in panel A marked on the sequence. (H) Position-specific alignment of the best models to the target structure. The models are sorted according to the number of correctly aligned residues. Green color shows regions of perfect alignment in the optimal sequence-independent LGA superposition, yellow – residues misaligned by no more than 4 positions along the sequence, red – misaligned by 5 or more residues, and white - not aligned. Three regions of the target: 1) the second part of helix α1 together with the loop and strand β1, 2) the first part of the second helix before the kink, α2a, and 3) the small C-terminal helix α4 are missing in the templates (D-F), but included in the models (panels B, C). Two other structural fragments - the β2-loop-β3 and the α3 helix - have different orientation in the best templates, but are well placed in the models (green and blue lines run noticeably lower than the red dotted line in panel G). The best model from an expert group (C) shows overall improvement over the best server model (B) due to the successful refinement (blue line runs generally lower than the green line in panel G). In particular, the best expert model (T0868TS330_2, boxed in the top part of panel H) was able to fix the alignment error in the best server model (T0868TS005_1, boxed at the bottom) in the connector (residues 90-96) between the β3 strand (84-89) and the α2a helix (residues 97-106); and move the regions α1-β1 and α2b towards native structure.
Figure 6
Figure 6
(A) The template - target Cα-Cα deviation for the top four templates (sorted according to the LGA_S score) of T0898-D2. Yellow color marks regions with the distance <0.5 Å, orange 0.5-2 Å, light red 2-5 Å and dark red >5 Å. (B) Proximity of the target residues to the aligned residues in the best model (TS126_4_2, EdaRose, blue line), second-best model (TS287_5, Multicom-cluster, green line), top template (2lg1A, red dotted line) and the fourth template (3k7aI, magenta dotted line). The green line closely follows the magenta line, indicating that the second-best model was built on template 3k7aI.
Figure 7
Figure 7
Target T0882 (panel A) with its best server model (panel B), templates (panels C-E), and the alignment plot (panel F). (A) The native structure of target T0882 rainbow-colored from N-terminal (blue) to C-terminal (red). (B-E) Structural alignment of the target (cyan, Cα trace) and (B) the best server model TS005_1 (Baker-Rosettaserver, blue cartoon); (C) the main template used in the Rosetta modeling (2v3s, red); and auxiliary templates (D) 2lru, magenta; and (E) 2kt9, yellow. (F) Cα-Cα distances between the target residues and the aligned residues in the main template 2v3s (red dotted line), auxiliary template 2lru (magenta dotted line), and the best server model (blue). The main template (C) misses target’s (A) first strand, which is successfully modeled from auxiliary templates (D) and (E).
Figure 8
Figure 8
Performance of (A) all CASP12 groups on a subset of all-group (a.k.a. human) TBM + TBM/FM targets and (B) server groups on a complete set of TBM + TBM/FM targets. Human methods are in blue, servers in red. The data for all groups (panel A) are provided for the top 50 methods only (tables including all groups are available online). Groups are ranked based on the sum of per-target Z-scores calculated from the distribution of first model scores; negative Z-scores are set to 0 before the summation. Z-scores from different measures are combined in the formula Total_z = 1/3*z_GDT_HA + 1/9*(z_LDDT+z_CADaa+z_SG) + 1/3*z_ASE.
Figure 9
Figure 9
GDT_TS (black lines) and ASE (red lines) scores of four selected groups as a function of target difficulty. All four groups attain high average GDT_TS scores, but only two of them (Zhang and McGuffin) score well on ASE scores, while the remaining two score poorly. For all four groups, GDT_TS trend lines run higher for CASP12 (solid line) than for CASP11 (dashed line), indicating accuracy improvement.

References

    1. Berman H, Henrick K, Nakamura H, Markley JL. The worldwide Protein Data Bank (wwPDB): ensuring a single, uniform archive of PDB data. Nucleic Acids Res. 2007;35:D301–303. Database issue. - PMC - PubMed
    1. Zemla A, Venclovas, Moult J, Fidelis K. Processing and evaluation of predictions in CASP4. Proteins. 2001;(Suppl 5):13–21. - PubMed
    1. Xu J, Zhang Y. How significant is a protein structure similarity with TM-score = 0.5? Bioinformatics. 2010;26(7):889–895. - PMC - PubMed
    1. Kinch LN, Shi S, Cheng H, Cong Q, Pei J, Mariani V, Schwede T, Grishin NV. CASP9 target classification. Proteins. 2011;79(Suppl 10):21–36. - PMC - PubMed
    1. Kryshtafovych A, Monastyrskyy B, Fidelis K. CASP11 statistics and the prediction center evaluation system. Proteins. 2016;84(Suppl 1):15–19. - PMC - PubMed

Publication types