

Do pregnancy characteristics contribute to rising childhood cancer incidence rates in the United States?
- PMID: 29160610
- PMCID: PMC5766387
- DOI: 10.1002/pbc.26888
Do pregnancy characteristics contribute to rising childhood cancer incidence rates in the United States?
Abstract
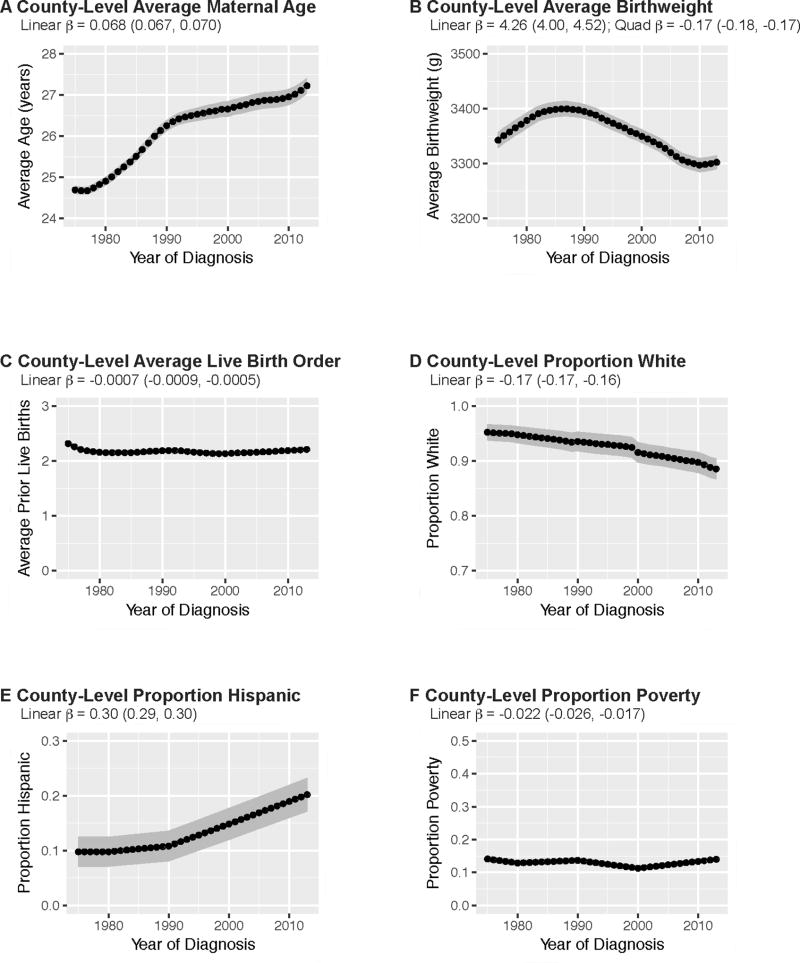
Background: Since 1975, childhood cancer incidence rates have gradually increased in the United States; however, few studies have conducted analyses across time to unpack this temporal rise. The aim of this study was to test the hypothesis that increasing cancer incidence rates are due to secular trends in pregnancy characteristics that are established risk factors for childhood cancer incidence including older maternal age, higher birthweight, and lower birth order. We also considered temporal trends in sociodemographic characteristics including race/ethnicity and poverty.
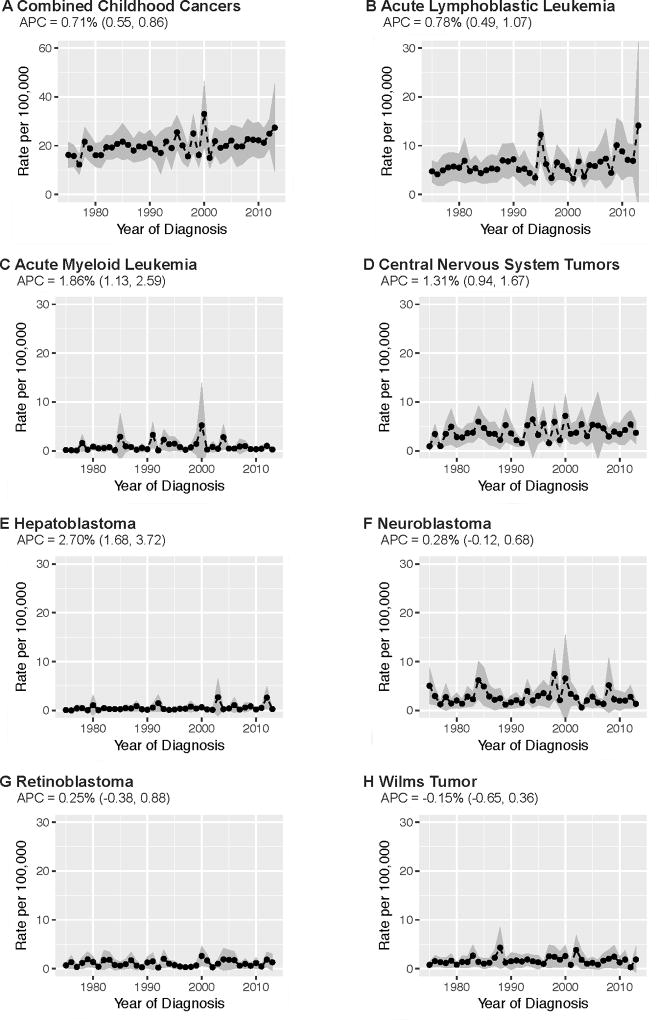
Procedure: We conducted a time series county-level ecologic analysis using linked population-based data from Surveillance, Epidemiology, and End Results cancer registries (1975-2013), birth data from the National Center for Health Statistics (1970-2013), and sociodemographic data from the US Census (1970-2010). We estimated unadjusted and adjusted average annual percent changes (AAPCs) in incidence of combined (all diagnoses) and individual types of cancer among children, ages 0-4 years, from Poisson mixed models.
Results: There was a statistically significant unadjusted temporal rise in incidence of combined childhood cancers (AAPC = 0.71%; 95% CI = 0.55-0.86), acute lymphoblastic leukemia (0.78%; 0.49-1.07), acute myeloid leukemia (1.86%; 1.13-2.59), central nervous system tumors (1.31%; 0.94-1.67), and hepatoblastoma (2.70%; 1.68-3.72). Adjustment for county-level maternal age reduced estimated AAPCs between 8% (hepatoblastoma) and 55% (combined). However, adjustment for other county characteristics did not attenuate AAPCs, and AAPCs remained significantly above 0% in models fully adjusted for county-level characteristics.
Conclusion: Although rising maternal age may account for some of the increase in childhood cancer incidence over time, other factors, not considered in this analysis, may also contribute to temporal trends.
Keywords: birth order; birthweight; childhood cancer; county-level incidence rates; ecologic time series analysis; maternal age.
© 2017 Wiley Periodicals, Inc.
Conflict of interest statement
The authors have no conflicts of interest to disclose.
Figures
References
-
- Ward E, DeSantis C, Robbins A, Kohler B, Jemal A. Childhood and adolescent cancer statistics, 2014. CA Cancer J Clin. 2014;64(2):83–103. - PubMed
-
- Linet MS, Ries LA, Smith MA, Tarone RE, Devesa SS. Cancer surveillance series: recent trends in childhood cancer incidence and mortality in the United States. J Natl Cancer Inst. 1999;91(12):1051–1058. - PubMed
-
- Adamson P, Law G, Roman E. Assessment of trends in childhood cancer incidence. Lancet. 2005;365(9461):753. - PubMed
-
- Bukowski JA. Critical assessment of opposing views on trends in childhood cancer. Int J Health Serv. 2000;30(2):373–377. discussion 379–386. - PubMed
Publication types
MeSH terms
Grants and funding
LinkOut - more resources
Full Text Sources
Other Literature Sources
Medical
