

Deciphering the fine nucleotide diversity of full HLA class I and class II genes in a well-documented population from sub-Saharan Africa
- PMID: 29160618
- PMCID: PMC5767763
- DOI: 10.1111/tan.13180
Deciphering the fine nucleotide diversity of full HLA class I and class II genes in a well-documented population from sub-Saharan Africa
Abstract
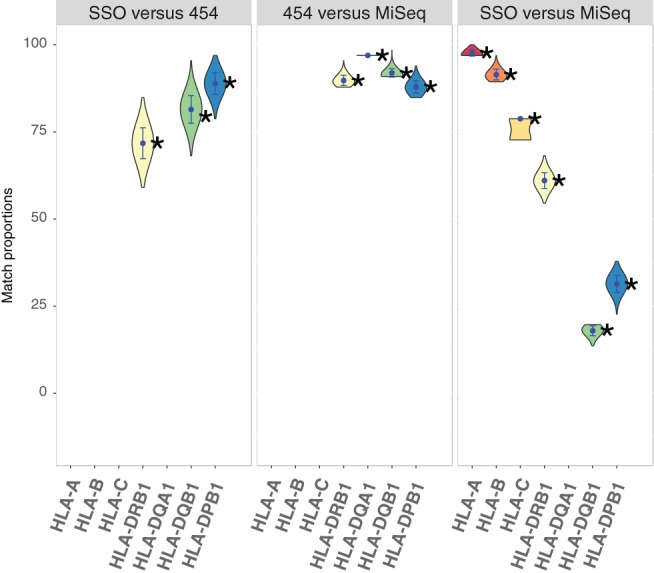
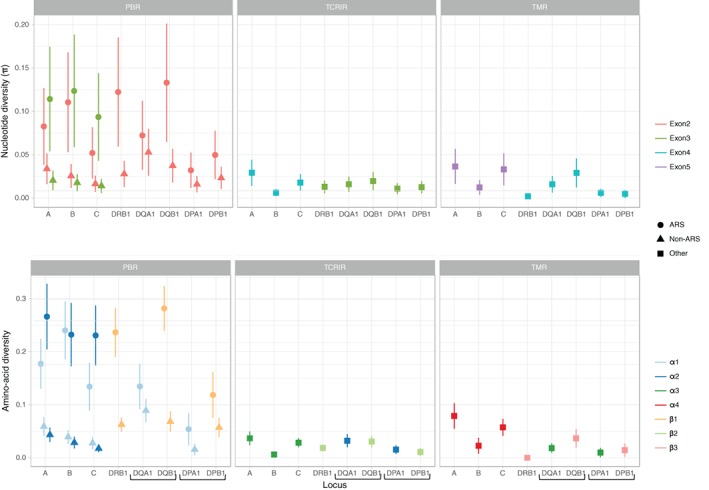
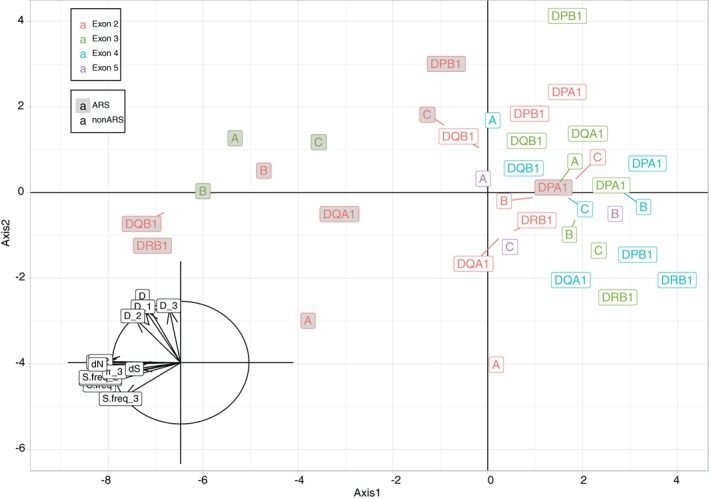
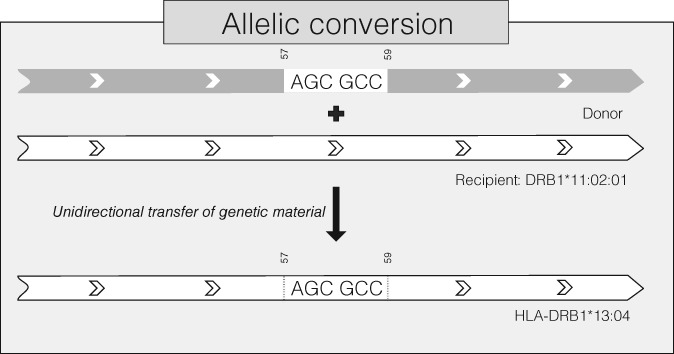
With the aim to understand how next-generation sequencing (NGS) improves both our assessment of genetic variation within populations and our knowledge on HLA molecular evolution, we sequenced and analysed 8 HLA loci in a well-documented population from sub-Saharan Africa (Mandenka). The results of full-gene NGS-MiSeq sequencing compared with those obtained by traditional typing techniques or limited sequencing strategies showed that segregating sites located outside exon 2 are crucial to describe not only class I but also class II population diversity. A comprehensive analysis of exons 2, 3, 4 and 5 nucleotide diversity at the 8 HLA loci revealed remarkable differences among these gene regions, notably a greater variation concentrated in the antigen recognition sites of class I exons 3 and some class II exons 2, likely associated with their peptide-presentation function, a lower diversity of HLA-C exon 3, possibly related to its role as a KIR ligand, and a peculiar molecular diversity of HLA-A exon 2, revealing demographic signals. Based on full-length HLA sequences, we also propose that the most frequent DRB1 allele in the studied population, DRB1*13:04, emerged from an allelic conversion involving 3 potential alleles as donors and DRB1*11:02:01 as recipient. Finally, our analysis revealed a high occurrence of the DRB1*13:04-DQA1*05:05:01-DQB1*03:19 haplotype, possibly resulting from a selective sweep due to protection to Onchorcerca volvulus, a prevalent pathogen in West Africa. This study unveils highly relevant information on the molecular evolution of HLA genes in relation to their immune function, calling for similar analyses in other populations living in contrasting environments.
Keywords: Onchocerciasis; HLA nucleotide diversity; West Africa; allelic conversion; balancing selection; full-length HLA genes; population genetics; selective sweep.
© 2017 The Authors HLA: Immune Response Genetics Published by John Wiley & Sons Ltd.
Conflict of interest statement
The authors have declared no conflicting interests.
Figures
References
-
- Shiina T, Hosomichi K, Inoko H, Kulski JK. The HLA genomic loci map: expression, interaction, diversity and disease. J Hum Genet. 2009;54(1):15‐39. https://doi.org/10.1038/jhg.2008.5. - DOI - PubMed
-
- Bentley G, Higuchi R, Hoglund B, et al. High‐resolution, high‐throughput HLA genotyping by next‐generation sequencing. Tissue Antigens. 2009;74(5):393‐403. https://doi.org/10.1111/j.1399-0039.2009.01345.x. - DOI - PMC - PubMed
-
- Shiina T, Suzuki S, Ozaki Y, et al. Super high resolution for single molecule‐sequence‐based typing of classical HLA loci at the 8‐digit level using next generation sequencers: Super high‐resolution DNA typing of HLA loci. Tissue Antigens. 2012;80(4):305‐316. https://doi.org/10.1111/j.1399-0039.2012.01941.x. - DOI - PubMed
-
- Gabriel C, Fürst D, Faé I, et al. HLA typing by next‐generation sequencing ‐ getting closer to reality: HLA typing by NGS. Tissue Antigens. 2014;83(2):65‐75. https://doi.org/10.1111/tan.12298. - DOI - PubMed
-
- Hosomichi K, Shiina T, Tajima A, Inoue I. The impact of next‐generation sequencing technologies on HLA research. J Hum Genet. 2015;60(11):665‐673. https://doi.org/10.1038/jhg.2015.102. - DOI - PMC - PubMed
Publication types
MeSH terms
Substances
LinkOut - more resources
Full Text Sources
Other Literature Sources
Research Materials
