. 2017;13(11):1813-1827.
doi: 10.1080/15548627.2017.1356550. Epub 2017 Nov 21.

Lipopolysaccharide mediates hepatic stellate cell activation by regulating autophagy and retinoic acid signaling

Affiliations

Lipopolysaccharide mediates hepatic stellate cell activation by regulating autophagy and retinoic acid signaling

Ming Chen et al. Autophagy. 2017.

Abstract

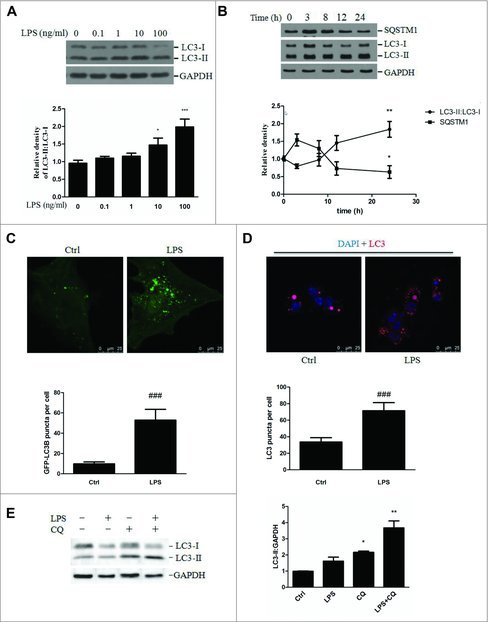
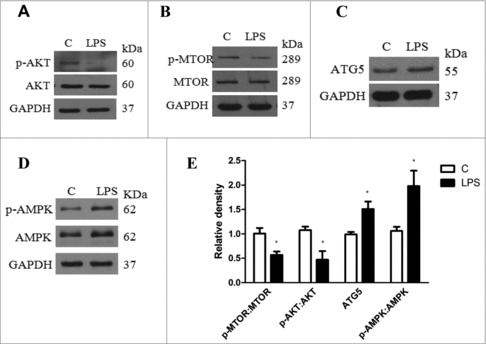
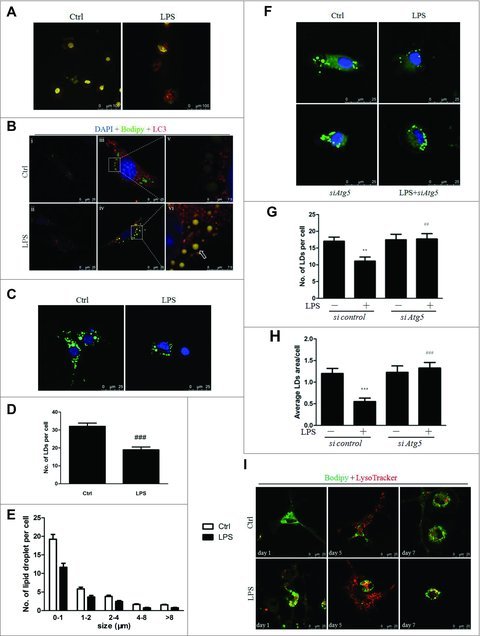
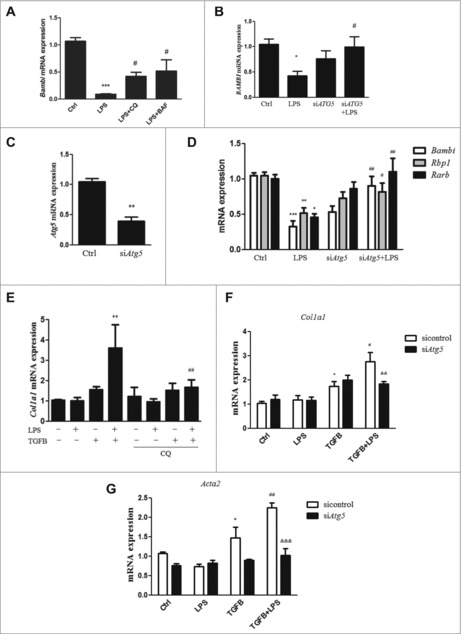
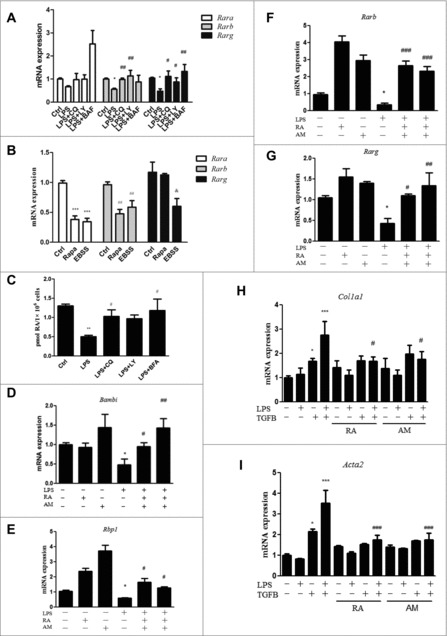
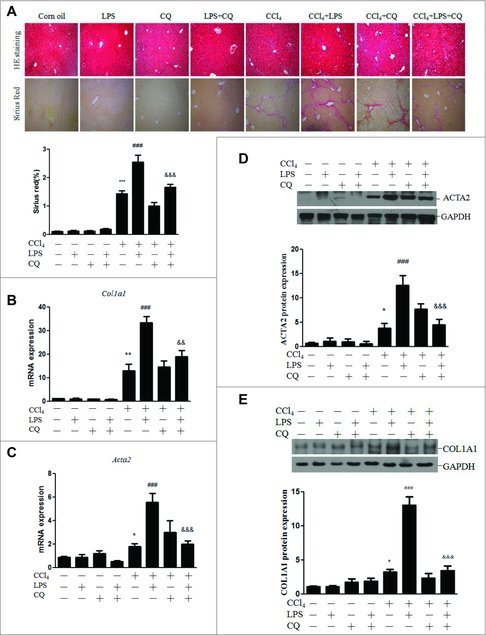
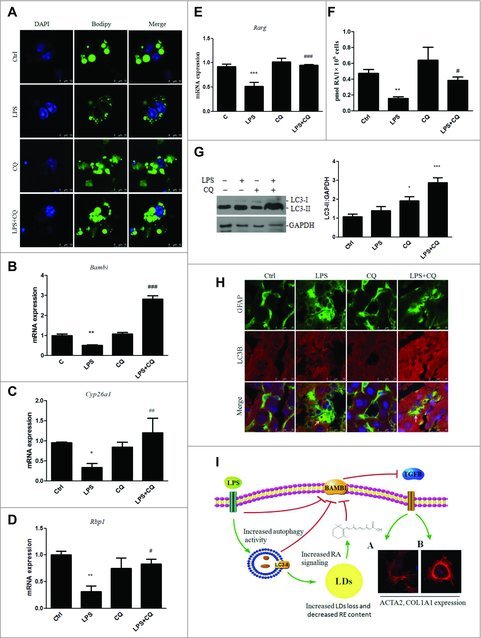
Bacterial translocation and lipopolysaccharide (LPS) leakage occur at a very early stage of liver fibrosis in animal models. We studied the role of LPS in hepatic stellate cell (HSC) activation and the underlying mechanisms in vitro and in vivo. Herein, we demonstrated that LPS treatment led to a dramatic increase in autophagosome formation and autophagic flux in LX-2 cells and HSCs, which was mediated through the AKT-MTOR and AMPK-ULK1 pathway. LPS significantly decreased the lipid content, including the lipid droplet (LD) number and lipid staining area in HSCs; pretreatment with macroautophagy/autophagy inhibitors or silencing ATG5 attenuated this decrease. Furthermore, lipophagy was induced by LPS through the autophagy-lysosomal pathway in LX-2 cells and HSCs. Additionally, LPS-induced autophagy further reduced retinoic acid (RA) signaling, as demonstrated by a decrease in the intracellular RA level and Rar target genes, resulting in the downregulation of Bambi and promoting the sensitization of the HSC's fibrosis response to TGFB. Compared with CCl4 injection alone, CCl4 plus LPS injection exaggerated liver fibrosis in mice, as demonstrated by increased Col1a1 (collagen, type I, α 1), Acta2, Tgfb and Timp1 mRNA expression, ACTA2/α-SMA and COL1A1 protein expression, and Sirius Red staining area, which could be attenuated by injection of an autophagy inhibitor. LPS also reduced lipid content in HSCs in vivo, with this change being attenuated by chloroquine (CQ) administration. In conclusion, LPS-induced autophagy resulted in LD loss, RA signaling dysfunction, and downregulation of the TGFB pseudoreceptor Bambi, thus sensitizing HSCs to TGFB signaling.

Keywords: BAMBI; LPS; TGFB; autophagy; hepatic stellate cell; liver fibrosis; retinoic acid signaling.


Figures

Figure 1.
Figure 1.
LPS-induced autophagosome formation in LX-2 cells. (A) Immunoblot analysis of the LC3 protein expression in LX-2 cells exposed to the indicated concentrations of LPS. The results from quantitative analyses of LC3 expression are shown in the lower panel. *p < 0.05, ***p < 0.001 compared with vehicle. (B) Immunoblot analysis of the LC3 and SQSTM1 proteins in LX-2 cells treated with LPS at various time points. The results from quantitative analyses are shown in the lower panel. *p < 0.05, **p < 0.01 compared with vehicle. (C) LX-2 cells were transfected with the plasmid GFP-LC3B for 24 h and then stimulated with LPS or vehicle for an additional 24 h. Representative images of GFP-LC3B puncta are shown. ###p < 0.001 versus vehicle. Scale bar: 25 μm. (D) LC3 staining was performed in LPS-treated HSCs and visualized by confocal microscopy. Representative images and the results of quantitative analyses of LC3-II puncta are shown in the upper and lower panels, respectively. ###p < 0.001 versus vehicle. Scale bar: 25 μm. (E) Freshly isolated MmHSCs were pretreated with CQ for 3 h and then stimulated with LPS for another 24 h. The upper panel depicts the LC3-II levels. The lower panel shows the results of quantitative analyses of LC3-II expression. *p < 0.05, **p < 0.01 compared with vehicle.
Figure 2.
Figure 2.
Expression of AKT-MTOR signaling proteins in LX-2 cells treated with LPS or vehicle for 24 h. (A-D) Representative western blots depicting total and phosphorylated (p- Thr308) AKT, total and phosphorylated (Ser2448) MTOR, total and phosphorylated (Thr172) AMPK and ATG5. (E) Quantitative analyses of the ATG5, MTOR and ATG5 expression ratios are shown. Data represent mean ± SEM. Open bar: control; closed bar: LPS group. *p < 0.05 versus control.
Figure 3.
Figure 3.
LPS modulated lipophagy via the autophagy-lysosomal pathway in LX-2 cells and HSCs. (A) AO staining showed that LPS increased lysosomal acidification in LX-2 cells. (B) LX-2 cells were pretreated with retinol + palmitic acid (iii-vi) or 0.2% ethanol (i, ii) overnight before LPS or vehicle stimulation for an additional 24 h. Representative images are shown, with (v) and (vi) showing the enlarged area of the white boxes enclosed in (iii) and (iv), respectively. Arrow indicates the colocalization of LDs and LC3. Scale bar: 25 μm for (i-iv) and 7.5 μm for (v-vi). (C-E) LDs staining (green) in freshly isolated HSCs treated with LPS. Nuclei were counterstained with DAPI (blue). Scale bar: 25 μm. Representative images (C) and results from the quantitative analysis of the number (D) and diameter distribution (E) of LDs are shown. ###p < 0.001 compared with control. Scale bar: 25 μm. (F-H) Freshly isolated HSCs were transfected with siAtg5 or scrambled siRNA for 24 h and then stimulated with LPS for another 24 h. LDs were stained with Bodipy. Representative images and quantitative results for the total number and area of LDs are shown in (F-H). Scale bar: 25 μm. (I) Representative images of LD staining (green) and lysosome (red) in isolated HSCs plated on dishes for 1, 5, and 7 d, followed by LPS or vehicle treatment of 24 h. Scale bar: 25 μm.
Figure 4.
Figure 4.
Role of autophagy in LPS-induced Bambi downregulation and HSC activation. (A) HSCs were pretreated with CQ and BAF for 3 h and subsequently treated with LPS for 24 h. Bambi mRNA expression is shown. ***p < 0.001 compared with control,#p < 0.05 compared with the LPS group. (B) BAMBI mRNA expression in LX-2 cells transfected with ATG5 siRNA and scrambled siRNA before LPS treatment. (C) The effect of siAtg5 knockdown was confirmed in HSCs. (D) Bambi, Rbp1 and Rarb mRNA expression in freshly isolated HSCs transfected with Atg5 siRNA and scrambled siRNA followed by LPS stimulation. (E) HSCs were pretreated with CQ before LPS treatment and then stimulated with TGFB. The mRNA expression of Col1a1 is shown. **p < 0.01 versus TGFB, ##p < 0.01 versus TGFB + LPS. (F-G) Col1a1 and Acta2 mRNA expression in HSCs transfected with siAtg5 or control siRNA and then stimulated with LPS followed by TGFB treatment. *p < 0.05 versus control, #p < 0.05, ##p < 0.01 versus TGFB, &&p < 0.01, &&&p < 0.001 versus TGFB+LPS.
Figure 5.
Figure 5.
A decreased RA signal in HSCs was required for the LPS-induced downregulation of Bambi and enhancement of the HSC response to TGFB. (A) Rara, Rarb and Rarg mRNA expression in freshly isolated HSCs pretreated with CQ, LY and BAF followed by LPS stimulation. *p < 0.05 relative to control, #p < 0.05 and ##p < 0.01 relative to LPS. (B) Rara, Rarb and Rarg mRNA expression in freshly isolated HSCs treated with the autophagy inducers rapamycin and EBSS. ***p < 0.001, ##p < 0.01, andp < 0.05 versus the corresponding control. (C) Quantitative measurement of the intracellular RA concentration in HSCs pretreated with the autophagy inhibitors CQ, LY and BAF followed by LPS. (D-G) Bambi, Rbp1, Rarb and Rarg mRNA expression in HSCs pretreated with the RAR activators RA or Am580 before LPS stimulation. *p < 0.05 versus control, #p < 0.05, ##p < 0.01 and ###p < 0.001versus LPS. (H-I) Col1a1 and Acta2 mRNA expression in HSCs pretreated with RA and Am580, followed by LPS and TGFB treatments. *p < 0.05, ***p < 0.001 versus control, #p < 0.05 versus LPS+TGFB.
Figure 6.
Figure 6.
Autophagy contributed to the LPS-mediated enhancement of the fibrotic response in CCl4-treated mice. Mice were injected with CCl4 or maize oil for 4 wk. For the last 2 of these weeks, a subset of mice was treated with CQ as well. Thereafter, the mice were injected with LPS (n = 6–8/group). (A) Representative images of H&E (HE) and Sirius Red staining in liver sections and quantification of Sirius Red staining (lower panel). (B-C) Hepatic mRNA expression of Col1a1 and Acta2. (D) Representative blots of the hepatic ACTA2 protein expression, with quantification shown in the lower panel. (E) Representative blots of the hepatic COL1A1 protein expression, with quantification shown in the lower panel. *p < 0.05, **p < 0.01, ***p < 0.001 versus control. ##p < 0.01, ###p < 0.001 versus CCl4. &&p < 0.01, &&&p < 0.001 versus CCl4 + LPS.
Figure 7.
Figure 7.
LPS induced autophagy, LD loss and decreased RA signaling in HSCs in vivo. Mice were injected with CQ before LPS administration. (A) LDs in HSCs were stained with Bodipy within 12 h after isolation. Scale bar: 10 μm. (B-E) mRNA expression of Bambi, Cyp26a1, Rbp1, and Rarg in isolated HSCs. *p < 0.05, **p < 0.01,***p < 0.001 versus control, #p < 0.05, ##p < 0.01, ###p < 0.001 versus the LPS group. (F) RA concentration was measured in HSCs in vivo. **p < 0.01 versus control, #p < 0.05 versus LPS. (G) Representative blots of LC3 expression are shown in HSCs, with quantification shown in the right panel. *p < 0.05, ***p < 0.001 compared with vehicle. (H) Double immunofluorescence staining of LC3 (red) and GFAP (green) in the liver. Arrows indicate the colocalization of GFAP and LC3. Scale bar: 25 μm. (I) A signal transduction diagram showing that LPS-induced autophagy mediated the LDs loss, decreased RA signaling and downregulated Bambi in HSCs, subsequently sensitizing them to TGFB-induced activation. TGs, triglycerides. RE, retinyl ester.

References

    1. Bataller R, Brenner DA. Liver fibrosis. J Clin Invest. 2005;115:209-18. https://doi.org/10.1172/JCI24282. PMID:15690074 - DOI - PMC - PubMed
    1. Friedman SL. Liver fibrosis – from bench to bedside. J Hepatol. 2003;38(Suppl 1):S38-53. https://doi.org/10.1016/S0168-8278(02)00429-4. PMID:12591185 - DOI - PubMed
    1. Xu J, Liu X, Koyama Y, Wang P, Lan T, Kim IG, Kim IH, Ma HY, Kisseleva T. The types of hepatic myofibroblasts contributing to liver fibrosis of different etiologies. Front Pharmacol. 2014;5:167. https://doi.org/10.3389/fphar.2014.00167. PMID:25100997 - DOI - PMC - PubMed
    1. Iwaisako K, Jiang C, Zhang M, Cong M, Moore-Morris TJ, Park TJ, Liu X, Xu J, Wang P, Paik YH, et al.. Origin of myofibroblasts in the fibrotic liver in mice. Proc Natl Acad Sci U S A. 2014;111:E3297-305. https://doi.org/10.1073/pnas.1400062111. PMID:25074909 - DOI - PMC - PubMed
    1. Kaur J, Debnath J. Autophagy at the crossroads of catabolism and anabolism. Nat Rev Mol Cell Biol. 2015;16:461-72. https://doi.org/10.1038/nrm4024. PMID:26177004 - DOI - PubMed

Publication types

MeSH terms