. 2018 Jan 17;63(2):025036.
doi: 10.1088/1361-6560/aa9c1f.

Proton range verification in homogeneous materials through acoustic measurements

Affiliations

Proton range verification in homogeneous materials through acoustic measurements

Wei Nie et al. Phys Med Biol. .

Abstract

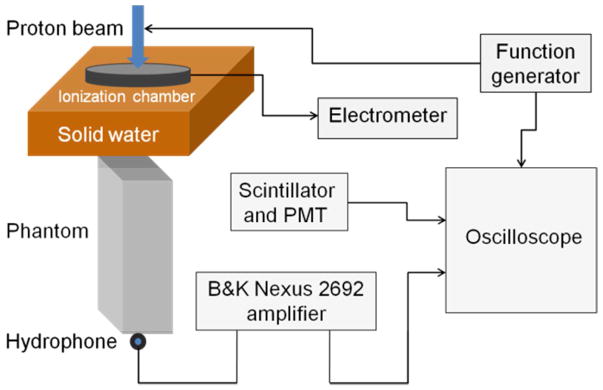
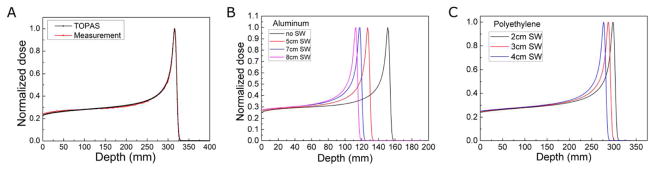
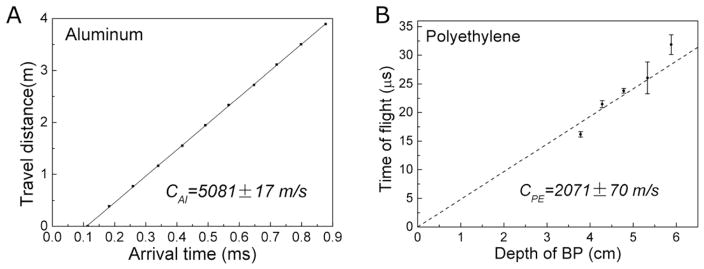
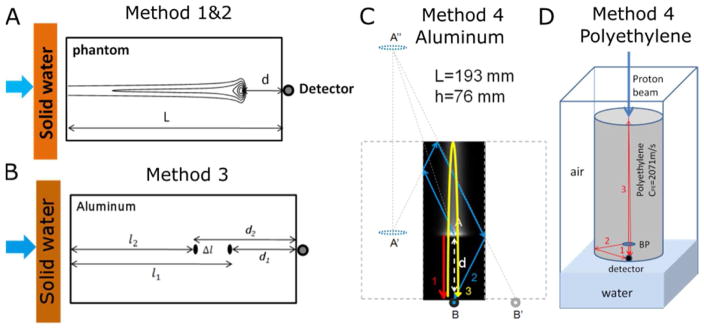
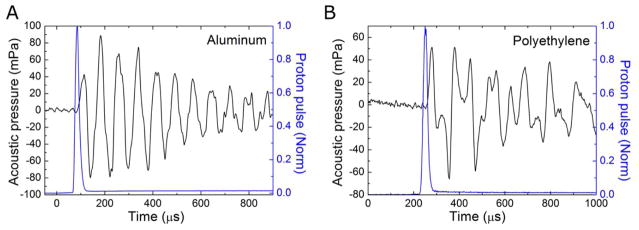
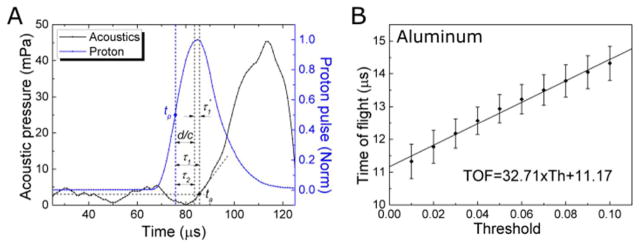
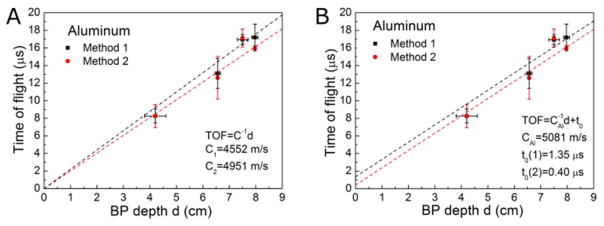
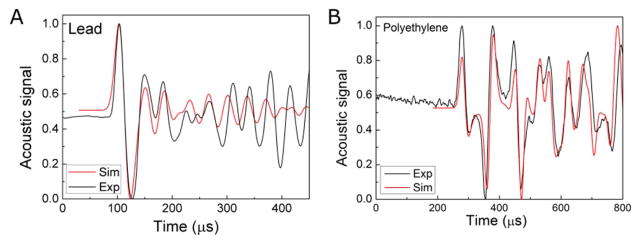
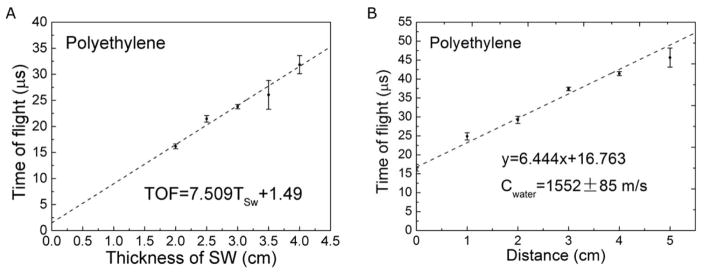
Clinical proton beam quality assurance (QA) requires a simple and accurate method to measure the proton beam Bragg peak (BP) depth. Protoacoustics, the measurement of the pressure waves emitted by thermal expansion resulting from proton dose deposition, may be used to obtain the depth of the BP in a phantom by measuring the time-of-flight of the pressure wave. Rectangular and cylindrical phantoms of different materials (aluminum, lead, and polyethylene) were used for protoacoustic studies. Four different methods for analyzing the protoacoustic signals are compared. Data analysis shows that, for Methods 1 and 2, plastic phantoms have better accuracy than metallic ones because of the lower speed of sound. Method 3 does not require characterizing the speed of sound in the material, but it results in the largest error. Method 4 exhibits minimal error, less than 3 mm (with an uncertainty ⩽1.5 mm) for all the materials and geometries. Psuedospectral wave-equation simulations (k-Wave MATLAB toolbox) are used to understand the origin of acoustic reflections within the phantom. The presented simulations and experiments show that protoacoustic measurements may provide a low cost and simple QA procedure for proton beam range verification as long as the proper phantoms and calculation methods are used.


Figures

Figure 1
Figure 1
A Diagram of the experimental setup. The incident 230 MeV proton beam was directed downward from the figure top (the gantry was set as 0o). The beam passes through the ionization chamber and solid water before reaching the phantom. The Brüel and Kjær 8105 hydrophone was mounted on the control arm of an IBA Blue Phantom water tank. The hydrophone was positioned at the distal surface of the phantom on the beam propagation axis. The distal end of the phantom and the hydrophone were immersed in water for acoustic coupling.
Figure 2
Figure 2
The TOPAS-calculated proton integrated depth dose in water is validated by measured dose in water (A). The TOPAS-calculated integrated depth dose is also shown for aluminum (B) and polyethylene (C) phantoms after energy degradation with variable solid water thicknesses.
Figure 3
Figure 3
The speed of sound in aluminum was measured with the reflection technique (A). (B) The speed of sound in polyethylene (2071 ± 70 m/s) phantoms were obtained with the shift-Bragg-peak technique by linearly fitting the depth of the BP to TOF (obtained by method 1).
Figure 4
Figure 4
Illustration of Methods 1- 4 for determining the BP depth. (A) Diagram of method 1&2. (B) Arrival times (τ1(T1), τ1(T2)) were measured before and after shifting the depth of the BP by adding solid water into the beam path. The BP is shifted by Δl=twρwρmS¯wS¯w . With the help of acoustic simulation, the travel path of acoustic signals inside the phantom can be identified. Hence the difference in the arrival time of acoustic signals can be related to the depth of the BP and the geometry of the rectangular aluminum phantom (C) and the cylindrical polyethylene phantom (D). In the cylindrical case, the second arriving pressure peak is due to reflection off the circular side surface. Although this is depicted with one arrow, the wave is propagated outward in all radial dimensions, reflects off of the outer circular surface, and constructively arrives at the detector.
Figure 5
Figure 5
Experimentally detected protoacoustic signals generated in aluminum (A) and polyethylene (B) phantoms. The normalized proton beam pulse (as measured by the PMT/scintillator) is indicated with the blue line.
Figure 6
Figure 6
Depiction of the variables measured for Method 1 and 2. The proton beam pulse (blue) was measured by scintillator/PMT, and the protoacoustic signal was detected with a hydrophone (black) (A). The average of the background acoustic signal is indicated by the horizontal grey line. (B)The rising segment of the acoustic signal is linearly fit to obtain the systematic time delay and threshold value for Methods 1 and 2.
Figure 7
Figure 7
Comparison of Method 1 and Method 2. (A) The TOF obtained by Method 1 and Method 2 are compared by linearly fitting the TOF to the depth of the BP (the y-intercept was fixed to 0). The inverse of the slopes were compared to the speed of sound in aluminum. (B) Linear fit of the TOF to BP depth BP with a fixed slope, which is the inverse of the speed of sound in aluminum obtained by experiments.
Figure 8
Figure 8
Acoustic k-Wave simulation. Comparison of the simulation to experimental data collected in lead (49×102×202 mm3) (A) and polyethylene (r=104 mm, L=336 mm) (B) phantoms shows that acoustic signal are determined by the geometry and speed of sound in the phantom. (2160 m/s and 11.35 kg/cm3 for lead and 2071 m/s and 0.92 kg/cm3 for polyethylene).
Figure 9
Figure 9
By combining multiple measurements at various BP depths (A) and hydrophone-to-phantom distances (B), the Method 1 protoacoustic range verification accuracy was improved. From the linear fit of arrival time to introduced BP shift, the y-intercept gives the acoustic TOF from the BP to the distal surface of the phantom. By plotting the arrival time versus hydrophone to phantom distance, the extrapolated y-intercept gives the acoustic TOF from the BP to the distal surface of the phantom.

References

    1. Moiz Ahmad, et al. Theoretical detection threshold of the proton-acoustic range verification technique. Medical physics. 2015;42(10):5735–5744. - PMC - PubMed
    1. Albul VI, et al. Measurements of the parameters of the acoustic radiation accompanying the moderation of an intense proton beam in water. Instruments and Experimental Techniques. 2001;44(3):327–334.
    1. Alsanea F, Moskvin V, Stantz KM. Feasibility of RACT for 3D dose measurement and range verification in a water phantom. Med Phys. 2015;42(2):937–46. - PubMed
    1. Arjomandy B, et al. Use of a two-dimensional ionization chamber array for proton therapy beam quality assurance. Med Phys. 2008;35(9):3889–94. - PubMed
    1. Askaryan GA. Hydrodynamic radiation from the tracks of ionizing particles in stable liquids. The Soviet Journal of Atomic Energy. 1957;3(2):921–923.

Publication types

LinkOut - more resources