

Review
doi: 10.1021/acs.analchem.7b04747.
Epub 2017 Dec 15.
Top-Down Proteomics: Ready for Prime Time?
Affiliations
- PMID: 29161012
- PMCID: PMC6138622
- DOI: 10.1021/acs.analchem.7b04747
Item in Clipboard
Review
Top-Down Proteomics: Ready for Prime Time?
Anal Chem.
.
Erratum in
-
Correction to Top-Down Proteomics: Ready for Prime Time?Anal Chem. 2018 Dec 18;90(24):14643. doi: 10.1021/acs.analchem.8b05506. Epub 2018 Dec 7. Anal Chem. 2018. PMID: 30522269 No abstract available.
Abstract
Conflict of interest statement
The authors declare no competing financial interest.
Figures
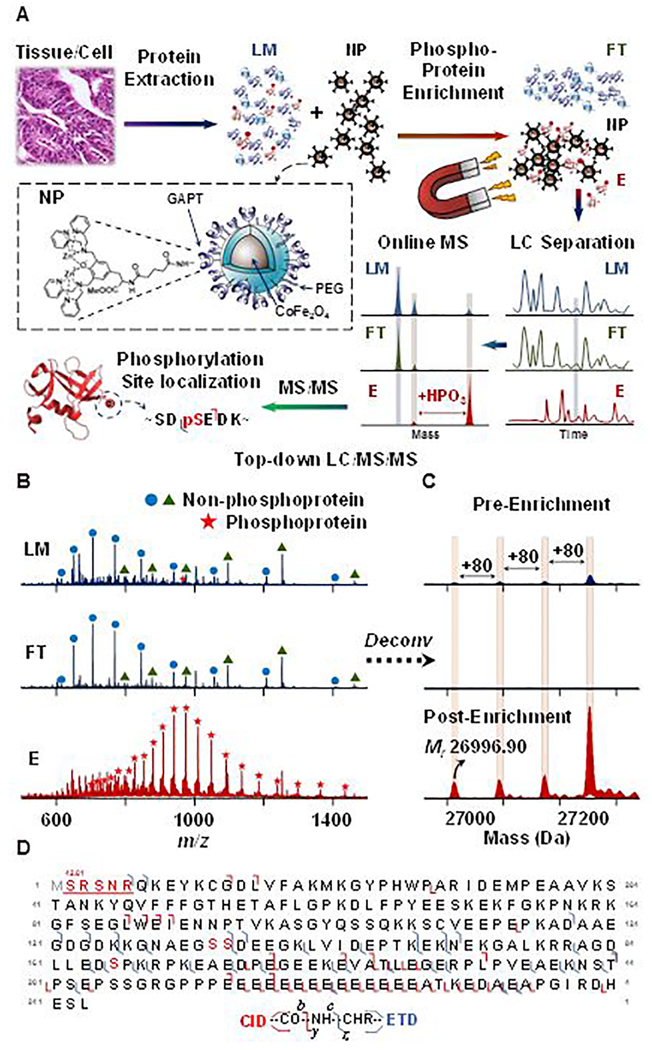
(A) Schematic illustration of intact phosphoprotein enrichment using functionalized magnetic nanoparticles (NPs) coupled with online LC-MS/MS. (B-D) Representative LC-MS/MS analysis of low-abundance phosphoprotein enabled by effective CoFe2O4 NP-based enrichment from a complex swine heart tissue extract. (B) MS spectra of loading mixture (LM, dark blue), flow through (FT, light blue), and elution (E, red) from 32.3 min to 32.7 min; (C) the corresponding deconvoluted spectra. Ion intensities were normalized in both A and B. (D) Fragment ion map of online LC-MS/MS analysis with CID and ETD from triply phosphorylated precursor ion (29+). Grey “M” indicates methionine excision and red “S” indicates phosphorylation sites. Red numbers above the underlined red sequence reveal modifications with their additional mass. Adapted and reproduced from Chen, B.; Hwang, L.; Ochowicz, W.; Lin, Z.; Guardado-Alvarez, T. M.; Cai, W.; Xiu, L.; Dani, K.; Colah, C.; Jin, S.; Ge, Y. Chem. Sci. 2017, 8, 4306–4311 (ref 52), with permission of The Royal Society of Chemistry.
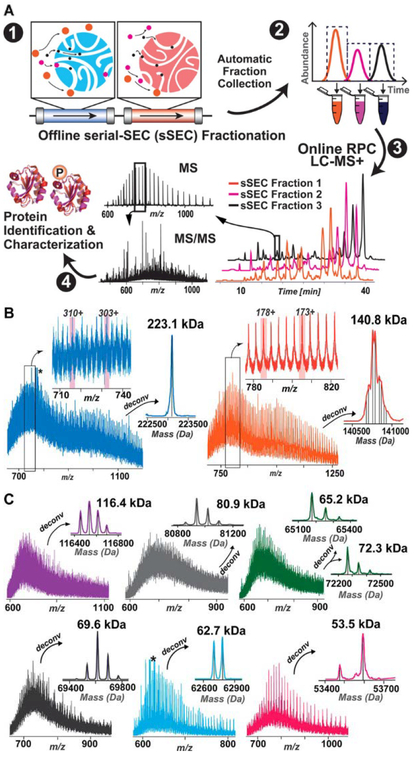
(A) Schematic illustration of the serial size exclusion chromatography strategy enabling high-resolution size based separation to facilitate the detection of large molecular-weight intact proteins. (B) Representative mass spectra for 223.1 and 140.8 kDa with zoom-in views of the charge states and the corresponding deconvoluted spectra. The deconvoluted spectrum of the 140.8 kDa protein shows multiple proteoforms. (C) Representative mass spectra and the deconvoluted spectra of proteins with MW 116.4, 80.9, 65.2, 72.3, 69.6, 62.7, and 53.5 kDa. Adapted and reproduced from Cai, W.; Tucholski, T.; Chen, B.; Alpert, A. J.; McIlwain, S.; Kohmoto, T.; Jin, S.; Ge, Y. Anal. Chem. 2017, 89, 5467–5475 (ref 69). Copyright 2017 American Chemical Society.
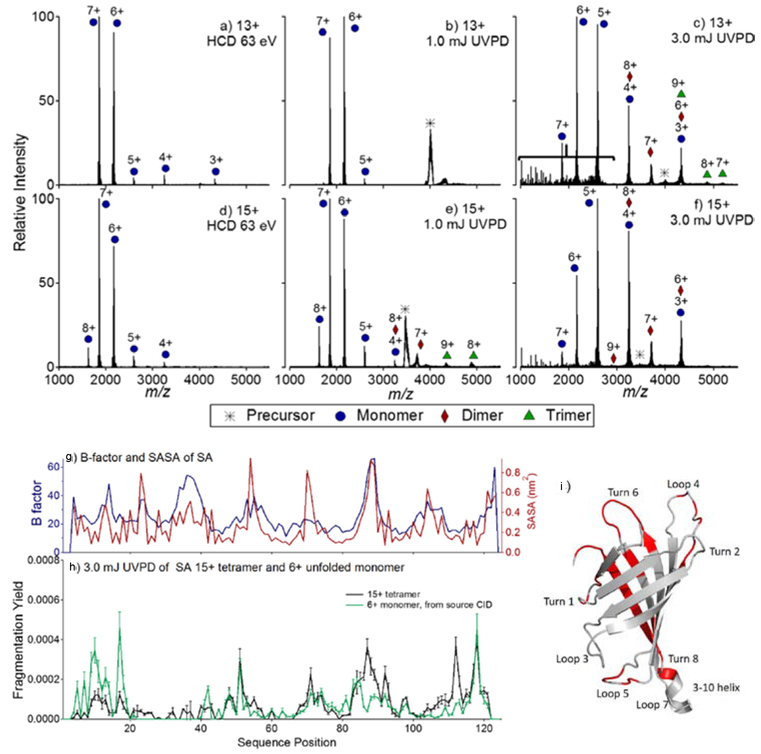
HCD and UVPD of 13+ and 15+ tetrameric streptavidin. In (a) and (d) HCD of the 13+ and 15+ charge states is shown, respectively. In (b) and (e) 1.0 mJ UVPD of the 13+ and 15+ charge states is shown, and in (c) and (f) 3.0 mJ UVPD of the 13+ and 15+ charge states is shown. The bracket in (c) denotes the region populated by fragments originating from cleavages of the protein backbone (i.e., sequence-type ions). For streptavidin: (g) B-factor values and SASA, (h) UVPD fragmentation yields (15+), and (i) the crystal structure of SA (pdb 1SWB) is highlighted such that regions featuring enhanced UVPD fragmentation are shown in red. In (b), the UVPD fragmentation yield of the 6+ monomer of SA, generated from source CID, is shown in green. Adapted and reproduced from Morrison, L. J.; Brodbelt, J. S. J. Am. Chem. Soc. 2016, 138, 10849–10859 (Ref 90). Copyright 2016 American Chemical Society.
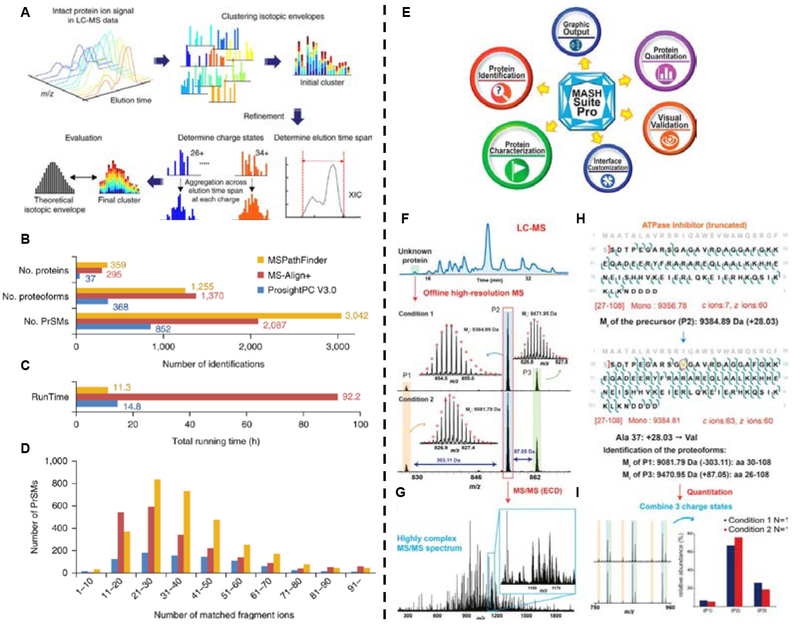
Left: (A) LC-MS feature finding in ProMex. An LC-MS feature refers to a group of isotopomer envelopes corresponding to the same proteoform species across all charge states and LC elution times. The ProMex algorithm begins with clustering isotopomer envelopes across adjacent time and charge state. The initial cluster is refined to accurately determine its elution time span and range of charge states. After refinement, ProMex calculates the likelihood that the final cluster is a true LC-MS feature. (B-D) Protein identification and characterization results for a human ovarian tumor. (B) The number of proteins, proteoforms, and protein- spectrum matches (PrSMs) identified by ProsightPC V3.0 (E-value ≤ 10−4), MS-Align+ (1% FDR), and MSPathFinder (1% FDR). (C)Total running time for deconvolution and database search. (D) Histogram of the number of matched fragment ions. Adapted and reprinted by permission from Macmillan Publishers Ltd: NATURE METHODS, Park, J.; Piehowski, P. D.; Wilkins, C.; Zhou, M.; Mendoza, J.; Fujimoto, G. M.; Gibbons, B. C.; Shaw, J. B.; Shen, Y.; Shukla, A. K.; Moore, R. J.; Liu, T.; Petyuk, V. A.; Tolic, N.; Pasa-Tolic, L.; Smith, R. D.; Payne, S. H.; Kim, S. Nat. Methods 2017, 14, 909–914 (ref #11).Copyright 2017. Right: (E) Schematic summarizing the various functions and features of MASH Suite Pro. The major functions of MASH Suite Pro include protein identification, quantitation, and characterization of protein PTMs from top-down MS and MS/MS experiments. The program is equipped with various visualization components for the validation of the deconvolution results, identification results, and fragment ion assignments. Additional features include direct output of the graphics and customization of the program interface. (F-J) Identification and characterization of an unknown protein followed by quantitation of the proteoforms using MASH Suite Pro. (F) An unknown protein was detected in LC-MS and the fraction containing the protein was collected and analyzed by high-resolution MS. Top-down MS revealed three proteoforms (P1, P2 and P3). The relative abundance of each proteoform varied in two different experimental conditions. (G) The proteoform (P2) was selected for fragmentation using electron capture dissociation, resulting in a highly complex MS/MS spectrum. (H) MASH Suite Pro was used for spectral deconvolution and protein identification. The proteoform P2 was identified to be a truncated form of the ATPase inhibitor containing amino acids (aa) 27–108. Characterization of the protein sequence using MASH Suite Pro identified a sequence variation (Ala37Val). Based on the protein sequence, the proteoforms (P1) and (P3) were deduced to be aa 30–108 and aa 26–108 of ATPase inhibitor. (I) MASH Suite Pro provided rapid quantitation to determine the relative abundances of the different proteoforms in different experimental conditions. Reproduced from Cai, W. X.; Guner, H.; Gregorich, Z. R.; Chen, A. J.; Ayaz-Guner, S.; Peng, Y.; Valeja, S. G.; Liu, X. W.; Ge, Y. Mol. Cell. Proteomics 2016, 15, 703–714 (ref xxx). Copyright 2016 American Society for Biochemistry and Molecular Biology.
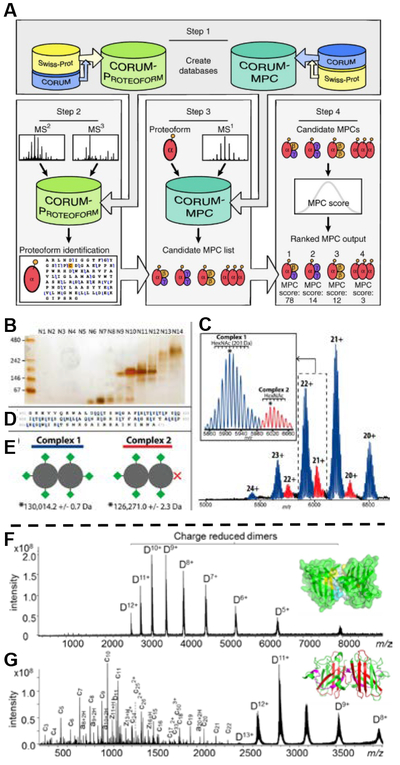
Top: (A) Computational platform and workflow for the characterization of human multi-proteoform complexes (MPCs). Adapted and reprinted by permission from Macmillan Publishers Ltd: NATURE METHODS, Skinner, O. S.; Havugimana, P. C.; Haverland, N. A.; Fornelli, L.; Early, B. P.; Greer, J. B.; Fellers, R. T.; Durbin, K. R.; Do Vale, L. H. F.; Melani, R. D.; Seckler, H. S.; Nelp, M. T.; Belov, M. E.; Horning, S. R.; Makarov, A. A.; LeDuc, R. D.; Bandarian, V.; Compton, P. D.; Kelleher, N. L. Nat. Methods 2016, 13, 237- (ref #xxx). (B-E) Identification and purification of L-amino acid oxidase multiproteoform complexes. A native GELFrEE separation of whole O. hannah venom visualized using a native, silver-stained slab gel (B). An intact mass spectrum of the homodimeric L-amino acid oxidase - LAAO (P81383) multiproteoform complexes (MPCs) is shown in (C). In detail, the observed microheterogenity in the two MPCs corresponds to HexNAc mass differences (increments of 203 Da, see scale bar in the inset of Panel B). The partial fragment map (D), showing selected fragment ions from the C-terminal region of LAAO, which enabled its unambiguous identification by database retrieval. Blue and red MPCs in B are consistent with the presence of 6 (Complex 1) and 5 occupied N-glycosites (Complex 2), respectively; their graphical representation is shown at lower left (E, green diamond corresponds to a glycosylation moiety with average mass of 3,743 Da). Mass values for Complexes 1 and 2 are given in (E) and correspond to the peaks marked with the asterisks in the inset of Panel (C). Reproduced from Melani, R. D.; Skinner, O. S.; Fornelli, L.; Domont, G. B.; Compton, P. D.; Kelleher, N. L. Mol. Cell. Proteomics 2016, 15, 2423–2434 (ref xxx). Copyright 2016 American Society for Biochemistry and Molecular Biology. Bottom: Native top-down (F) ECD and (G) EID MS of the apo-SOD1 dimer (10+ ~ 12+). EID fragment ions from the N-terminal regions are color-coded in red and products from the C-terminal regions are in magenta. (Representative spectra are shown; each spectrum was acquired from 200 scans.) Adapted and reproduced from Li, H. L.; Sheng, Y. W.; McGee, W.; Cammarata, M.; Holden, D.; Loo, J. A. Anal. Chem. 2017, 89, 2731–2738 (ref xxx). Copyright 2017 American Chemical Society.
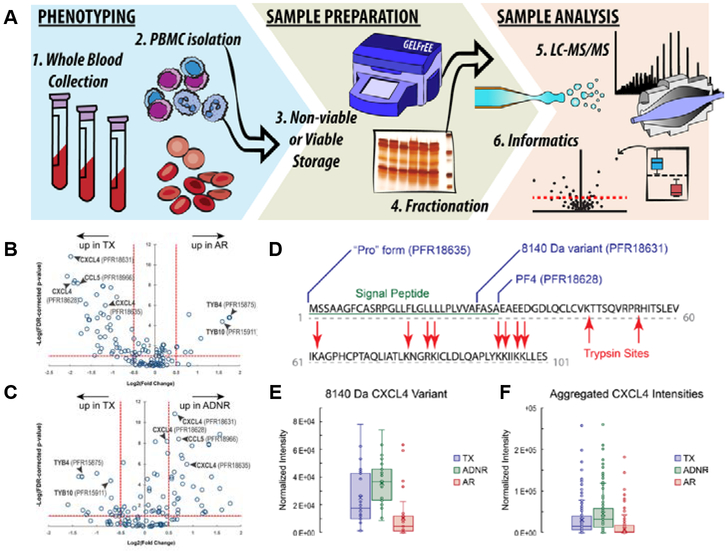
(A) Schematic workflow for discovery-mode, translational, top-down proteomics applied to liver transplant patient groups (acute rejection [AR]; transplant excellent [TX]; acute dysfunction, no rejection [ADNR]) from blood collection to informatics analysis. Representative label-free, top-down, quantitative analysis describing differentially expressed proteoforms between TX and AR (B) and between TX and ADRN (C) patient group, respectively. For all proteoforms detected in the majority of data files across the data set (open circles), ANOVA was used to assign variation in signal intensity to phenotype-specific effects after accounting for patient-to-patient and technical variation. The x-axis represents the effect size as measured by fold-change (log2transformed) between patient groups. The y-axis (FDR-corrected p-value) is a measure of the statistical confidence that signal variation is associated with phenotype. The dashed lines represent our arbitrary thresholds for delineating significant hits: The horizontal dashed line corresponds to a 5% FDR, and vertical dashed lines represent effect sizes 1.4-fold above and below no change. (D-F) Proteoform-resolved analysis of PF4/CXCL4 differentially expressed proteoforms characterized by top-down proteomics and an in silico comparison to tryptic peptide-based approaches. (D) The full-length canonical sequence of PF4/CXCL4 (accession no. P02776). Blue flags depict the cleavage sites of the three differentially abundant PF4/CXCL4 proteoforms and are labeled with their identity. The sequence underlined in green is the signal peptide, and red arrows delineate trypsin cleavage sites generated in silico. Notably, tryptic peptides do not span the region of sequence variability describing the three proteoforms of interest in this study. (E) Box-and-whisker plot comparison of the 8140-Da PF4/CXCL4 proteoform intensities across all patients and injections, which were found to be significantly decreased in AR patients. (F) Box-and-whisker plots made from aggregating all PF4/CXCL4 proteoform intensities per patient group to emulate a quantitative comparison using intensities of tryptic peptides, which cannot distinguish the proteoforms. Notably, the effect size is lost to noise in this in silico experiment, and the analysis would return a false negative by bottom-up proteomics. For the box-and-whisker plots, data points represent the normalized intensities of the proteoform of interest yielded from every technical replicate (data file) per patient in which the proteoform was detected (TX: n = 8 patients, 31 data files; ADNR n = 9 patients, 31 data files; AR: n = 9 patients, 33 data files). Adapted and reproduced from Proteoforms in Peripheral Blood Mononuclear Cells as Novel Rejection Biomarkers in Liver Transplant Recipients, Toby, T. K.; Abecassis, M.; Kim, K.; Thomas, P. M.; Fellers, R. T.; LeDuc, R. D.; Kelleher, N. L.; Demetris, J.; Levitsky. Am. J. Tranplant., Vol. 17, Issue 9 (ref XXX). Copyright 2017 Wiley
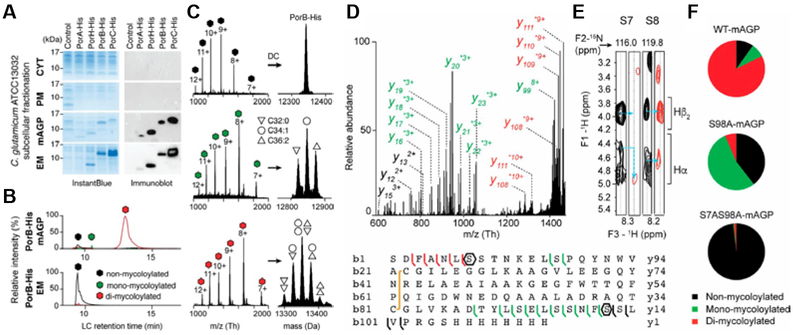
Identification and characterization of distinct proteoforms for C. glutamicum OMPs associated with the mAGP complex and secreted in the extracellular medium. (A) C. glutamicum ATCC13032 cells expressing recombinant PorA-His, PorHHis, PorB-His, and PorC-His were cultured under identical conditions. Subcellular fractions corresponding to the CYT, the PM, the mAGP complex, and the extracellular medium were analyzed by SDS/PAGE after staining with InstantBlue (Left) and Western blotting (Right) with antibodies against the protein His tag. Fractions isolated from WT, untransformed cells were coanalyzed as control. Molecular mass markers (in kilodaltons) are indicated next to the gel. (B) Extracted ion chromatograms of PorB-His purified from mAGP (Upper) and extracellular medium (Lower) fractions containing nonmycoloylated (black), monomycoloylated (green), and dimycoloylated (red) proteoforms. (C) Representation of the multicharged MS spectra (Left) and deconvoluted (DC) spectra obtained for PorB-His proteoforms with isotopic resolution (Right). The mycolic acid compositions of each proteoform are indicated by triangle and circle symbols. EM, extracellular medium. Example of PorB. (D) Top-down CID of dimycoloylated PorB-His-10+ charge state (m/z 1,336.10 Th) with nonmycoloylated, monomycoloylated, and dimycoloylated y and b fragments colored black, green, and red, respectively. The sequence coverage was obtained by fragmenting the 8+, 9+, and 10+ charge states of PorB-His, identifying S98 and S7/ S8 residues (polygons) as putative mycoloylation sites and a disulfide bond between C22 and C81 (yellow line). (E) Solution NMR analysis of nonmycoloylated (black) and mycoloylated (red) PorB-His. Selected strips extracted from 3D 1 H, 15N, 1 H heteronuclear single quantum coherence–total correlation spectroscopy (HSQC-TOCSY) spectra obtained on (U-15N)-labeled PorB-His showing Hα and Hβ2 chemical shifts of S7 and S8 residues for the two proteoforms. Although 1 H resonances from S8 were not affected, significant spectral changes were observed for Hα of residue S7 (blue arrows), thus identifying the O-acylation of the S7 hydroxyl of PorB-His. (F) The positions of PTM within the protein sequence were validated by site-directed mutagenesis of S7 and S98 residues and subsequent MS analysis of PorB-His WT (WT-mAGP; Top) and its mutant derivatives PorB-S98A (S98A-mAGP; Middle) and PorB-S7AS98A (S7AS98A-mAGP; Bottom). Nonmycoloylated (black), monomycoloylated (green), and dimycoloylated (red) proteoforms were semiquantified from extracted ion chromatograms of the corresponding 9+ charge states. Adapted and reproduced with permission from Proceedings of the National Academy of Sciences USA Carel, C.; Marcoux, J.; Reat, V.; Parra, J.; Latge, G.; Laval, F.; Demange, P.; Burlet-Schiltz, O.; Milon, A.; Daffe, M.; Tropis, M. G.; Renault, M. A. M. Proc. Natl. Acad. Sci. U.S.A. 2017, 114, 4231–4236 (ref # XXX)
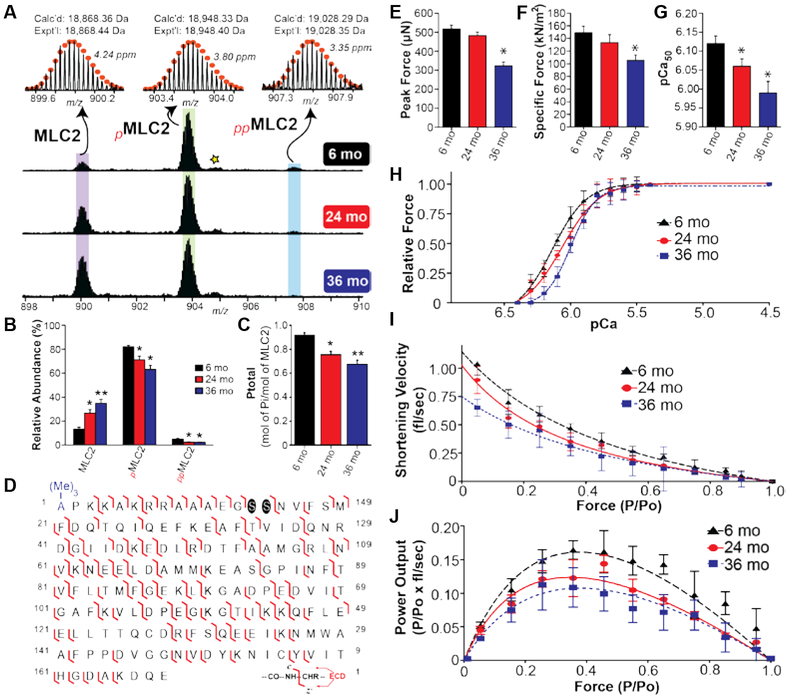
Progressive decrease in the phosphorylation of fast skeletal RLC is observed with advancing age. (A) Representative mass spectra of RLC from 6, 24, and 36 month old rats. Circles represent the theoretical isotopic abundance distribution of the isotopomer peaks corresponding to the assigned monoisotopic mass. Star represents oxidized pRLC. m/z, mass-to-charge ratio. Calc’d, calculated monoisotopic molecular mass based on protein sequence. Expt’l, experimentally determined molecular mass. (B) Graph showing the relative abundances of RLC, pRLC, and ppRLC proteoforms in the gastrocnemius muscle of rats from different age groups. (C) Graph showing decrease in total RLC phosphorylation (expressed as mol Pi / mol of RLC) with advancing age. n = 5 for 6 and 24 month old groups, and n = 6 for 36 month old group. mo, month. All values represent mean ± SEM *p < 0.05 versus 6 mo, **p < 0.001 versus 6 mo. (D) Representative fragmentation map for ppRLC proteoforms. Phosphorylation sites are highlighted by circles. (Me)3- represents Nα - trimethylation. Reproduced from Gregorich, Z. R.; Peng, Y.; Cai, W. X.; Jin, Y. T.; Wei, L. M.; Chen, A. J.; McKiernan, S. H.; Aiken, J. M.; Moss, R. L.; Diffee, G. M.; Ge, Y. J. Proteome Res. 2016, 15, 2706−2716 (ref xxx). Copyright 2016 American Chemical Society.
References
Publication types
MeSH terms
Grants and funding
LinkOut - more resources
Full Text Sources
Other Literature Sources
