

Meeting the Institute of Medicine's 2030 US Life Expectancy Target
- PMID: 29161064
- PMCID: PMC5719677
- DOI: 10.2105/AJPH.2017.304099
Meeting the Institute of Medicine's 2030 US Life Expectancy Target
Abstract
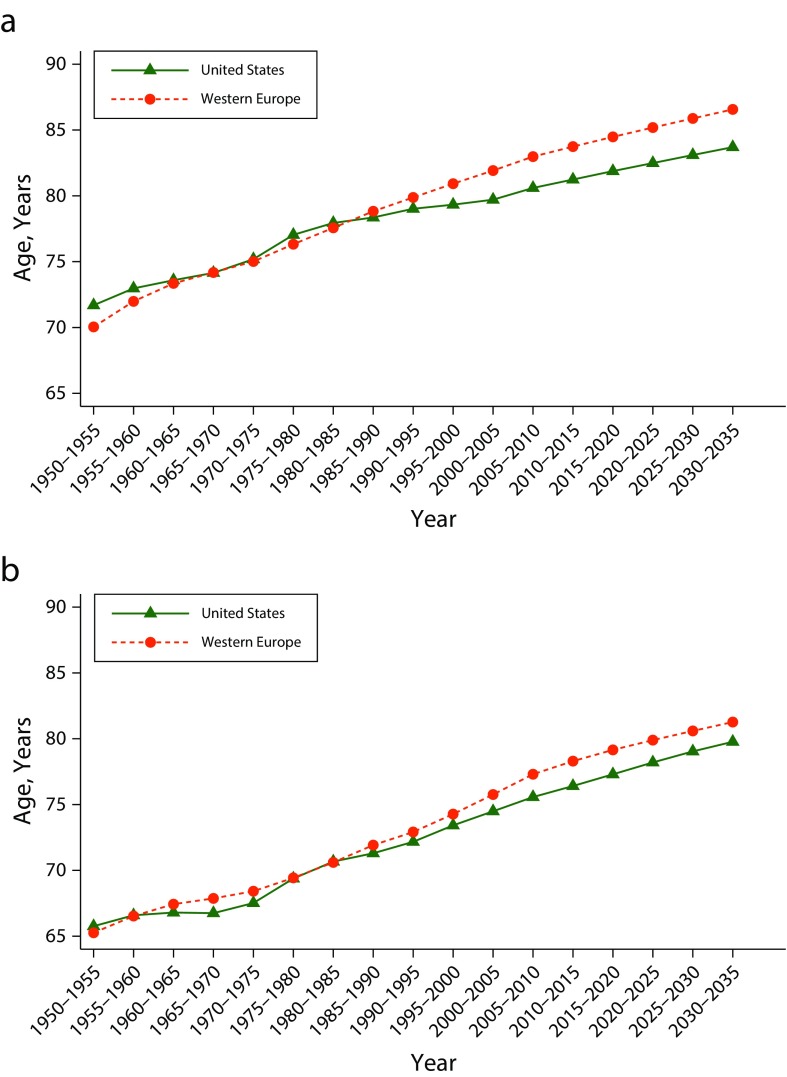
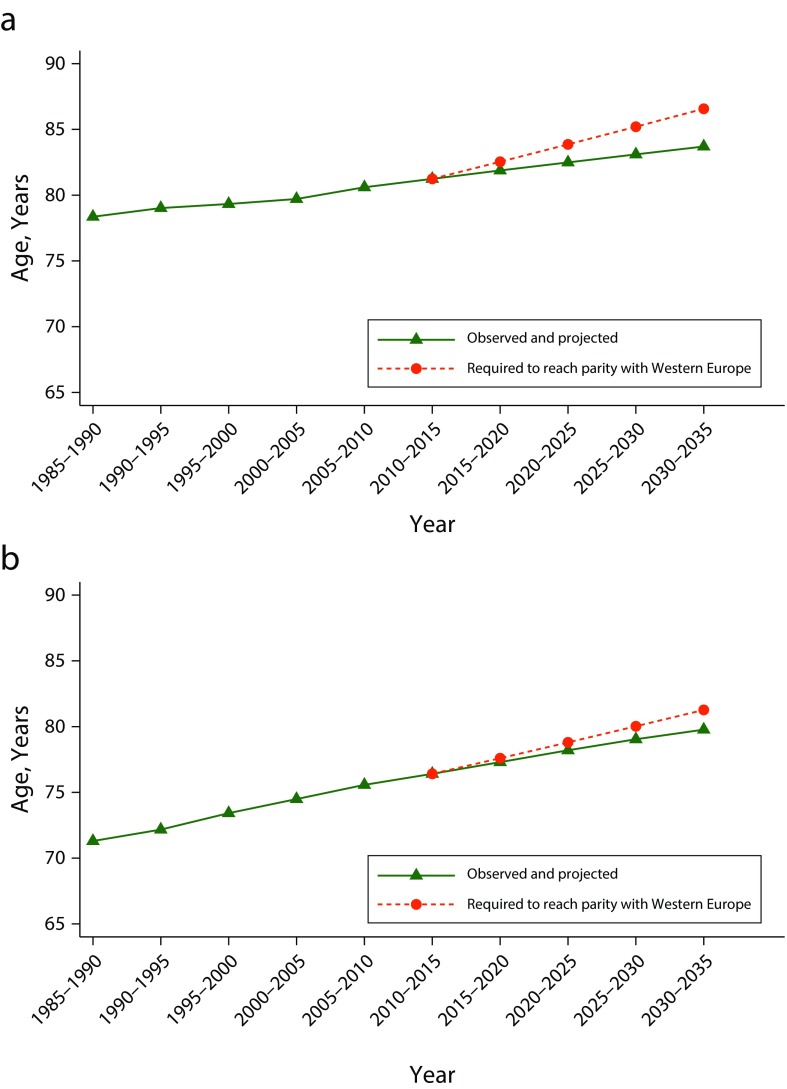
Objectives: To quantify the improvement in US life expectancy required to reach parity with high-resource nations by 2030, to document historical precedent of this rate, and to discuss the plausibility of achieving this rate in the United States.
Methods: We performed a demographic analysis of secondary data in 5-year periods from 1985 to 2015.
Results: To achieve the United Nations projected mortality estimates for Western Europe in 2030, the US life expectancy must grow at 0.32% a year between 2016 and 2030. This rate has precedent, even in low-mortality populations. Over 204 country-periods examined, nearly half exhibited life-expectancy growth greater than 0.32%. Of the 51 US states observed, 8.2% of state-periods demonstrated life-expectancy growth that exceeded the 0.32% target.
Conclusions: Achieving necessary growth in life expectancy over the next 15 years despite historical precedent will be challenging. Much all-cause mortality is structured decades earlier and, at present, older-age mortality reductions in the United States are decelerating. Addressing mortality decline at all ages will require enhanced political will and a strong commitment to equity improvement in the US population.
Figures
Comment in
-
Can Public Health Narrow the Health Gap Between the United States and Its Peer Nations? A Public Health of Consequence, January 2018.Am J Public Health. 2018 Jan;108(1):25-26. doi: 10.2105/AJPH.2017.304173. Am J Public Health. 2018. PMID: 29211529 Free PMC article. No abstract available.
-
Getting to Average Life Expectancy: It Takes Commitment.Am J Public Health. 2018 Jan;108(1):17-18. doi: 10.2105/AJPH.2017.304190. Am J Public Health. 2018. PMID: 29211537 Free PMC article. No abstract available.
References
-
- Institute of Medicine. For the Public’s Health. Investing in a Healthier Future. Washington, DC: The National Academies Press; 2012. - PubMed
-
- National Research Council. International Differences in Mortality at Older Ages: Dimensions and Sources. Washington, DC: The National Academies Press; 2011. - PubMed
-
- United Nations. World Population Prospects. 2012 Edition. Available at: https://esa.un.org/unpd/wpp. Accessed October 21, 2017.
MeSH terms
Grants and funding
LinkOut - more resources
Full Text Sources
Other Literature Sources
