. 2018 Mar 15;197(6):801-813.
doi: 10.1164/rccm.201707-1475OC.

B Cells Producing Type I IFN Modulate Macrophage Polarization in Tuberculosis

Affiliations

B Cells Producing Type I IFN Modulate Macrophage Polarization in Tuberculosis

Alan Bénard et al. Am J Respir Crit Care Med. .

Abstract

Rationale: In addition to their well-known function as antibody-producing cells, B lymphocytes can markedly influence the course of infectious or noninfectious diseases via antibody-independent mechanisms. In tuberculosis (TB), B cells accumulate in lungs, yet their functional contribution to the host response remains poorly understood.

Objectives: To document the role of B cells in TB in an unbiased manner.

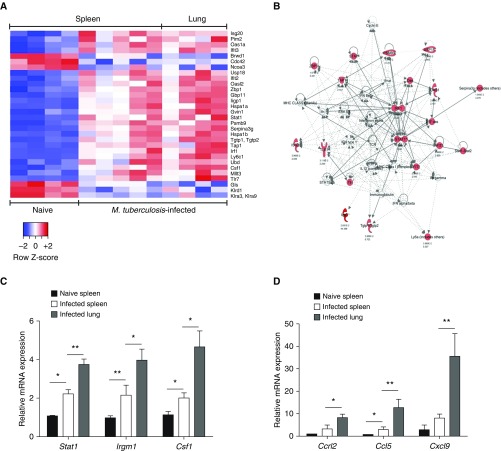
Methods: We generated the transcriptome of B cells isolated from Mycobacterium tuberculosis (Mtb)-infected mice and validated the identified key pathways using in vitro and in vivo assays. The obtained data were substantiated using B cells from pleural effusion of patients with TB.

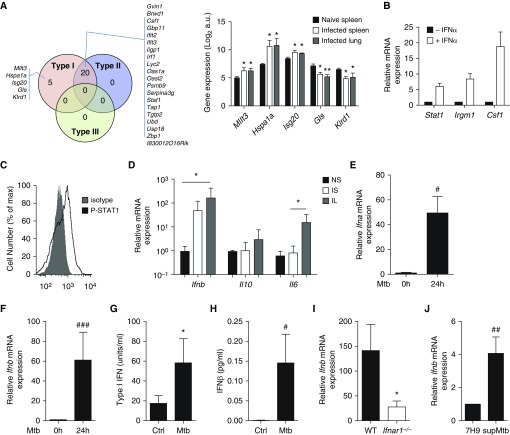
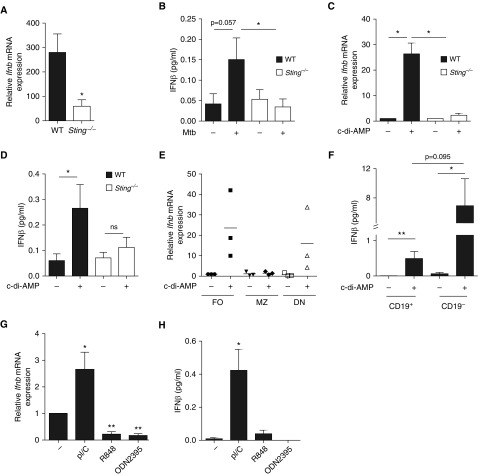
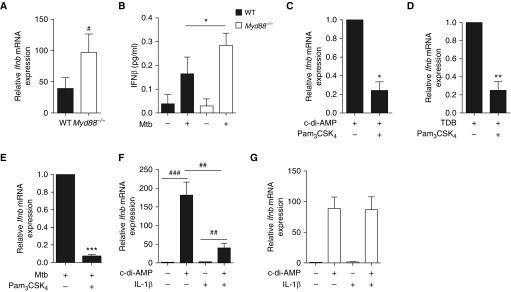
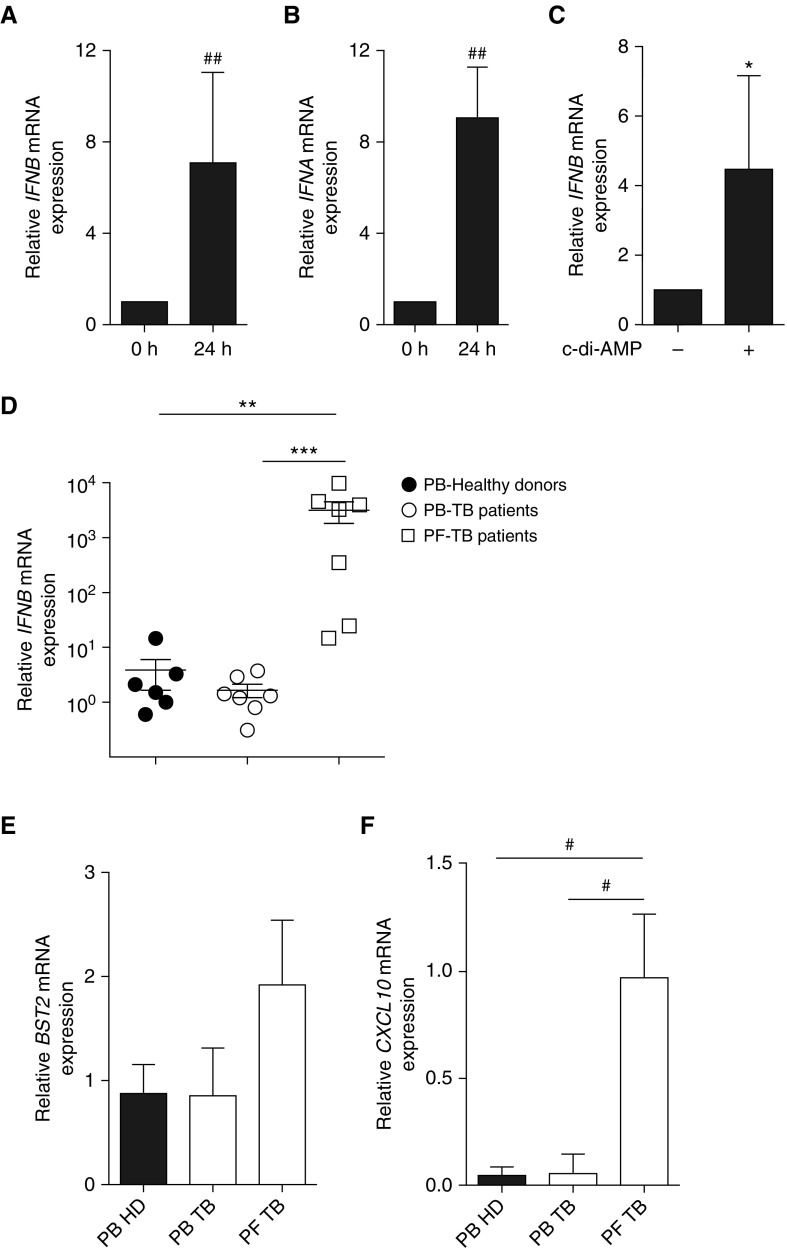
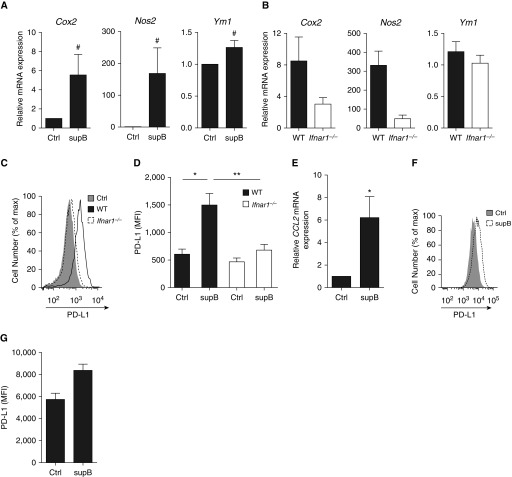
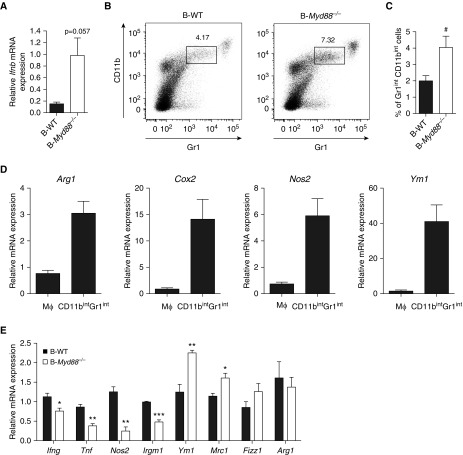
Measurements and main results: B cells isolated from Mtb-infected mice displayed a STAT1 (signal transducer and activator of transcription 1)-centered signature, suggesting a role for IFNs in B-cell response to infection. B cells stimulated in vitro with Mtb produced type I IFN, via a mechanism involving the innate sensor STING (stimulator of interferon genes), and antagonized by MyD88 (myeloid differentiation primary response 88) signaling. In vivo, B cells expressed type I IFN in the lungs of Mtb-infected mice and, of clinical relevance, in pleural fluid from patients with TB. Type I IFN expression by B cells induced an altered polarization of macrophages toward a regulatory/antiinflammatory profile in vitro. In vivo, increased provision of type I IFN by B cells in a murine model of B cell-restricted Myd88 deficiency correlated with an enhanced accumulation of regulatory/antiinflammatory macrophages in Mtb-infected lungs.

Conclusions: Type I IFN produced by Mtb-stimulated B cells favors macrophage polarization toward a regulatory/antiinflammatory phenotype during Mtb infection.

Keywords: B lymphocytes; IFN; macrophages; tuberculosis.


Figures

Figure 1.
Figure 1.
B cells from Mycobacterium tuberculosis (Mtb)-infected mice display a STAT1 signature. (A) Heat map of the differentially expressed genes (selected on the basis of an adjusted P value [Benjamini-Hochberg procedure] < 0.05 and a fold change > 2 or <0.5) both between B cells from the spleen of naive C57BL/6 mice and B cells from the spleen of Mtb-infected mice on the one side, as well as between B cells from the spleen of naive C57BL/6 mice and B cells from the lung of infected mice after 21 days of infection on the other side (we had to pool the B cells from three independent mice to obtain the necessary amount of mRNA to perform microarrays, and four to five independent microarrays were performed for each of the three conditions indicated above). (B) Main network deduced from the Ingenuity Pathway Analysis involved in B cells from Mtb-infected lungs and spleens, as compared with naive spleens. Solid lines and dotted lines indicate direct and indirect interactions, respectively. Differentially expressed genes present in the pathways are represented in red. Light red, 2 < fold change < 10; dark red, fold change > 10. (C) Quantitative reverse transcriptase–polymerase chain reaction analysis of mRNA expression of the Stat1, Irgm1, and Csf1 genes found to be up-regulated in the transcriptome of B cells purified from the spleen of naive mice or from spleen and lung of Mtb-infected C57BL/6 mice. (For each sample, B cells were pooled from three independent mice. Four to five independent infection experiments were performed.) (D) As in C, except that the Ccrl2, Ccl5, and Cxcl9 genes were analyzed. Data represent mean ± SEM and were analyzed by the two-tailed Mann-Whitney test. *P ≤ 0.05; **P ≤ 0.01.
Figure 2.
Figure 2.
B cells from Mycobacterium tuberculosis (Mtb)-infected mice produce and respond to type I IFN. (A) The Venn diagram shows the differentially expressed genes known to be regulated by type I, type II, and/or type III IFN according to Interferome analysis. The histogram on the right indicates the relative expression of the five genes regulated only by type I IFN in B cell samples from naive spleen or Mtb-infected spleen or lungs (microarray data). (B) B cells purified from the spleen of naive C57BL/6 mice were stimulated for 24 hours with IFNα or not, and the mRNA expression of IFN-stimulated genes was analyzed by quantitative reverse transcriptase–polymerase chain reaction (n = 3). (C) Overlay of flow cytometry histograms showing phospho-STAT1 staining in lung B cells from Mtb-infected mice stimulated for 15 minutes with IFNα (n = 3; a representative experiment out of two independent experiments is shown). (D) Expression of Ifnb, Il6, and Il10 in B cells purified from the spleen of naive (NS) or Mtb-infected (IS) C57BL/6 mice and from the lungs of Mtb-infected (IL) C57BL/6 mice after 21 days of infection. (For each sample, B cells were pooled from three independent mice. Four to five independent infection experiments were performed.) (E) Ifna mRNA induction in B cells purified from naive C57BL/6 spleens on in vitro 24-hour stimulation or not with Mtb (multiplicity of infection [MOI] = 0.3); n = 12). (F) As in E, except that Ifnb mRNA induction was measured (n = 12). (G) Activity of type I IFN measured using a reporter assay in the supernatant of naive splenic B cells stimulated or not for 6 days with Mtb (MOI = 0.3; n = 8 independent preparations of B cells per group). (H) Concentrations of IFNβ measured by ELISA in the supernatants of naive splenic B cells stimulated for 6 days or not with Mtb (MOI = 0.3; n = 13 independent preparations of B cells per group). (I) Ifnb mRNA expression in B cells purified from the spleen of WT or Ifnar1−/− mice on in vitro stimulation for 24 hours with Mtb (MOI = 0.3); fold change is relative to respective expression before stimulation (n = 5). (J) Ifnb mRNA expression in B cells purified from the spleen of C57BL/6 mice on in vitro stimulation (supMtb) for 24 hours or not (7H9 medium) with Mtb-culture supernatant (n = 7). Data represent mean ± SEM and were analyzed using the nonparametric two-tailed Mann-Whitney test or the Wilcoxon test (A, B, D, G, and I), *P ≤ 0.05; **P ≤ 0.01. For E, F, H, and J, we used the parametric two-tailed Student paired t-test (#P ≤ 0.05; ##P ≤ 0.01; ###P ≤ 0.001). a.u. = arbitrary units; Ctrl = control; WT = wild type.
Figure 3.
Figure 3.
STING and its ligand trigger type I IFN expression in B cells. (A) Ifnb mRNA expression in B cells purified from the spleen of wild type (WT, solid bars) or Sting−/− (open bars) on stimulation for 24 hours with Mycobacterium tuberculosis (Mtb) (multiplicity of infection = 0.3); fold change represents expression after 24 hours of stimulation relative to respective expression before stimulation (n = 5–10 mice per group). (B) Concentration of IFNβ in the supernatants of naive splenic B cells from WT or Sting−/− mice stimulated for 6 days or not with Mtb (n = 4 per group). (C) Ifnb mRNA expression in B cells purified from the spleen of naive WT (solid bars) or Sting−/− (open bars) mice stimulated (+) or not (−) with c-di-AMP during 24 hours (n = 4 per group). (D) Concentration of IFNβ in the supernatants of naive splenic B cells from WT or Sting−/− mice stimulated for 3 days or not with c-di-AMP (n = 5 per group). (E) Ifnb mRNA expression in CD21lowCD23hi follicular (FO), CD21hiCD23low marginal zone (MZ), and CD21CD23− double-negative (DN) B cells sorted from the spleen of naive C57BL/6 mice on 24-hour stimulation (+) or not (−) with c-di-AMP; fold change is relative to unstimulated follicular B cells (n = 3). Each symbol represents B cells purified from an individual mouse. (F) Concentration of IFNβ in the supernatants of CD19+ and CD19 lung cells purified from Mtb-infected C57BL/6 mice on 24-hour ex vivo stimulation (+) or not (−) with c-di-AMP (for each sample, B cells were pooled from three independent mice, and we performed four to five independent infection experiments). (G) Ifnb mRNA expression in splenic B cells from WT mice stimulated or not with the indicated TLR ligands during 24 hours (n = 4–7). (H) Concentration of IFNβ in the supernatants of splenic B cells from WT mice stimulated or not with the indicated TLR ligands during 3 days (n = 4 per group). Data represent mean ± SEM and were analyzed using the two-tailed (A, C, E, F, G, and H) or one-tailed (B and D) Mann-Whitney test. *P ≤ 0.05; **P ≤ 0.01. One-tailed Mann-Whitney was used in B and D, because protein expression is expected to positively correlate with mRNA expression. ns = not significant; TLR = Toll-like receptor.
Figure 4.
Figure 4.
MyD88 signaling negatively regulates type I IFN expression in B cells. (A) Ifnb mRNA expression in B cells purified from the spleen of Myd88−/− (open bars) and wild type (WT, solid bars) control mice on stimulation for 24 hours with Mycobacterium tuberculosis (Mtb) (multiplicity of infection = 0.3); fold change represents expression after stimulation relative to respective expression before stimulation (set to 1) (n = 10 mice per group). (B) Concentration of IFNβ in the supernatants of naive splenic B cells from WT or Myd88−/− mice stimulated for 6 days or not with Mtb (n = 3). (CE) Ifnb mRNA expression in B cells purified from the spleen of WT mice (n = 4–8 mice per group) on 24-hour in vitro stimulation with either c-di-AMP (C), TDB (D) or Mtb (E) in the presence (+) or absence (−) of the TLR2 agonist Pam3CSK4. (F) B cells from WT mice were stimulated with c-di-AMP and/or IL1β, then IFNβ expression was analyzed at the mRNA level (n = 6). (G) As in F, except that Myd88−/− B cells were used (n = 4). Data represent mean ± SEM and were analyzed by using the two-tailed Mann-Whitney test or the two-tailed Wilcoxon test (BE) (*P ≤ 0.05; **P ≤ 0.01; ***P ≤ 0.001). The two-tailed Student paired t test was used for A and F (#P ≤ 0.05; ##P ≤ 0.01; ###P ≤ 0.001). TDB = trehalose-6,6-dibehenate.
Figure 5.
Figure 5.
Expression of IFNβ in blood B cells from healthy donors after Mycobacterium tuberculosis (Mtb) stimulation and in pleural B cells of patients with tuberculosis (TB). (A) Induction of IFNB mRNA expression in peripheral blood (PB) B cells of healthy donors stimulated or not for 24 hours with Mtb (multiplicity of infection = 0.3; n = 8). (B) IFNA mRNA expression in B cells purified from peripheral blood mononuclear cells of healthy donor as in A (n = 8). (C) IFNB mRNA expression in B cells purified from the blood of healthy donors stimulated (+) or not (−) with c-di-AMP for 24 hours (n = 4 per group). (DF) mRNA expression of IFNB (D), BST2 (E), and CXCL10 (F) in B cells from peripheral blood of healthy donors, patients with TB, and in B cells from pleural fluid (PF) of patients with TB. Each symbol represents an independent donor (n = 6–7 individuals per group). The expression level was arbitrarily set to 1 for one sample from the peripheral blood of healthy donors group, and the values for the other samples were calculated relative to this reference. Data represent mean ± SEM and were analyzed using the two-tailed Mann-Whitney test or the two-tailed Wilcoxon test (*P ≤ 0.05; **P ≤ 0.01; ***P ≤ 0.001) except for panels A, B, and F, where a two-tailed Student paired t-test was used (#P ≤ 0.05; ##P ≤ 0.01). HD = healthy donor.
Figure 6.
Figure 6.
IFNβ production by B cells polarizes macrophages in vitro toward an antiinflammatory phenotype. (A) Cox2, Nos2, and Ym1 mRNA expression in wild type (WT) macrophages first conditioned or not with supernatant of Mycobacterium tuberculosis (Mtb)-stimulated B cells and then infected with Mtb (multiplicity of infection [MOI] = 0.5; n = 6–7). (B) Same as in A, but in WT or Ifnar1−/− macrophages (MOI = 0.5; n = 4). (C) Overlay of flow cytometry histograms and (D) mean fluorescence intensity (MFI) of PD-L1 surface expression on macrophages from the bone marrow of naive WT or Ifnar1−/− mice and incubated (supB) or not (Ctrl) for 24 hours with supernatants of Mtb-stimulated B cells (n = 4 independent preparations of B cells per group). (E) CCL2 mRNA expression in human monocyte-derived macrophages incubated with supernatants of human B cells stimulated or not with Mtb (n = 4). (F) Overlay of flow cytometry histograms and cumulative geometric MFI representing PD-L1 surface expression on macrophages incubated with supernatants of B cells stimulated or not with Mtb (n = 4). Results were analyzed using the two-tailed Mann-Whitney test or the two-tailed Wilcoxon test (*P ≤ 0.05; **P ≤ 0.01) except for A, where a two-tailed Student paired t-test was used (#P ≤ 0.05).
Figure 7.
Figure 7.
Excessive production of type I IFN by B cells is associated with altered macrophage polarization and reduced inflammation in the lungs of Mycobacterium tuberculosis (Mtb)-infected mice. Mixed bone marrow chimeras were generated, in which B cells were competent (B-WT, i.e., 80% μMT + 20% wild type [WT]→ WT, solid bars) or deficient (B-Myd88−/−, i.e., 80% μMT + 20% Myd88−/− →WT, open bars) for Myd88. B-CTRL mice (80% WT + 20% MyD88−/−→WT) lacking Myd88 expression on 20% total hematopoietic cells were also used as control. These mice were infected with 1,000 cfu Mtb, H37Rv strain and their lungs analyzed 6 weeks later. (A) Ifnb mRNA expression in B cells purified from the lungs of Mtb-infected B-WT and B-Myd88−/− mice (for each sample, B cells were pooled from three independent mice, and we performed firve independent infection experiments). The expression level was arbitrarily set to 1 for one sample from the B-Myd88−/− group, and the values for the other samples were calculated relative to this reference. (B) Representative dot plot of CD11b versus Gr-1 staining in the lungs of B-WT or and B-Myd88−/− mice infected for 42 days with Mtb. The gates indicate the percentage of CD11bintGr-1int cells among total lung cells. One representative experiment out of two independent experiments is shown. (C) Percentage of Gr1intCD11bint cells in the lung of B-WT or B-Myd88−/− mice (n = 7). (D) CD11b+Gr1 (Mϕ) and CD11bintGr1int cells were sorted by fluorescence-activated cell sorter from the lungs of C57BL/6 mice infected with Mtb for 42 days and then analyzed for the expression of the indicated genes (n = 5). (E) mRNA expression of proinflammatory cytokines and antiinflammatory genes in the lung of B-WT and B-Myd88−/− mice (n = 3). Data represent mean ± SEM, are representative of two independent experiments, and were analyzed using the two-tailed Mann-Whitney test. *P ≤ 0.05; **P ≤ 0.01; ***P ≤ 0.001 except for C, where a two-tailed Student paired t-test was used (#P ≤ 0.05). cfu = colony-forming units; CTRL = control.

Comment in

References

    1. Kahnert A, Höpken UE, Stein M, Bandermann S, Lipp M, Kaufmann SH. Mycobacterium tuberculosis triggers formation of lymphoid structure in murine lungs. J Infect Dis. 2007;195:46–54. - PubMed
    1. Maglione PJ, Xu J, Chan J. B cells moderate inflammatory progression and enhance bacterial containment upon pulmonary challenge with Mycobacterium tuberculosis. J Immunol. 2007;178:7222–7234. - PubMed
    1. Tsai MC, Chakravarty S, Zhu G, Xu J, Tanaka K, Koch C, et al. Characterization of the tuberculous granuloma in murine and human lungs: cellular composition and relative tissue oxygen tension. Cell Microbiol. 2006;8:218–232. - PubMed
    1. Ulrichs T, Kosmiadi GA, Trusov V, Jörg S, Pradl L, Titukhina M, et al. Human tuberculous granulomas induce peripheral lymphoid follicle-like structures to orchestrate local host defence in the lung. J Pathol. 2004;204:217–228. - PubMed
    1. Chan J, Mehta S, Bharrhan S, Chen Y, Achkar JM, Casadevall A, et al. The role of B cells and humoral immunity in Mycobacterium tuberculosis infection. Semin Immunol. 2014;26:588–600. - PMC - PubMed

Publication types

Substances