. 2017 Nov-Dec;52(6):789-804.
doi: 10.1080/00273171.2017.1373014.

Network Mapping with GIMME

Affiliations

Network Mapping with GIMME

Adriene M Beltz et al. Multivariate Behav Res. 2017 Nov-Dec.

Abstract

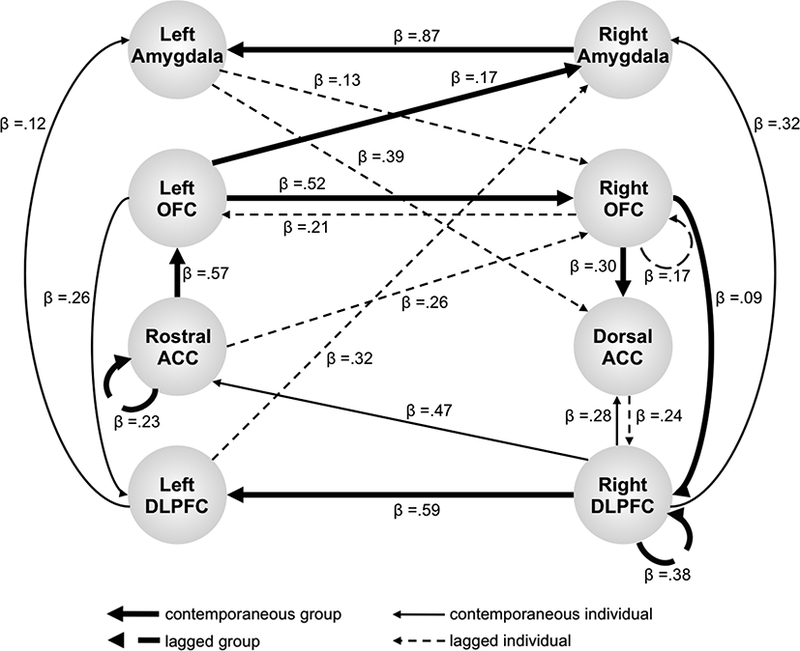
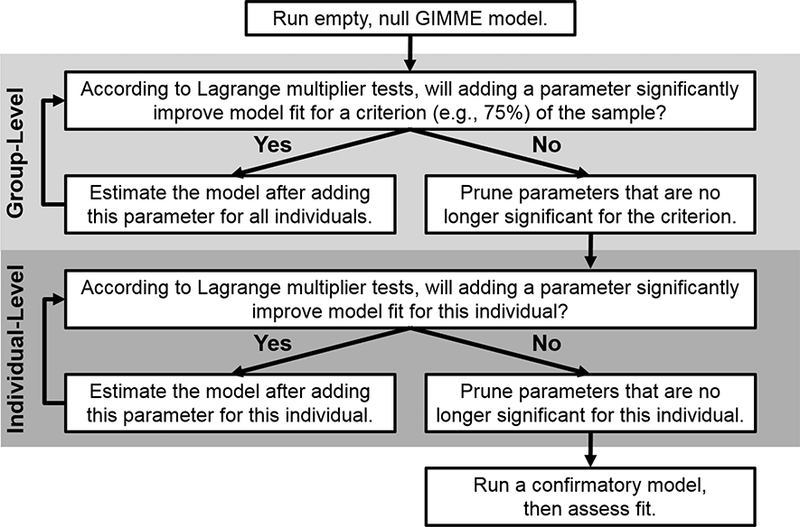
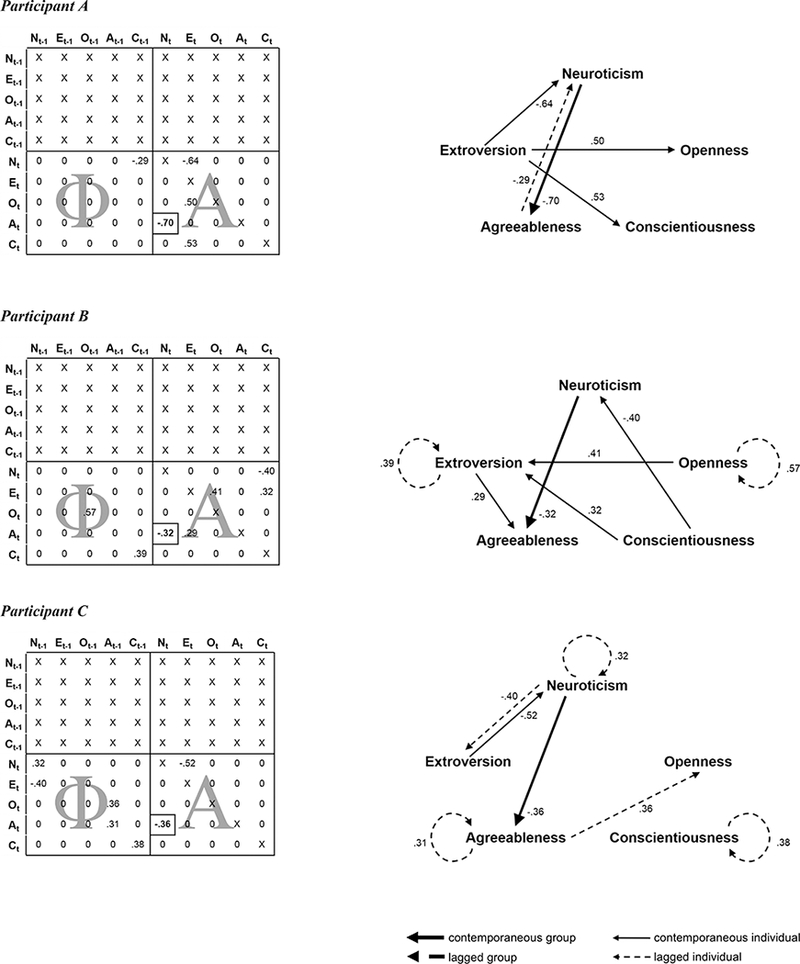
Network science is booming! While the insights and images afforded by network mapping techniques are compelling, implementing the techniques is often daunting to researchers. Thus, the aim of this tutorial is to facilitate implementation in the context of GIMME, or group iterative multiple model estimation. GIMME is an automated network analysis approach for intensive longitudinal data. It creates person-specific networks that explain how variables are related in a system. The relations can signify current or future prediction that is common across people or applicable only to an individual. The tutorial begins with conceptual and mathematical descriptions of GIMME. It proceeds with a practical discussion of analysis steps, including data acquisition, preprocessing, program operation, a posteriori testing of model assumptions, and interpretation of results; throughout, a small empirical data set is analyzed to showcase the GIMME analysis pipeline. The tutorial closes with a brief overview of extensions to GIMME that may interest researchers whose questions and data sets have certain features. By the end of the tutorial, researchers will be equipped to begin analyzing the temporal dynamics of their heterogeneous time series data with GIMME.

Keywords: Connectivity; idiographic vs. nomothetic methods; intensive longitudinal data; time series analysis; unified structural equation modeling.


Figures

Figure 1.
Figure 1.
GIMME neural network for a single participant completing a go/no-go task in which images of alcoholic beverages were the response cues (Beltz, Gates, et al., 2013). Data are from the first wave (i.e., summer before college) of a longitudinal fMRI study of neural responses to alcohol during the college transition, and the network fit these data well according to alternative fit indices (CFI = 1.00, NNFI = 1.00, RMSEA = .000, SRMR = .050). Thick lines are group-level edges estimated for all participants (in the first wave of the study), thin lines are individual-level edges estimated for this participant, solid lines are contemporaneous edges, dashed lines are lagged edges, and edge magnitude is shown by β weights. See text for description of fit indices. OFC: orbitofrontal cortex; ACC: anterior cingulate cortex; DLPFC: dorsolateral prefrontal cortex. (Reproduced with permission from Elsevier from Beltz, Gates, et al., 2013.)
Figure 2.
Figure 2.
Schematic showing the model fitting steps employed within GIMME (Gates & Molenaar, 2012). Note that the “null” model can be empty or have specified group-level contemporaneous or lagged connections (e.g., the autoregressive effects). Lagrange Multiplier tests (i.e., modification indices) are used to identify optimal parameters (i.e., contemporaneous or lagged edges in the Ai, Aig, Φ1,i, and Φ1,ig matrices of equation 1, respectively) to add to the model structure (i.e., network). Models are assessed with alternative fit indices, such as the comparative fit index, non-normed fit index, root mean squared residual, and standardized root mean squared error. (Reproduced with permission from Elsevier from Gates & Molenaar, 2012.)
Figure 3.
Figure 3.
Preprocessing results for three exemplar participants illustrating the GIMME work flow. On the left, composite scores from each of the five personality factors are plotted by diary day. Transparent gray bars indicate days with missing data, imputed with the individual’s local average, and thin lines indicate personality factors with significant linear trends (at p < .05). On the right, standardized residuals from the linear regression of time on personality factor plotted by day. These residuals remove the linear trends from the data, and were subsequently entered into GIMME.
Figure 4.
Figure 4.
GIMME behavioral network results for three exemplar participants illustrating the GIMME workflow; these are the same participants whose time series are plotted in Figure 3. On the left are output matrices for each participant, modified for illustration purposes. Beta weights show the direction and magnitude of estimated connections, 0’s indicate connections that could have been estimated but were not (e.g., because they did not significantly improve model fit), X’s indicate parameters that were fixed at 0, and thus, could not have been estimated, and the boxed estimate indicates the single group-level connection. The matrices are read with the nodes in the rows being explained at time t by either lagged (t – 1 edges in the Φ matrix) or contemporaneous (t edges in the A matrix) connections with the nodes in the columns. On the right are the network depictions of the results. Contemporaneous connections are shown by directed solid arrows, lagged connections are shown by directed dashed arrows, the single group-level connection is shown by a thick line, and the individual-level connections are shown by thin lines. Beta weights are shown for all connections. N: neuroticism; E: extroversion; O: openness; A: agreeableness; C: conscientiousness.

References

    1. Bajardi P, Poletto C, Ramasco JJ, Tizzoni M, Colizza V, & Vespignani A (2011). Human mobility networks, travel restrictions, and the global spread of 2009 H1N1 pandemic. PLoS One, 6(1), article e16591. doi:10.1371/journal.pone.0016591 - DOI - PMC - PubMed
    1. Beltz AM, Beekman C, Molenaar PCM, & Buss KA (2013). Mapping temporal dynamics in social interactions with unified structural equation modeling: A description and demonstration revealing time-dependent sex differences in play behavior. Applied Developmental Science, 17(3), 152–168. doi:10.1080/10888691.2013.805953 - DOI - PMC - PubMed
    1. Beltz AM, Gates KM, Engels AS, Molenaar PCM, Pulido C, Turrisi R, . . . Wilson SJ (2013). Changes in alcohol-related brain networks across the first year of college: A prospective pilot study using fMRI effective connectivity mapping. Addictive Behaviors, 38(4), 2052–2059. doi:10.1016/j.addbeh.2012.12.023 - DOI - PMC - PubMed
    1. Beltz AM, & Molenaar PCM (2015). A posteriori model validation for the temporal order of directed functional connectivity maps. Frontiers in Neuroscience, 9, article 304. doi:10.3389/fnins.2015.00304 - DOI - PMC - PubMed
    1. Beltz AM, & Molenaar PCM (2016). Dealing with multiple solutions in structural vector autoregressive models. Multivariate Behavioral Research, 51(2–3), 357–373. doi:10.1080/00273171.2016.1151333 - DOI - PubMed

LinkOut - more resources