. 2018 Feb 20;118(4):546-557.
doi: 10.1038/bjc.2017.411. Epub 2017 Nov 21.

Cadherin-1 and cadherin-3 cooperation determines the aggressiveness of pancreatic ductal adenocarcinoma

Affiliations

Cadherin-1 and cadherin-3 cooperation determines the aggressiveness of pancreatic ductal adenocarcinoma

Carole Siret et al. Br J Cancer. .

Abstract

Background: Pancreatic ductal adenocarcinoma (PDAC) is characterised by an extensive tissue invasion and an early formation of metastasis. Alterations in the expression of cadherins have been reported in PDAC. Yet, how these changes contribute to tumour progression is poorly understood. Here, we investigated the relationship between cadherins expression and PDAC development.

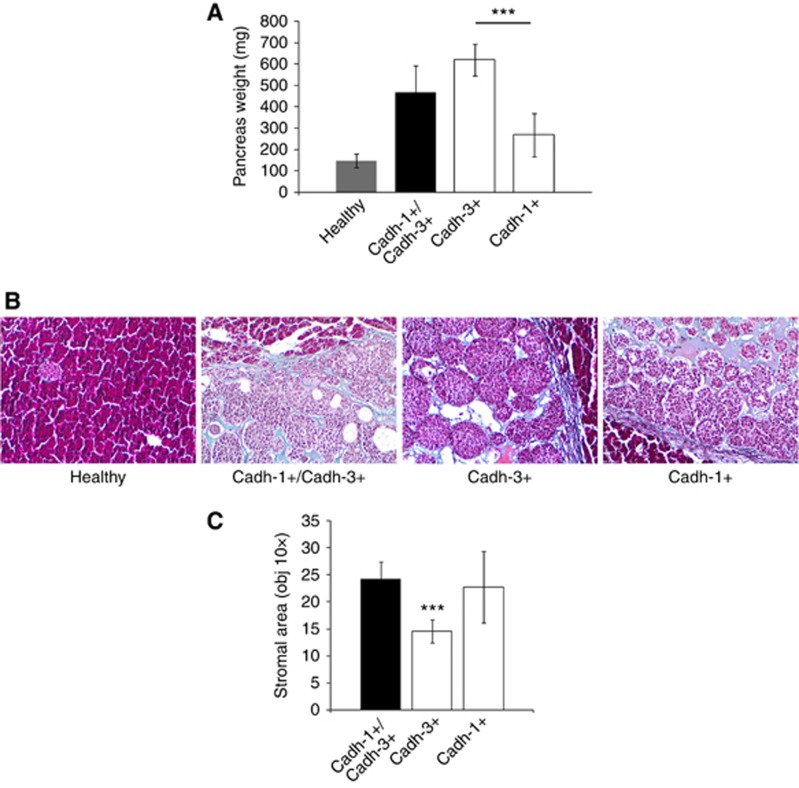
Methods: Cadherins expression was assessed by immunostaining in both human and murine tissue specimens. We have generated pancreatic cancer cell lines expressing both cadherin-1 and cadherin-3 or only one of these cadherins. Functional implications of such genetic alterations were analysed both in vitro and in vivo.

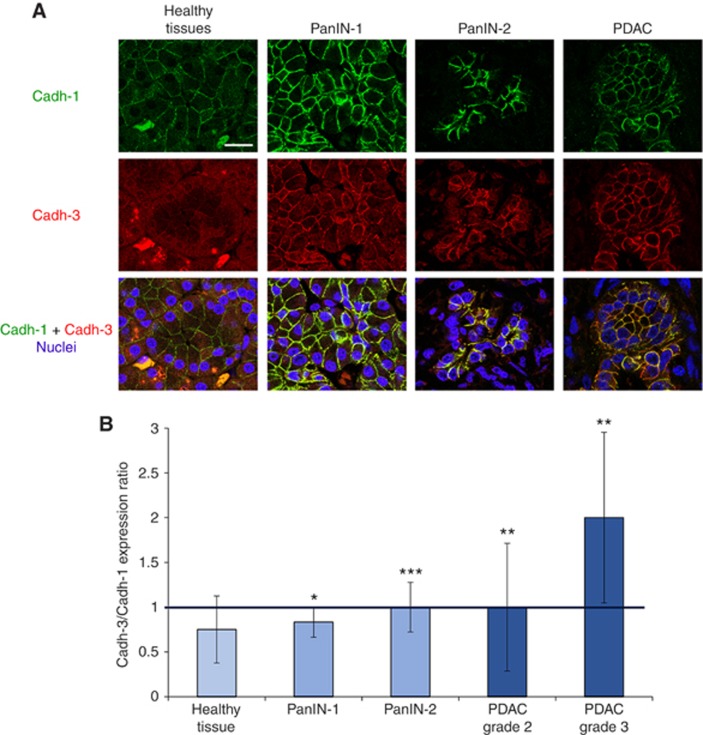
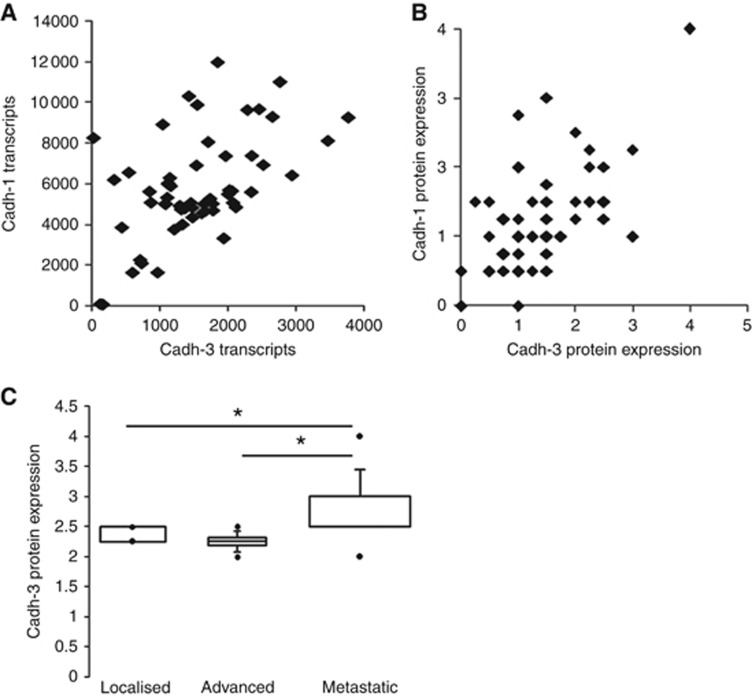
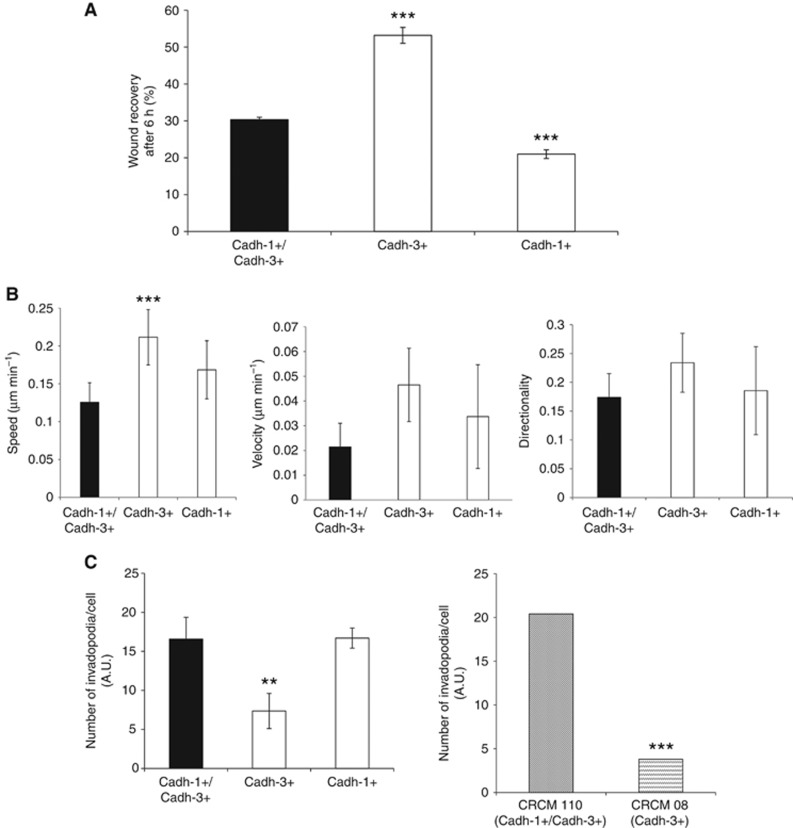
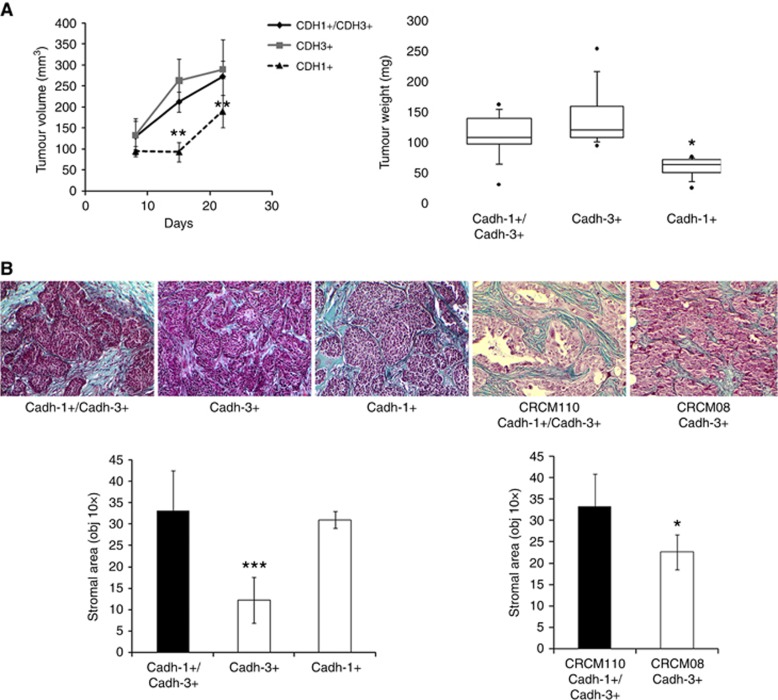
Results: Cadherin-3 is detected early at the plasma membrane during progression of pancreatic intraepithelial neoplasia 1 (PanIN-1) to PDAC. Despite tumoural cells turn on cadherin-3, a significant amount of cadherin-1 remains expressed at the cell surface during tumourigenesis. We found that cadherin-3 regulates tumour growth, while cadherin-1 drives type I collagen organisation in the tumour. In vitro assays showed that cadherins differentially participate to PDAC aggressiveness. Cadherin-3 regulates cell migration, whereas cadherin-1 takes part in the invadopodia activity.

Conclusions: Our results show differential, but complementary, roles for cadherins during PDAC carcinogenesis and illustrate how their expression conditions the PDAC aggressiveness.


Conflict of interest statement

The authors declare no conflict of interest.

Figures

Figure 1
Figure 1
Cadherin-1 and cadherin-3 expression during PDAC progression. (A) Sections of human pancreatic tissue samples were sequentially stained with mouse anti-cadherin-1 and rabbit anti-cadherin-3 Abs. Tissues were then incubated with Alexa 488-conjugated goat anti-mouse and Alexa 594-conjugated Abs and were observed with a confocal microscope. Cell nuclei were stained with Draq5. Scale bar: 25 μm. (B) Pancreas adenocarcinoma and pancreatic intraepithelial neoplasia (PanIN) tissue microarrays, as well as cancer tissue array were immunostained and observed as described in (A). Cadherin-1 and cadherin-3 staining were scored as described in Materials and Methods. Results are expressed as cadherin-3 vs cadherin-1 expression ratio. *P<0.05, **P<0.01, ***P<0.001.
Figure 2
Figure 2
Cadherin-1 and -3 expressions in PDAC samples from xenografted tumours. (A) Both cadherins were quantified at the transcriptional level by using gene expression microarrays from xenografted tumours from 55 patients. (B) Cadherin-1 and cadherin-3 were immunodetected on a tissue array containing PDAC samples from xenografted tumours. Cadherin staining was scored as described in Materials and Methods. (C) Box plot represents cadherin-3 protein expression in PDAC samples from xenografted tumours issued primary tumours or from metastasis. *P<0.05.
Figure 3
Figure 3
Cadherin expression in BxPC-3 cell models and in primary cultures from human tumours. (A) Cadherin-1 or cadherin-3 expression was invalidated in BxPC-3 human pancreatic cancer cell line. Generated stable cell lines were called BxPC-3-cadh-1+ /cadh-3+ (no cadherin depletion), BxPC-3-cadh-1+ (cadherin-3 depletion) and BxPC-3-cadh-3+ (cadherin-1 depletion). Cadherin-1 and cadherin-3 expression was assessed by immunofluorescence. Scale bar: 15 μm. (B) Cadherin-1 and cadherin-3 were sequentially immunostained in CRCM110 and CRCM08 primary cell cultures derived from human tumours. Scale bar: 15 μm.
Figure 4
Figure 4
Both cadherin-1 and cadherin-3 regulate cancer cell invasion. (A) The impact of cadherins expression on cell–cell adhesion properties was assessed by a spheroid formation assay. BxPC-3-cadh-1+/cadh-3+ (no cadherin depletion), BxPC-3-cadh1+ (cadherin-3 depletion) BxPC-3-cadh-3+ (cadherin-1 depletion) cells, as well as primary cultures from human tumours CRCM110 and CRCM08 were allowed to form spheroids in suspension for 24 h. The spheroid area was measured by phase contrast microscopy and analysed by ImageJ. Data represent the mean±s.d. of three separate experiments performed in triplicates. (B) BxPC-3 cell models were allowed to form spheroids for 72 h. Spheroids were then embedded in type I collagen. After the embedding followed by a 24 h incubation period, the spheroid area was measured by phase contrast microscopy and analysed by ImageJ. Data represent the mean±s.d. of three independent experiments performed in triplicates. (C) Isolated BxPC-3 cells and primary cultures from human tumours CRCM110 and CRCM08 were allowed to invade a layer of type I collagen for 24 h. The invasion index was calculated as the mean number of migrated cells counted in 10 microscopic fields. Data represent the mean±s.d. of three independent experiments performed in triplicates. **P<0.01, ***P<0.001.
Figure 5
Figure 5
Cadherin-3 drives migration of pancreatic tumour cells, whereas cadherin-1 is involved in invadopodia formation. (A) BxPC-3 cell monolayers were wounded and incubated in culture medium. Results are expressed as the percentage of wound area closure which was determined after 6 h of incubation. Data represent the mean±s.d. of three independent experiments performed in triplicates. (B) Isolated BxPC-3 cells were plated onto type I collagen. For 6 h the single cell trajectories were analysed by videomicroscopy by capturing images every 5 min. Different parameters such as the speed, the velocity and the directionality were analysed from the cell tracks obtained using ImageJ software. (C) Isolated BxPC-3 cells and primary cultures from human tumours were plated for 16 h on FITC-conjugated gelatin. The areas of degraded matrix were observed with confocal microscope. ImageJ software was used to evaluate the number of invadopodia per cell. Data represent the mean±s.d. of three independent experiments performed in triplicates. **P<0.01, ***P<0.001.
Figure 6
Figure 6
Effects of cadherin-1 and cadherin-3 silencing on tumour growth and ECM deposition. (A) Different BxPC3 cells lines were injected into the flank of nude mice. For 21 days, mice were monitored weekly for tumour growth (n=6 for each condition). Box plot represents tumour weight 3 weeks after cell inoculation. (B) Tumours were fixed, embedded in paraffin, cut into 4 μm sections, and submitted to Masson’s trichrome staining to distinguish collagen (in blue) from other tissue structures. The stromal area of each tumour was measured by microscopy (× 10 objective) and analysed by ImageJ. *P<0.05, **P<0.01, ***P<0.001.
Figure 7
Figure 7
Cadherins alter ECM deposition. Mice were orthotopically implanted with either BxPC-3-cadh-1+/cadh-3+, BxPC-3-cadh1+ or BxPC-3-cadh-3+ cells resuspended in Matrigel or with Matrigel alone (n=3 for each condition). (A) Mice were sacrificed 21 days after injection, pancreas were collected and the weight was measured. (B) Sections of graft tissue specimens were subjected to Masson’s trichrome staining. (C) The stromal area of each tumour was measured by microscopy (10 × objective) and analysed by ImageJ. ***P<0.001.

References

    1. Al-Aynati MM, Radulovich N, Riddell RH, Tsao MS (2004) Epithelial-cadherin and beta-catenin expression changes in pancreatic intraepithelial neoplasia. Clin Cancer Res 10(4): 1235–1240. - PubMed
    1. Bailey P, Chang DK, Nones K, Johns AL, Patch AM, Gingras MC, Miller DK, Christ AN, Bruxner TJ, Quinn MC, Nourse C, Murtaugh LC, Harliwong I, Idrisoglu S, Manning S, Nourbakhsh E, Wani S, Fink L, Holmes O, Chin V, Anderson MJ, Kazakoff S, Leonard C, Newell F, Waddell N, Wood S, Xu Q, Wilson PJ, Cloonan N, Kassahn KS, Taylor D, Quek K, Robertson A, Pantano L, Mincarelli L, Sanchez LN, Evers L, Wu J, Pinese M, Cowley MJ, Jones MD, Colvin EK, Nagrial AM, Humphrey ES, Chantrill LA, Mawson A, Humphris J, Chou A, Pajic M, Scarlett CJ, Pinho AV, Giry-Laterriere M, Rooman I, Samra JS, Kench JG, Lovell JA, Merrett ND, Toon CW, Epari K, Nguyen NQ, Barbour A, Zeps N, Moran-Jones K, Jamieson NB, Graham JS, Duthie F, Oien K, Hair J, Grützmann R, Maitra A, Iacobuzio-Donahue CA, Wolfgang CL, Morgan RA, Lawlor RT, Corbo V, Bassi C, Rusev B, Capelli P, Salvia R, Tortora G, Mukhopadhyay D, Petersen GM, Munzy DM, Fisher WE, Karim SA, Eshleman JR, Hruban RH, Pilarsky C, Morton JP, Sansom OJ, Scarpa A, Musgrove EA, Bailey UM, Hofmann O, Sutherland RL, Wheeler DA, Gill AJ, Gibbs RA, Pearson JV, Biankin AV, Grimmond SM Initiative APCG (2016) Genomic analyses identify molecular subtypes of pancreatic cancer. Nature 531(7592): 47–52. - PubMed
    1. Bauer R, Valletta D, Bauer K, Thasler WE, Hartmann A, Müller M, Reichert TE, Hellerbrand C (2014) Downregulation of P-cadherin expression in hepatocellular carcinoma induces tumourigenicity. Int J Clin Exp Pathol 7(9): 6125–6132. - PMC - PubMed
    1. Castro-Castro A, Marchesin V, Monteiro P, Lodillinsky C, Rossé C, Chavrier P (2016) Cellular and molecular mechanisms of MT1-MMP-dependent cancer cell invasion. Annu Rev Cell Dev Biol 32: 555–576. - PubMed
    1. Chai MG, Kim-Fuchs C, Angst E, Sloan EK (2013) Bioluminescent orthotopic model of pancreatic cancer progression. J Vis Exp (76). - PMC - PubMed

Publication types