. 2017 Nov 21;12(11):e0188302.
doi: 10.1371/journal.pone.0188302. eCollection 2017.

In-vivo effects of intraocular and intracranial pressures on the lamina cribrosa microstructure

Affiliations

In-vivo effects of intraocular and intracranial pressures on the lamina cribrosa microstructure

Bo Wang et al. PLoS One. .

Abstract

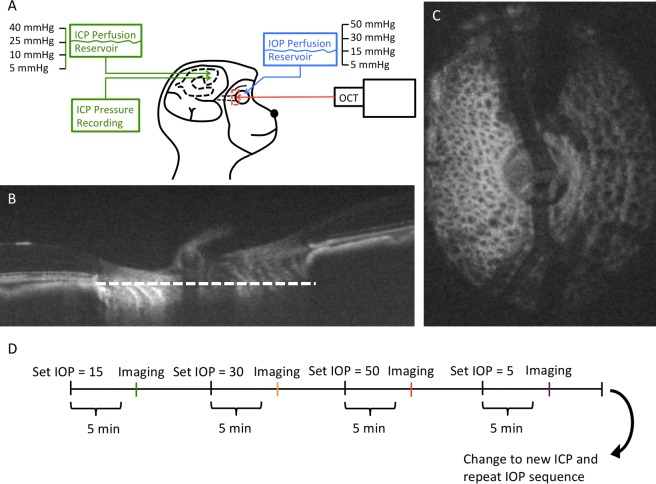
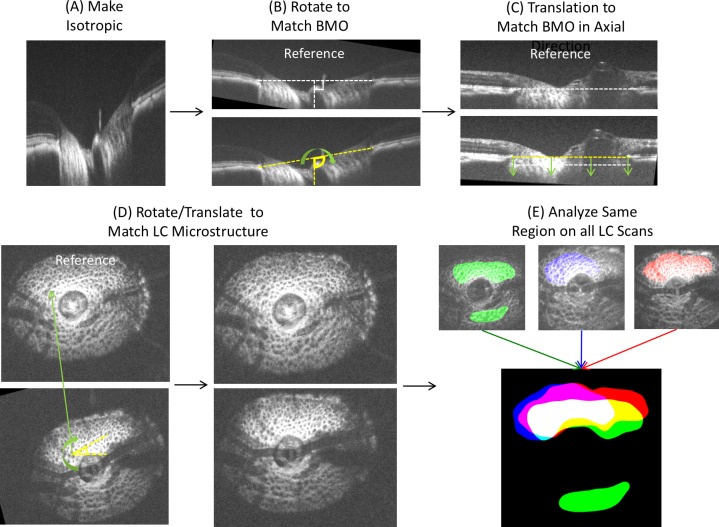
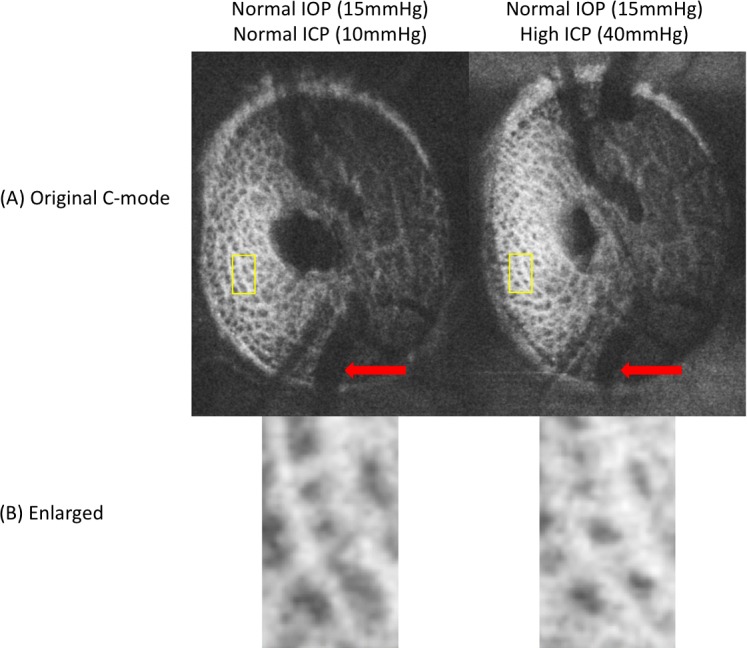
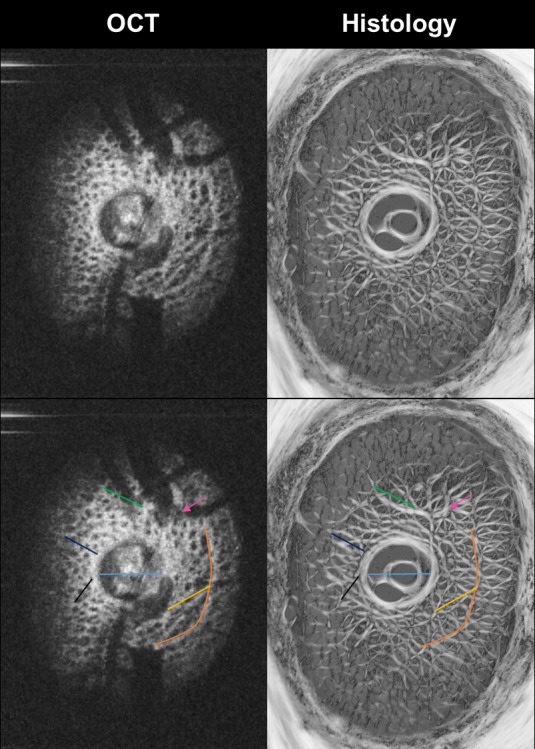
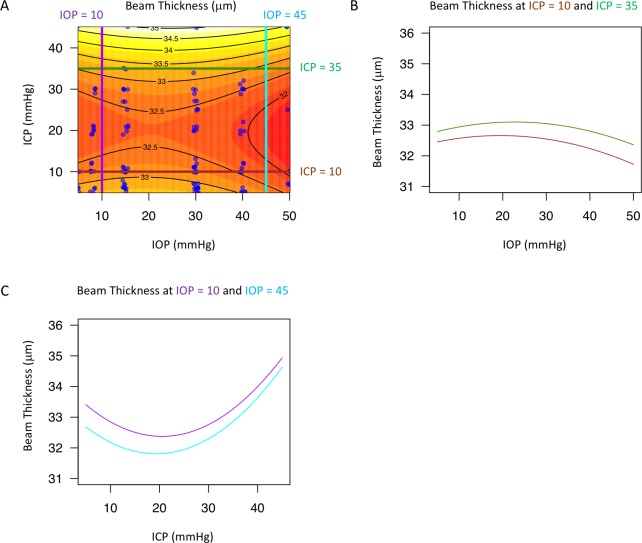
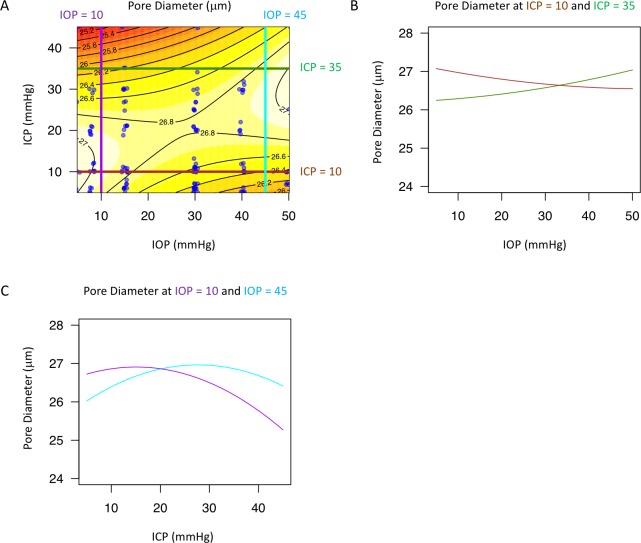
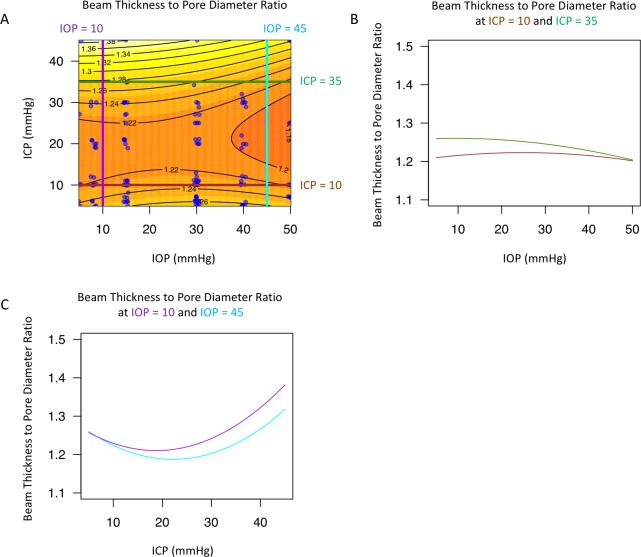
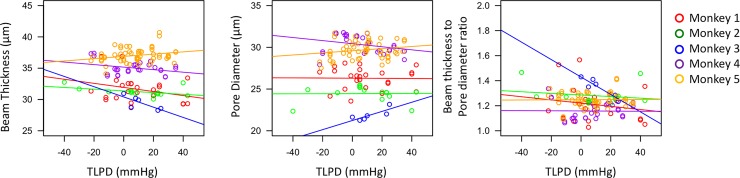
There is increasing clinical evidence that the eye is not only affected by intraocular pressure (IOP), but also by intracranial pressure (ICP). Both pressures meet at the optic nerve head of the eye, specifically the lamina cribrosa (LC). The LC is a collagenous meshwork through which all retinal ganglion cell axons pass on their way to the brain. Distortion of the LC causes a biological cascade leading to neuropathy and impaired vision in situations such as glaucoma and idiopathic intracranial hypertension. While the effect of IOP on the LC has been studied extensively, the coupled effects of IOP and ICP on the LC remain poorly understood. We investigated in-vivo the effects of IOP and ICP, controlled via cannulation of the eye and lateral ventricle in the brain, on the LC microstructure of anesthetized rhesus monkeys eyes using the Bioptigen spectral-domain optical coherence tomography (OCT) device (Research Triangle, NC). The animals were imaged with their head upright and the rest of their body lying prone on a surgical table. The LC was imaged at a variety of IOP/ICP combinations, and microstructural parameters, such as the thickness of the LC collagenous beams and diameter of the pores were analyzed. LC microstructure was confirmed by histology. We determined that LC microstructure deformed in response to both IOP and ICP changes, with significant interaction between the two. These findings emphasize the importance of considering both IOP and ICP when assessing optic nerve health.


Conflict of interest statement

Competing Interests: Dr. Schuman receives royalties for intellectual property licensed 30 by Massachusetts Institute of Technology to Zeiss. This does not alter our adherence to PLOS ONE policies on sharing data and materials.

Figures

Fig 1
Fig 1
(A) Diagram of the experimental setup. Intraocular pressure (IOP) and intracranial pressure (ICP) were controlled using a gravity-based perfusion system. OCT imaging of the lamina cribrosa (LC) (red box) was performed after altering IOP and/or ICP. (B) A sagittal slice of the OCT volume. White dotted line denotes the plane of the (C) enface view of the ONH. (D) At every given ICP, IOP was altered and the ONH was imaged after allowing the tissue to stabilize for 5 minutes at every IOP condition. After completing all IOP conditions, a new ICP was set and the IOP conditions repeated.
Fig 2
Fig 2. Image analysis procedure.
(A) Images were adjusted for isotropic dimensions, (B) and rotated to match the angle of Bruch membrane opening (BMO). (C) Images were translated in the axial direction to match the axial height of the BMO. (D) The microstructures were aligned manually via 3D rotation and translation. (E) Visible LC was denoted and a common overlapping region (white color region) was used for analysis.
Fig 3
Fig 3. Example of variations in lamina cribrosa (LC) microstructure with pressure modulation.
(A) enface images show variation in the vasculature (red arrows) with differences in intracranial pressure. (B) Matching regions of the LC also feature prominent changes in LC microstructure, with decreased pore diameter and beam thickening observed with higher intracranial pressure (ICP; right), at a fixed intraocular pressure (IOP).
Fig 4
Fig 4. Matching LC microstructure between enface OCT images (left column) and histology (right column).
Color lines and arrow (bottom row) were added to illustrate some of the corresponding ONH structures. Note the similarity in structures discernible with both techniques, including the details of collagen beams and pores of the LC.
Fig 5
Fig 5. Change in lamina cribrosa (LC) beam thickness with intraocular (IOP) and intracranial pressure (ICP).
(A) Contour plot showing change in beam thickness as a function of IOP and ICP. Black lines indicate the contour line at the same beam thickness. Blue dots indicate actual measurements acquired in the experiments. A sample of the contour plot at a set of (B) fixed ICP (ICP = 10mmHg, brown line; ICP = 35mmHg, dark green) and (C) fixed IOP (IOP = 10mmHg, purple; IOP = 45mmHg, light blue) conditions demonstrate the complex interaction between IOP and ICP on beam thickness.
Fig 6
Fig 6. Change in lamina cribrosa (LC) pore diameter with intraocular (IOP) and intracranial (ICP) pressure.
(A) Contour plot showing change in beam pore ratio as a function of IOP and ICP. Black lines indicate the contour line at the same pore diameter. Blue dots indicate actual measurements acquired in the experiments. A sample of the contour plot at a set of (B) fixed ICP (ICP = 10mmHg, brown line; ICP = 35mmHg, dark green) and (C) fixed IOP (IOP = 10mmHg, purple; IOP = 45mmHg, light blue) conditions demonstrate the complex interaction between IOP and ICP on pore diameter.
Fig 7
Fig 7. Change in lamina cribrosa (LC) beam thickness to pore diameter ratio with intraocular (IOP) and intracranial (ICP) pressure.
(A) Contour plot showing change in beam pore ratio as a function of IOP and ICP. Black lines indicate the contour line at the same beam thickness to pore diameter ratio. Blue dots indicate actual measurements acquired in the experiments. A sample of the contour plot at a set of (B) fixed ICP (ICP = 10mmHg, brown line; ICP = 35mmHg, dark green) and (C) fixed IOP (IOP = 10mmHg, purple; IOP = 45mmHg, light blue) conditions demonstrate the complex interaction between IOP and ICP on beam pore ratio.
Fig 8
Fig 8. Monkey specific response to pressure modulation.
Scatterplot of beam thickness, pore diameter, and beam thickness to pore diameter ratio versus translaminar pressure difference (TLPD) for the 5 monkeys (color-coded). Each line indicated the line of best fit to help illustrate the trend.

References

    1. Quigley HA. Glaucoma. The Lancet. 2011;377(9774):1367–77. - PubMed
    1. Hernandez MR. The optic nerve head in glaucoma: role of astrocytes in tissue remodeling. Prog Retin Eye Res. 2000;19(3):297–321. - PubMed
    1. Burgoyne CF. A biomechanical paradigm for axonal insult within the optic nerve head in aging and glaucoma. Exp Eye Res. 2011. August;93(2):120–32. doi: 10.1016/j.exer.2010.09.005 - DOI - PMC - PubMed
    1. Kwon YH, Fingert JH, Kuehn MH, Alward WLM. Primary open-angle glaucoma. N Engl J Med. 2009. March 12;360(11):1113–24. doi: 10.1056/NEJMra0804630 - DOI - PMC - PubMed
    1. Tso M, Hayreh S. Optic disc edema in raised intracranial pressure: IV. Axoplasmic transport in experimental papilledema. Arch Ophthalmol. 1977. August 1;95(8):1458–62. - PubMed