. 2018 Jan 9;46(1):242-255.
doi: 10.1093/nar/gkx1147.

DNA polymerase beta participates in DNA End-joining

Affiliations

DNA polymerase beta participates in DNA End-joining

Sreerupa Ray et al. Nucleic Acids Res. .

Abstract

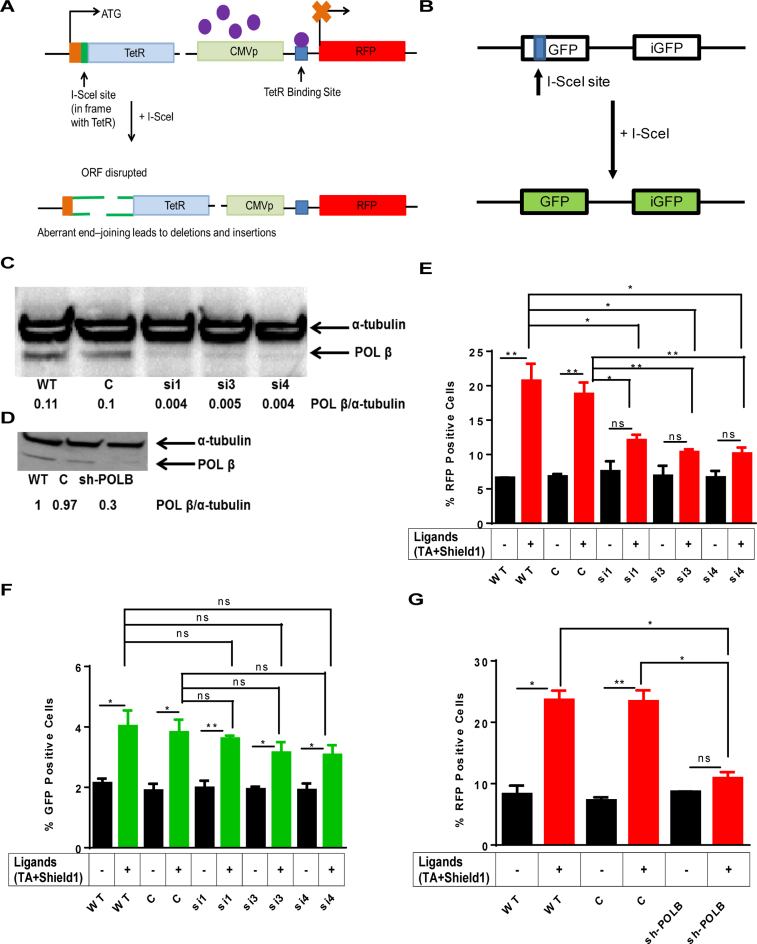
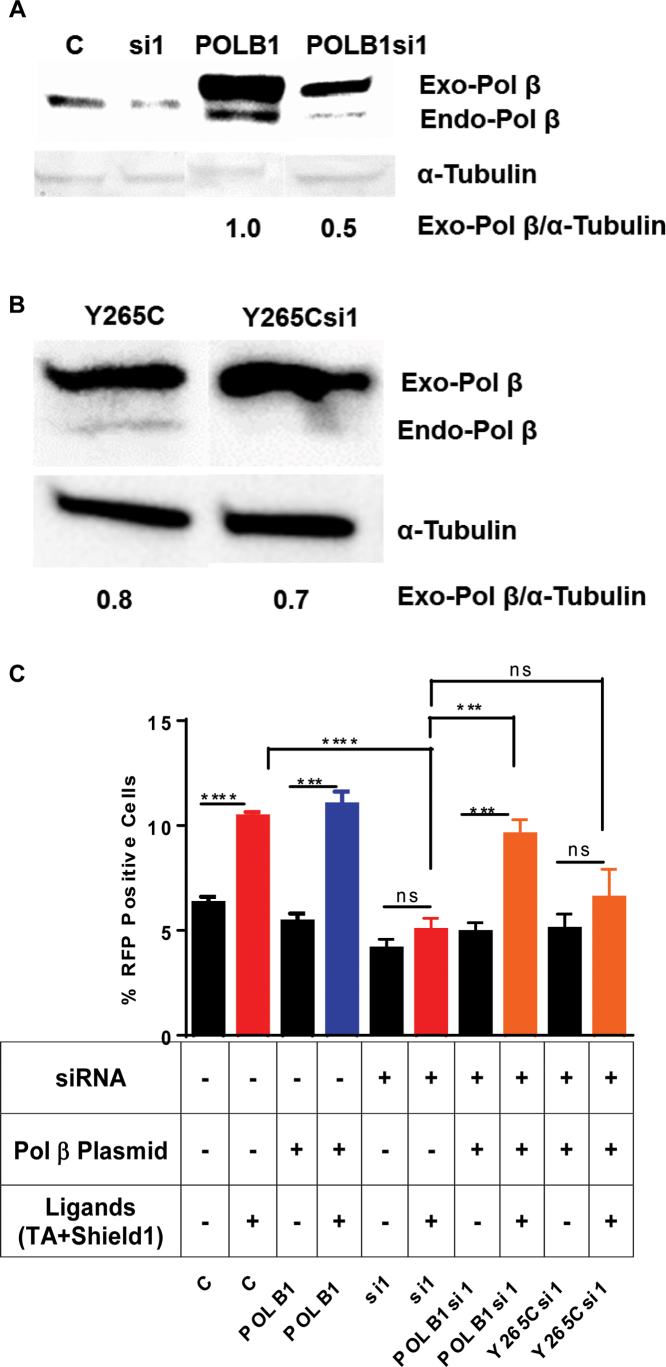
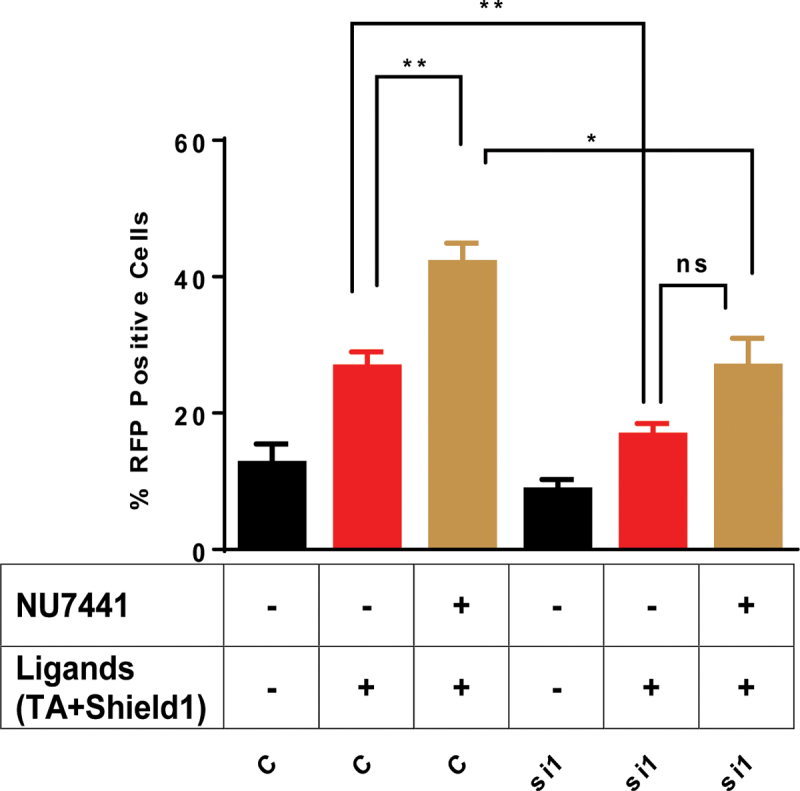
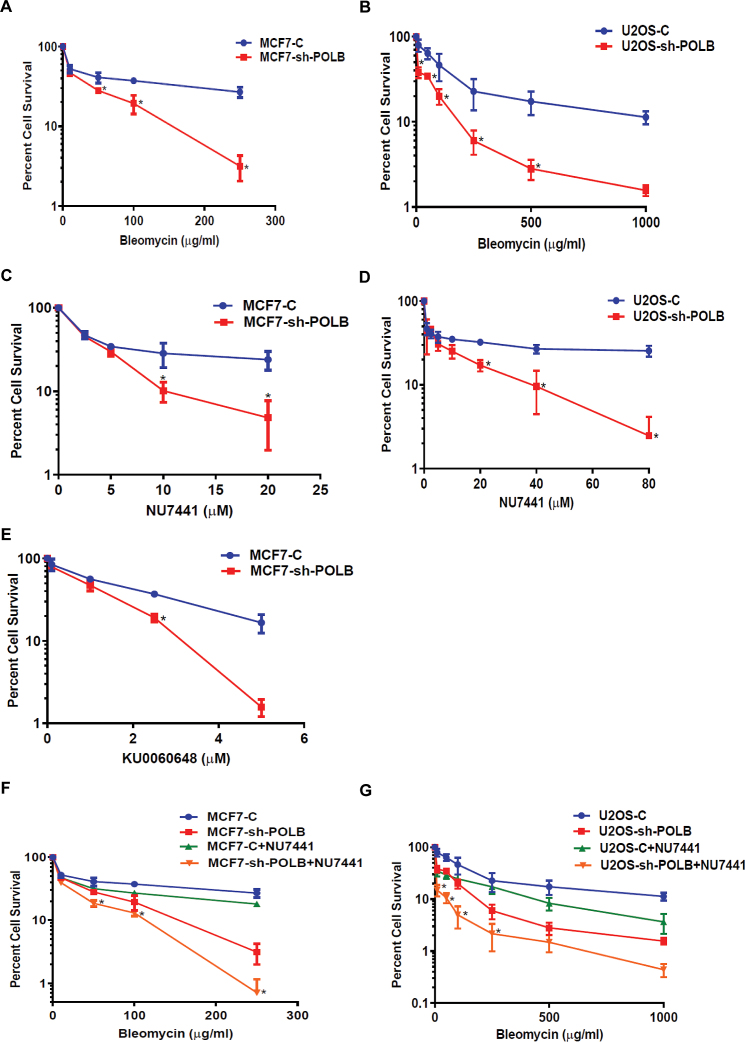
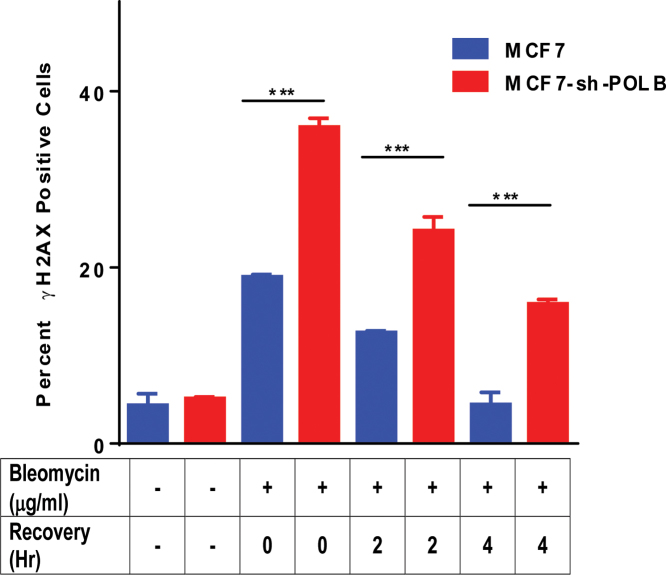
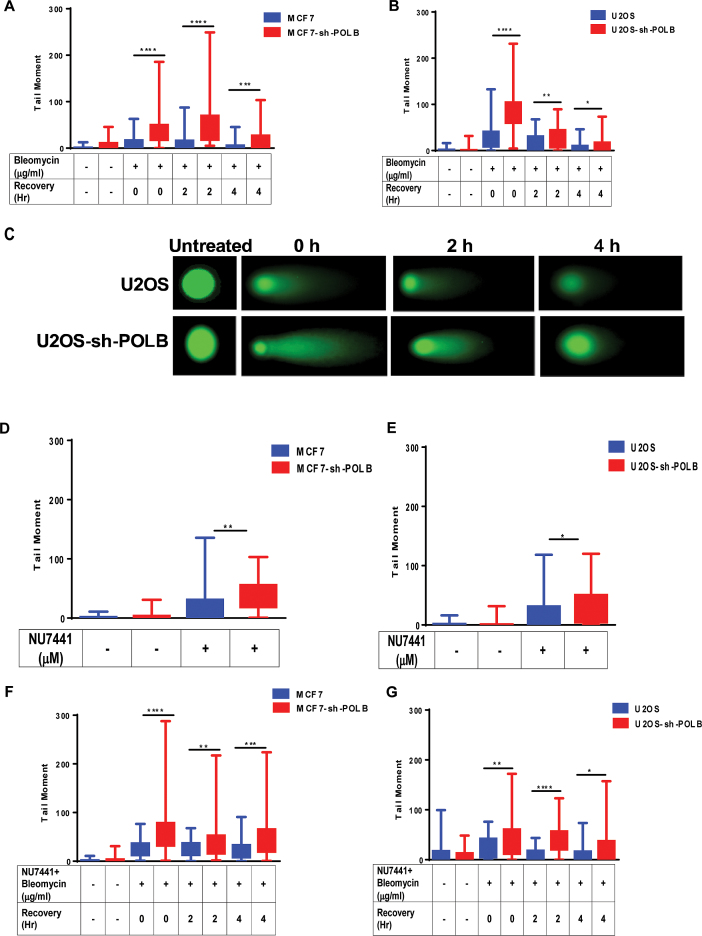
DNA double strand breaks (DSBs) are one of the most deleterious lesions and if left unrepaired, they lead to cell death, genomic instability and carcinogenesis. Cells combat DSBs by two pathways: homologous recombination (HR) and non-homologous end-joining (NHEJ), wherein the two DNA ends are re-joined. Recently a back-up NHEJ pathway has been reported and is referred to as alternative NHEJ (aNHEJ), which joins ends but results in deletions and insertions. NHEJ requires processing enzymes including nucleases and polymerases, although the roles of these enzymes are poorly understood. Emerging evidence indicates that X family DNA polymerases lambda (Pol λ) and mu (Pol μ) promote DNA end-joining. Here, we show that DNA polymerase beta (Pol β), another member of the X family of DNA polymerases, plays a role in aNHEJ. In the absence of DNA Pol β, fewer small deletions are observed. In addition, depletion of Pol β results in cellular sensitivity to bleomycin and DNA protein kinase catalytic subunit inhibitors due to defective repair of DSBs. In summary, our results indicate that Pol β in functions in aNHEJ and provide mechanistic insight into its role in this process.


Figures

Figure 1.
Figure 1.
(A) Schematic of the mutagenic end-joining. The aNHEJ construct consists of a TetR gene with the I-SceI endonuclease site incorporated in-frame so that Tet Repressor (TetR) is produced. It also consists the red expression protein (RFP) gene under the control of CMV promoter and the TetO binding site is in between the CMV promoter and the RFP gene. The purple circles represent the TetR that binds to the TetO and represses expression of RFP. Upon induction of I-SceI, if the TetR ORF is disrupted and if not joined correctly, results in loss of TetR binding to its recognition sequence TetO in the reporter gene plasmid, thus leading to the expression of RFP. Therefore, the loss of TetR is due to circumstances of mutagenic end-joining. (B) The GFP reporter is also shown. (C) Western blot showing depletion of Pol β using siRNA targeting of the POLB gene. WT is wild-type no treatment control, C denotes cells treated with siGENOME RISC-free negative control non-targeting siRNA, and si1, si3, and si4 denote cells treated with three different siRNAs targeting the POLB gene. α-tubulin is used as a loading control. Pol β/α-tubulin indicates the ratio of the intensity of the Pol β band over the α-tubulin band in each lane and is a reflection of the relative amount of Pol β that is depleted from the cells. (D) Western blot showing depletion of Pol β by an shRNA targeting the POLB gene. C denotes cells treated with a non-targeting shRNA, and sh-POLB denotes cells treated with an shRNA that targets the POLB gene. (E) aNHEJ is suppressed in cells treated with siRNA directed against POLB. Quantification of the flow cytometry plots for U2OS EJ-DR cells. WT, C, si1, si3 and si4 denote levels of RFP+ cells without ligands and WT+, C+, si1+, si3+ and si4+ denote RFP+ cells treated with TA and Shield1 to induce cutting at the I-SceI site. The percentage of RFP+ cells is plotted on the Y-axis. Data are graphed as mean ± SEM (n = 3) ** (P ≤ 0.0099), * (P ≤ 0.04) and P = ns (not significant). (F) HR is slightly suppressed in Pol β-depleted cells. Quantification of the flow cytometry plots for U2OS EJ-DRs cells. WT, C, si1, si3 and si4 denote levels of GFP+ cells without ligands. WT+, C+, si1+, si3+ and si4+ indicate GFP+ cells treated with TA and Shield1. C+ and si1+, si3+ and si4+. The percentage of GFP+ cells plotted on the Y-axis. Data are graphed as mean ± SEM (n = 3) ** (P = 0.003), * (P ≤ 0.04) and P = ns (not significant). (G) DNA end-joining is suppressed in Pol β-depleted cells. Pol β was depleted using an shRNA targeting the POLB gene. WT denotes mock-treated cells, C denotes cells treated with a non-targeting shRNA control and sh-POLB denotes cells treated with an shRNA targeted against the POLB gene. The percentage of RFP+ cells plotted on the Y-axis. Data are graphed as mean ± SEM (n = 3) ** (P = 0.001), * (P ≤ 0.004) and P = ns (not significant).
Figure 2.
Figure 2.
Overexpression of Pol β rescues the deficiency of mutagenic end-joining in Pol β-depleted cells. (A) Western blot. Exogenous-Pol β (Exo-Pol β) is exogenously expressed Pol β from the siRNA-resistant plasmid harboring the POLB cDNA and endogenous-Pol β (Endo-Pol β) is endogenously expressed protein. C denotes negative non-targeting siRNA control; si1 denotes cells treated with si1 targeted against the POLB gene; POLB1 denotes overexpression of Pol β protein in cells by treating them with a plasmid harboring the cDNA of the POLB gene that is resistant to si1; POLBsi1 denotes cells treated with both siRNA1 targeting the POLB gene and a plasmid overexpressing Pol β. The exogenously expressed protein carries an HA epitope tag, resulting in its slower resolution, versus endogenous protein, in the gel. Quantification at the bottom of the image Exo-Pol β/tubulin. (B) Exogenous-Y265C-Pol β (Exo-Pol β-Y265C) is exogenously expressed Pol β from the siRNA-resistant plasmid harboring the Y265C POLB cDNA and endogenous-Pol β (Endo- Pol β) is endogenously expressed protein. Y265C denotes overexpression of Y265C-Pol β protein in cells by treating them with a plasmid harboring the cDNA of the Y265C POLB gene that is resistant to si1; Y265Csi1 denotes cells treated with both siRNA1 targeting theY265C POLB gene and a plasmid overexpressing Y265C-Pol β. The exogenously expressed protein carries an HA epitope tag, resulting in it's slower resolution, versus endogenous protein, in the gel. (C) Overexpression of Pol β rescues the aNHEJ deficiency in cells treated with siRNA targeting the POLB gene. But the overexpression of Y265C-Pol β does not rescue the aNHEJ deficiency. The percentage of RFP+ cells plotted on the Y-axis. Data are graphed as mean ± SEM (n = 3) **** (P < 0.0001) *** (P = 0.0009) and P = ns (not significant).
Figure 3.
Figure 3.
Mutagenic end-joining is suppressed in the presence of DNA-PKcs inhibitor upon depletion of Pol β. Quantification of the flow cytometry plots for U2OS EJ-DRs cells. Cells were treated with a non-targeting siRNA (C) or siRNA 1 that targets the POLB gene (si1). NU7741 is an inhibitor of DNA-PKcs and its addition to the cells is indicated by +. The addition of the ligands needed to induce expression of I-SceI is indicated by +. The percentage of RFP+ cells plotted on the Y-axis. Data are graphed as mean ± SEM (n = 3) ** (P ≤ 0.004), * (P = 0.02) and P = ns (not significant).
Figure 4.
Figure 4.
Pol β-depleted cells are sensitive to BLM and NU7441 and KU0060648. (A) MCF7-Pol β-depleted cells are sensitive to BLM. (B) U2OS-Pol β-depleted cells are sensitive to BLM. (C) MCF7-Pol β-depleted cells are sensitive to DNA-PKcs inhibitor NU7441. (D) U2OS-Pol β-depleted cells are sensitive to DNA-PKcs inhibitor NU7441. (E) MCF7-Pol β-depleted cells are sensitive to DNA-PKcs inhibitor KU0060648. (F) MCF7-Pol β-depleted cells are more sensitive to BLM when pre-treated with DNAPKcs inhibitor. Pol β-depleted MCF7 cells were pre-treated with 10 μM DNA-PKcs inhibitor for 24 h. Cells were then treated with a range of concentrations of 10, 50, 100 and 250 μg/ml BLM for 24 h. (G) U2OS-Pol β-depleted cells are more sensitive to BLM when pre-treated with DNA-PKcs inhibitor. Pol β-depleted U2OS cells were pre-treated with 10 μM DNA-PKcs inhibitor for 24 h. Cells were then treated with a range of concentrations of 10, 50, 100, 250, 500 and 1000 μg/ml BLM for 24 h. * (P = 0.05).
Figure 5.
Figure 5.
Persistence of γH2AX positive cells in Pol β-depleted cells even after 4 h recovery time. MCF7 and MCF7-sh-POLB cells were treated with 50 μg/ml BLM for 1 h and allowed to recover for 0, 2 and 4 h and analyzed by flow cytometry. Cells were stained with γH2AX antibody to assess the levels of DSBs. Data are plotted as the mean ± SEM (n = 3) *** (P < 0.0001).
Figure 6.
Figure 6.
Pol β-depleted cells have increased levels of DSBs upon treatment with BLM or NU7441. (A) MCF7 and MCF7-sh-POLB cells were treated with 50 μg/ml BLM for 1 h and allowed to recover for 0, 2 and 4 h. DSBs were analyzed by the neutral comet assay. The tail moment is plotted on the Y-axis. ** (P = 0.0028); ****(P < 0.0001). (B) U2OS and U2OS-sh-POLB cells were treated with 50 μg/ml BLM for 1 h and allowed to recover for 0, 2 and 4 h. DSBs were analyzed by the neutral comet assay. The tail moment is plotted on the Y-axis. * (P = 0.03); ** (P = 0.005); ****(P < 0.0001). (C) Representative images from each time point of recovery post BLM treatment for U2OS and U2OS Pol β-depleted cells. (D) MCF7 and MCF7-sh-POLB cells were treated with 10 μM NU7441 for 24 h. DSBs were analyzed by the neutral comet assay. The tail moment is plotted on the Y-axis. ** (P = 0.0012). (E) WT U2OS and U2OS-sh-POLB cells were treated with 10 μM NU7441 for 24 h. DSBs were analyzed by the neutral comet assay. The percentage of tail DNA is plotted on the Y-axis. * (P = 0.020). (F) MCF7 and MCF7-sh-POLB cells were treated with 10 μM NU7441 for 24 h and then treated with 50 μg/ml BLM for 1 h and allowed to recover for 0, 2 and 4 h. DSBs were analyzed by the neutral comet assay. The tail moment is plotted on the Y-axis. ** (P = 0.003); *** (P = 0.0006); ****(P < 0.0001). (G) U2OS and U2OS-sh-POLB cells were treated with 10 μM NU7441 for 24 h and then treated with 50 μg/ml BLM for 1 h and allowed to recover for 0, 2 and 4 h. DSBs were analyzed by the neutral comet assay. The tail moment is plotted on the Y-axis. * (P = 0.03); ** (P = 0.009); ****(P < 0.0001).

References

    1. Rothkamm K., Kruger I., Thompson L.H., Lobrich M.. Pathways of DNA double-strand break repair during the mammalian cell cycle. Mol. Cell. Biol. 2003; 23:5706–5715. - PMC - PubMed
    1. Saleh-Gohari N., Helleday T.. Conservative homologous recombination preferentially repairs DNA double-strand breaks in the S phase of the cell cycle in human cells. Nucleic Acids Res. 2004; 32:3683–3688. - PMC - PubMed
    1. Jackson S.P. Sensing and repairing DNA double-strand breaks. Carcinogenesis. 2002; 23:687–696. - PubMed
    1. Khanna K.K., Jackson S.P.. DNA double-strand breaks: signaling, repair and the cancer connection. Nat. Genet. 2001; 27:247–254. - PubMed
    1. Raynard S., Niu H., Sung P.. DNA double-strand break processing: the beginning of the end. Genes Dev. 2008; 22:2903–2907. - PMC - PubMed

Publication types