

Micro-spatial distribution of malaria cases and control strategies at ward level in Gwanda district, Matabeleland South, Zimbabwe
- PMID: 29162102
- PMCID: PMC5697109
- DOI: 10.1186/s12936-017-2116-1
Micro-spatial distribution of malaria cases and control strategies at ward level in Gwanda district, Matabeleland South, Zimbabwe
Abstract
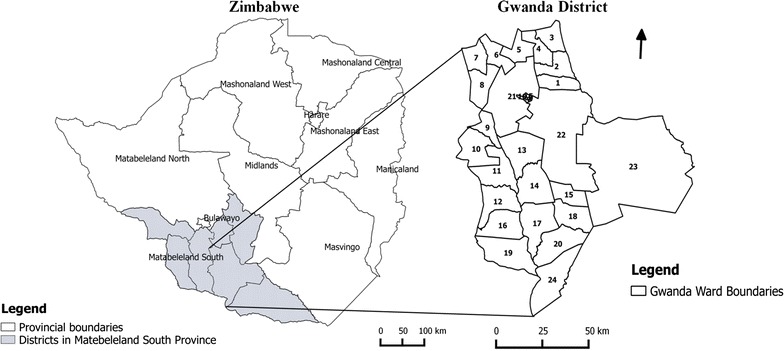
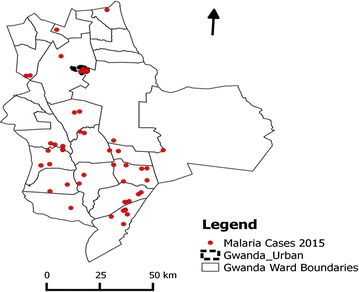
Background: Although there has been a decline in the number of malaria cases in Zimbabwe since 2010, the disease remains the biggest public health threat in the country. Gwanda district, located in Matabeleland South Province of Zimbabwe has progressed to the malaria pre-elimination phase. The aim of this study was to determine the spatial distribution of malaria incidence at ward level for improving the planning and implementation of malaria elimination in the district.
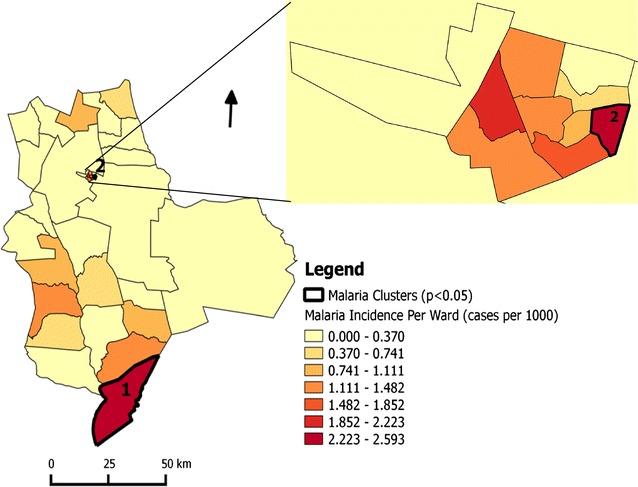
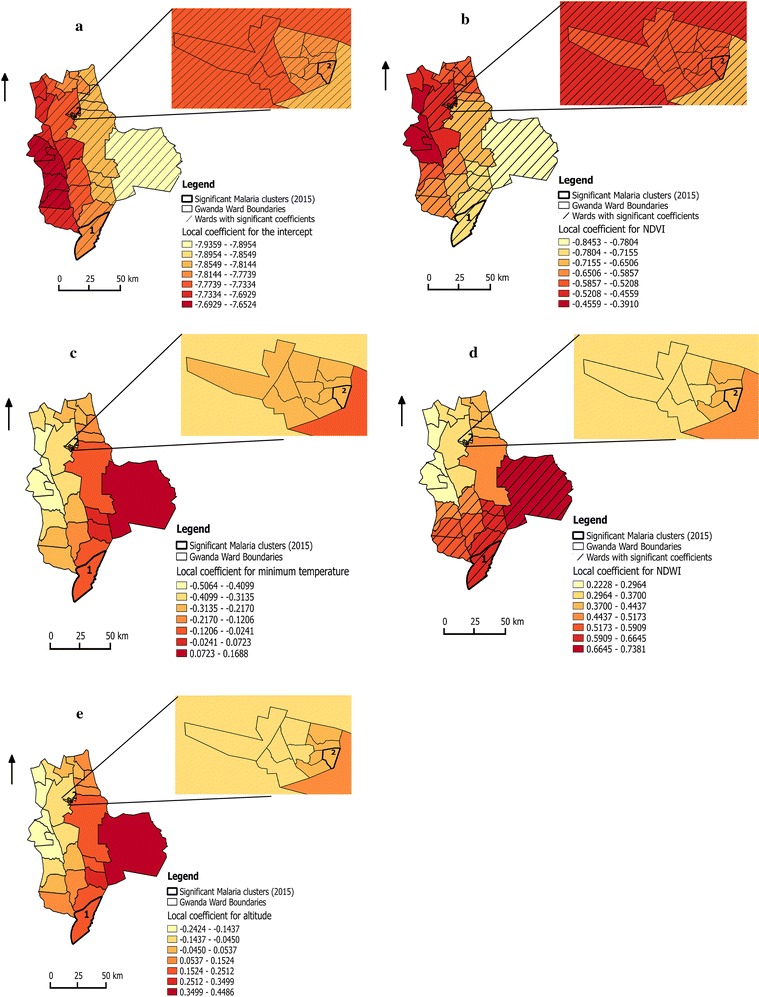
Methods: The Poisson purely spatial model was used to detect malaria clusters and their properties, including relative risk and significance levels at ward level. The geographically weighted Poisson regression (GWPR) model was used to explore the potential role and significance of environmental variables [rainfall, minimum and maximum temperature, altitude, Enhanced Vegetation Index (EVI), Normalized Difference Vegetation Index (NDVI), Normalized Difference Water Index (NDWI), rural/urban] and malaria control strategies [indoor residual spraying (IRS) and long-lasting insecticide-treated nets (LLINs)] on the spatial patterns of malaria incidence at ward level.
Results: Two significant clusters (p < 0.05) of malaria cases were identified: (1) ward 24 south of Gwanda district and (2) ward 9 in the urban municipality, with relative risks of 5.583 and 4.316, respectively. The semiparametric-GWPR model with both local and global variables had higher performance based on AICc (70.882) compared to global regression (74.390) and GWPR which assumed that all variables varied locally (73.364). The semiparametric-GWPR captured the spatially non-stationary relationship between malaria cases and minimum temperature, NDVI, NDWI, and altitude at the ward level. The influence of LLINs, IRS and rural or urban did not vary and remained in the model as global terms. NDWI (positive coefficients) and NDVI (range from negative to positive coefficients) showed significant association with malaria cases in some of the wards. The IRS had a protection effect on malaria incidence as expected.
Conclusions: Malaria incidence is heterogeneous even in low-transmission zones including those in pre-elimination phase. The relationship between malaria cases and NDWI, NDVI, altitude, and minimum temperature may vary at local level. The results of this study can be used in planning and implementation of malaria control strategies at district and ward levels.
Keywords: Cluster detection; Geographically weighted Poisson regression (GWPR) model; Malaria hotspots; Malaria pre-elimination phase.
Figures
References
-
- WHO . World malaria report 2015. Geneva: World Health Organization; 2016.
-
- Chikodzi D. Spatial modelling of malaria risk zones using environmental, anthropogenic variables and geographical information systems techniques. J Geosci Geomat. 2013;1:8–14.
-
- WHO . An information bulletin of the WCO Zimbabwe 2010. Geneva: World Health Organization; 2011.
-
- District Health Information . Malaria reoprt 2016. Harare: Government of Zimbabwe, Ministry of health and Child Care; 2016.
MeSH terms
Grants and funding
LinkOut - more resources
Full Text Sources
Other Literature Sources
Medical
